logo

Financial Analysis Management & Enterprise - FAME TABLE OF CONTENTS INTRODUCTION

25 Pages7371 Words302 Views
   

Added on  2021-02-19

About This Document

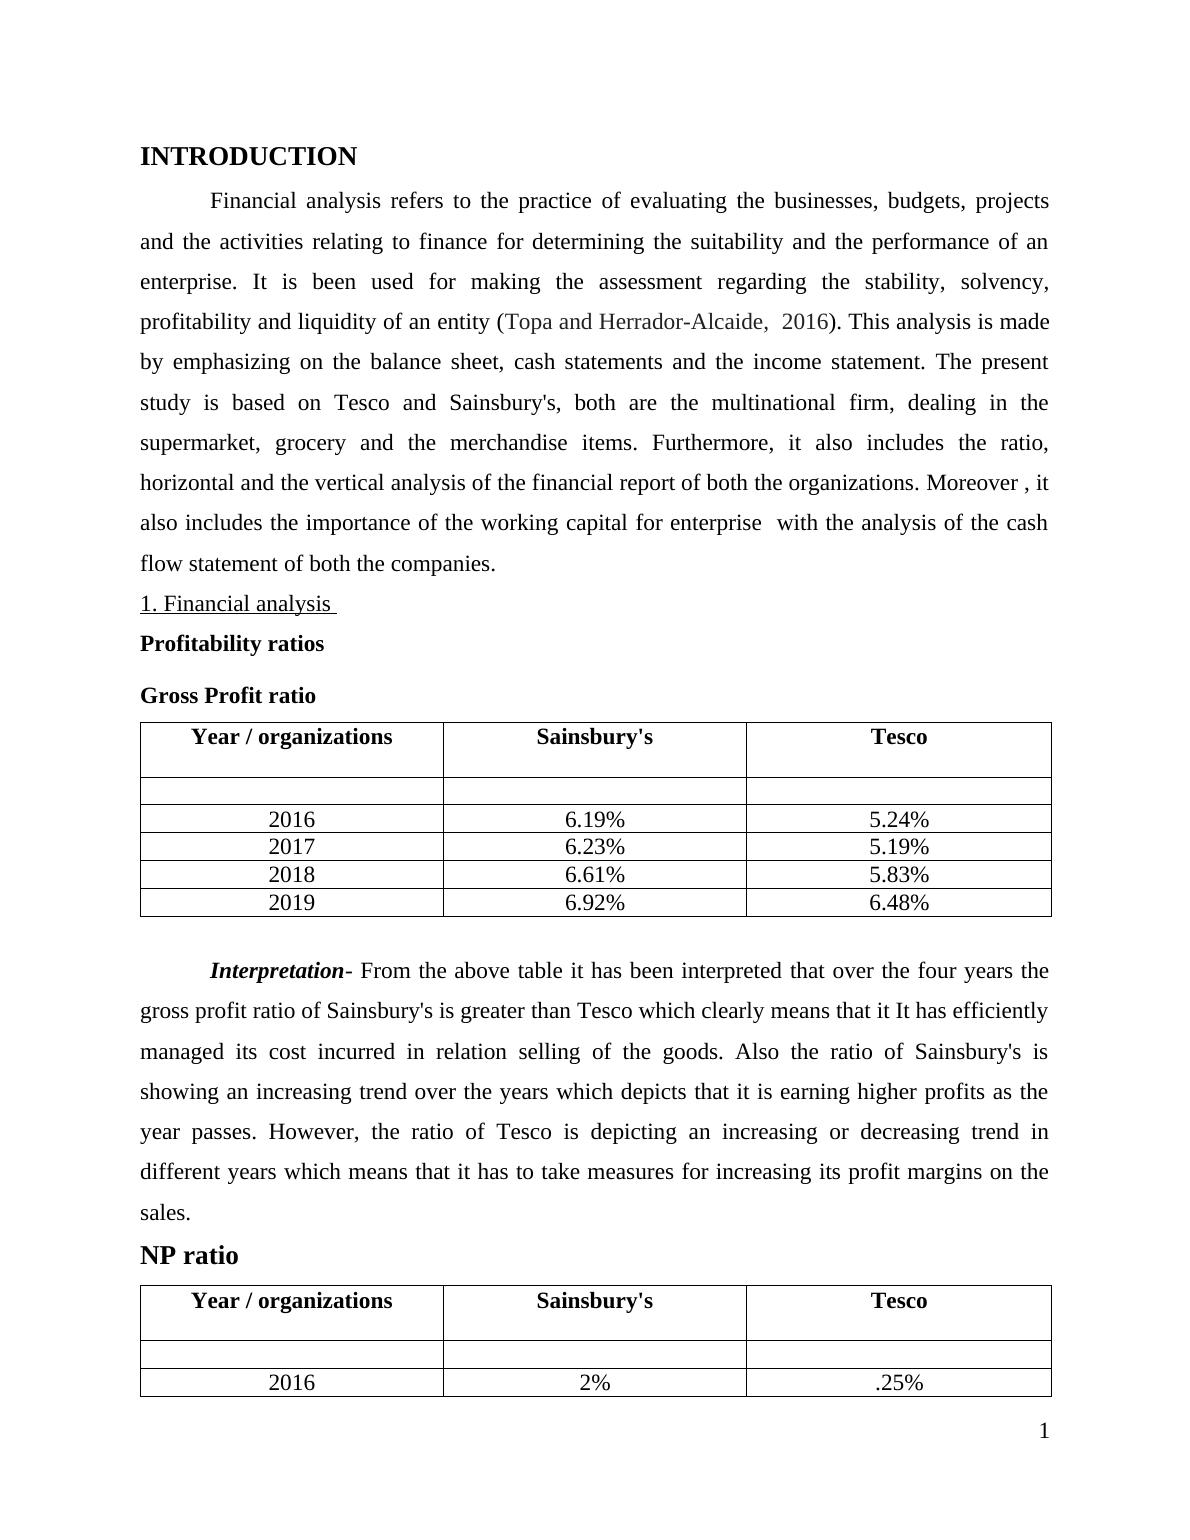
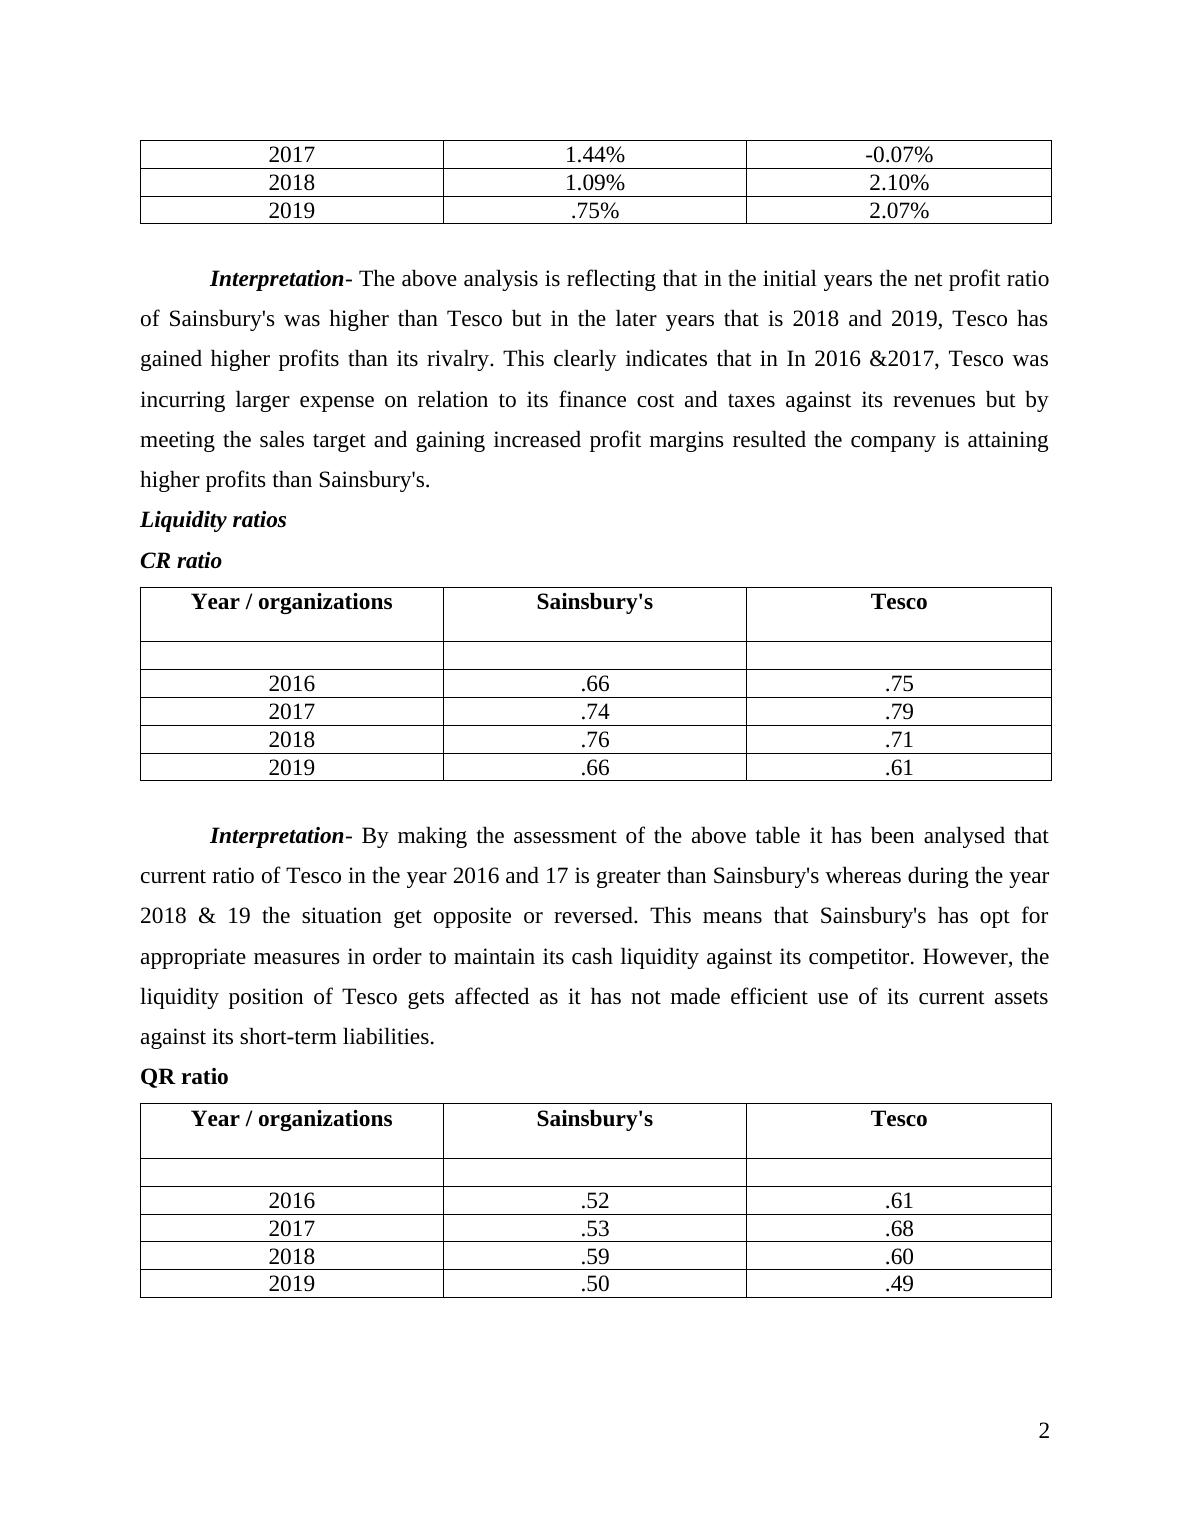
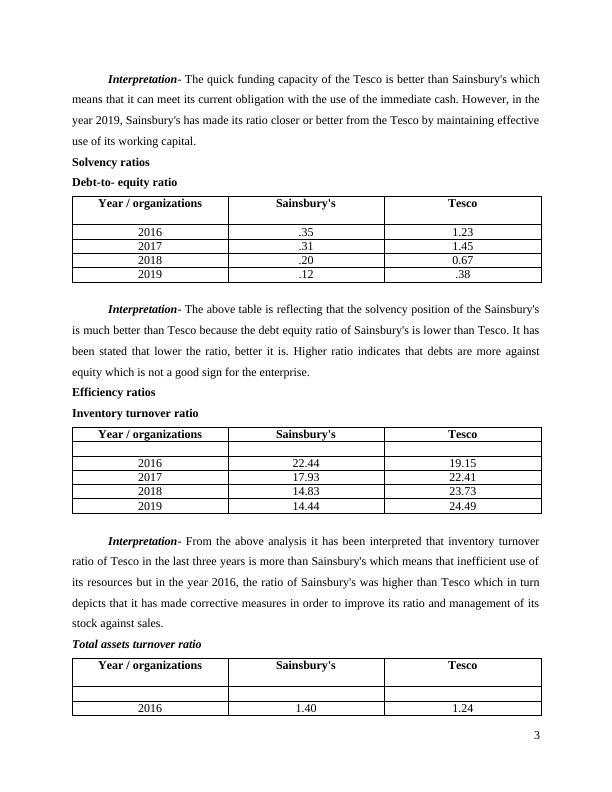
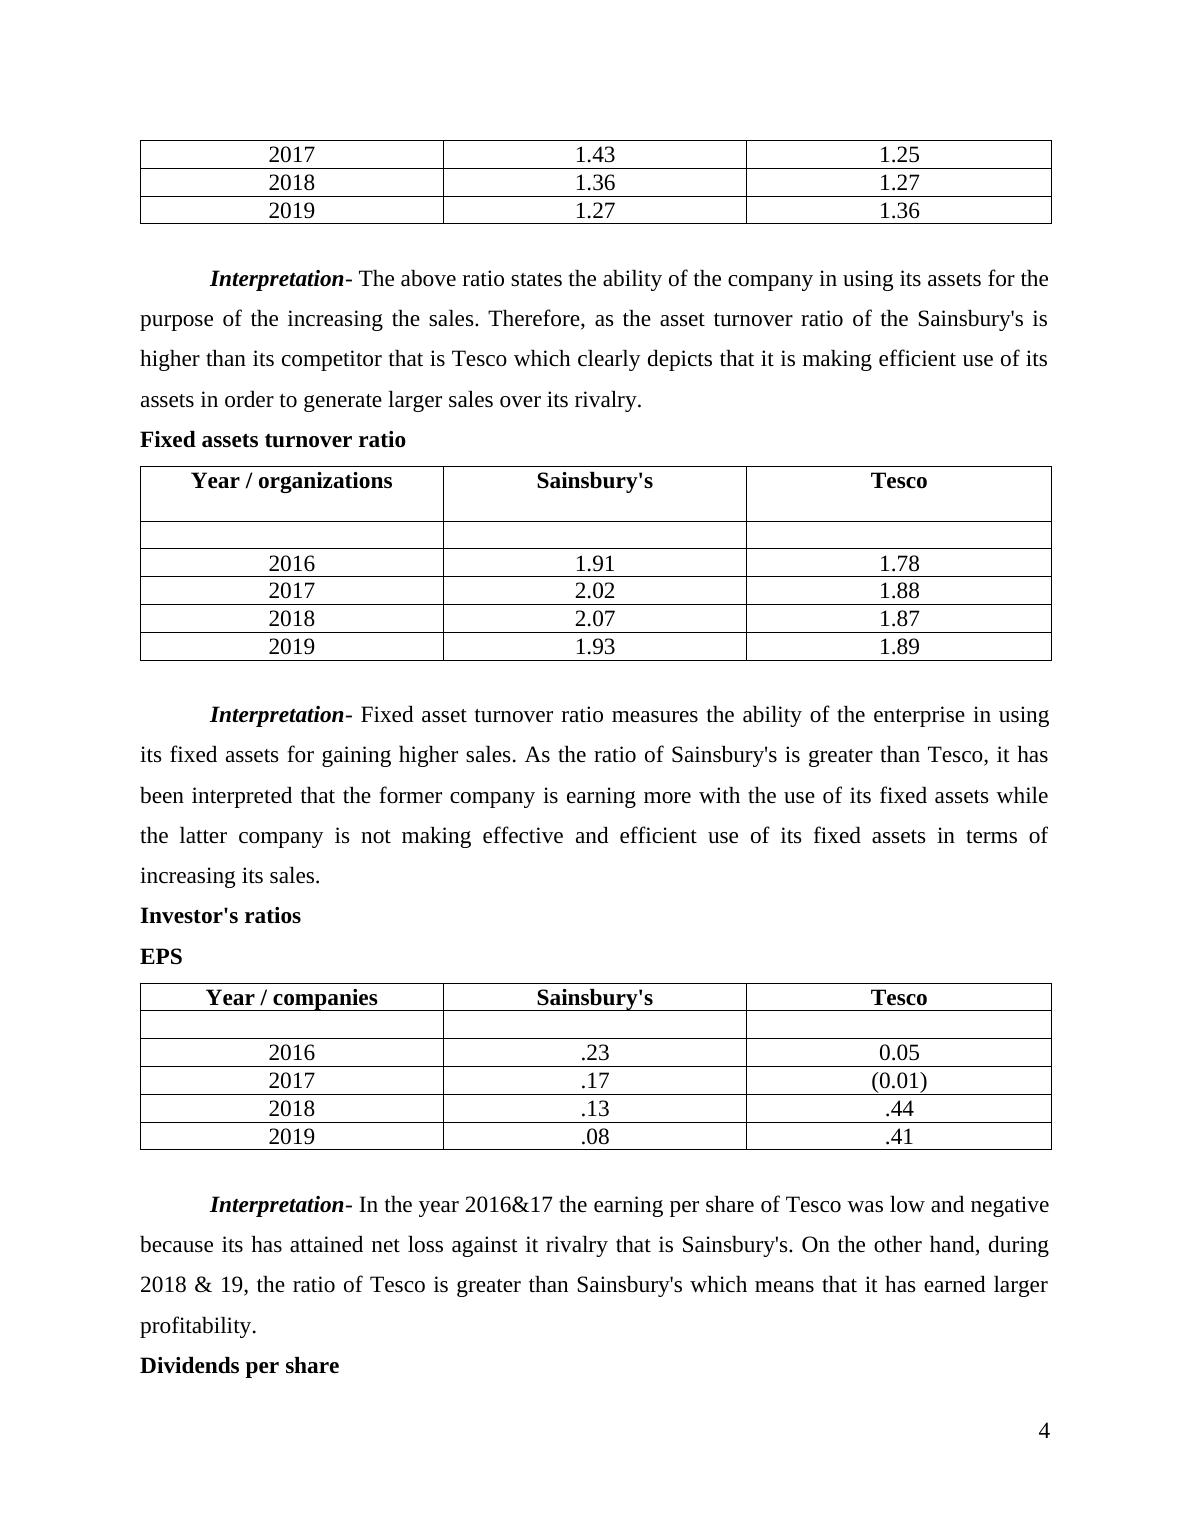
Financial analysis Profitability ratios Gross Profit ratio |Year / organizations|Sainsbury's|Tesco | | || |2016 |6.19%|5.24% | |2017 |6.23%|5.19% | |2018 |6.61%|5.83% | |2019 |6.92%|6.48% | Interpretation- From the above table it has been interpreted that over the four years the gross profit ratio of Sainsbury's is greater than Tesco which clearly means that it has efficiently managed its cost incurred in

Financial Analysis Management & Enterprise - FAME TABLE OF CONTENTS INTRODUCTION

   Added on 2021-02-19

ShareRelated Documents
Financial Analysis Management &Enterprise - FAME
Financial Analysis Management & Enterprise - FAME TABLE OF CONTENTS INTRODUCTION_1
TABLE OF CONTENTSINTRODUCTION...........................................................................................................................11. Financial analysis ...................................................................................................................1NP ratio ...........................................................................................................................................12. Outlining significance of assessing working capital of the companies.................................103. Critical assessment of cash flow report of the two companies ............................................11CONCLUSION..............................................................................................................................13REFERENCES..............................................................................................................................14
Financial Analysis Management & Enterprise - FAME TABLE OF CONTENTS INTRODUCTION_2
INTRODUCTIONFinancial analysis refers to the practice of evaluating the businesses, budgets, projectsand the activities relating to finance for determining the suitability and the performance of anenterprise. It is been used for making the assessment regarding the stability, solvency,profitability and liquidity of an entity (Topa and Herrador-Alcaide, 2016). This analysis is madeby emphasizing on the balance sheet, cash statements and the income statement. The presentstudy is based on Tesco and Sainsbury's, both are the multinational firm, dealing in thesupermarket, grocery and the merchandise items. Furthermore, it also includes the ratio,horizontal and the vertical analysis of the financial report of both the organizations. Moreover , italso includes the importance of the working capital for enterprise with the analysis of the cashflow statement of both the companies. 1. Financial analysis Profitability ratiosGross Profit ratio Year / organizationsSainsbury'sTesco20166.19%5.24%20176.23%5.19%20186.61%5.83%20196.92%6.48%Interpretation- From the above table it has been interpreted that over the four years thegross profit ratio of Sainsbury's is greater than Tesco which clearly means that it It has efficientlymanaged its cost incurred in relation selling of the goods. Also the ratio of Sainsbury's isshowing an increasing trend over the years which depicts that it is earning higher profits as theyear passes. However, the ratio of Tesco is depicting an increasing or decreasing trend indifferent years which means that it has to take measures for increasing its profit margins on thesales. NP ratio Year / organizationsSainsbury'sTesco20162%.25%1
Financial Analysis Management & Enterprise - FAME TABLE OF CONTENTS INTRODUCTION_3
20171.44%-0.07%20181.09%2.10%2019.75%2.07%Interpretation- The above analysis is reflecting that in the initial years the net profit ratioof Sainsbury's was higher than Tesco but in the later years that is 2018 and 2019, Tesco hasgained higher profits than its rivalry. This clearly indicates that in In 2016 &2017, Tesco wasincurring larger expense on relation to its finance cost and taxes against its revenues but bymeeting the sales target and gaining increased profit margins resulted the company is attaininghigher profits than Sainsbury's. Liquidity ratiosCR ratioYear / organizationsSainsbury'sTesco2016.66.752017.74.792018.76.712019.66.61Interpretation- By making the assessment of the above table it has been analysed thatcurrent ratio of Tesco in the year 2016 and 17 is greater than Sainsbury's whereas during the year2018 & 19 the situation get opposite or reversed. This means that Sainsbury's has opt forappropriate measures in order to maintain its cash liquidity against its competitor. However, theliquidity position of Tesco gets affected as it has not made efficient use of its current assetsagainst its short-term liabilities. QR ratioYear / organizationsSainsbury'sTesco2016.52.612017.53.682018.59.602019.50.492
Financial Analysis Management & Enterprise - FAME TABLE OF CONTENTS INTRODUCTION_4
Interpretation- The quick funding capacity of the Tesco is better than Sainsbury's whichmeans that it can meet its current obligation with the use of the immediate cash. However, in theyear 2019, Sainsbury's has made its ratio closer or better from the Tesco by maintaining effectiveuse of its working capital. Solvency ratiosDebt-to- equity ratio Year / organizationsSainsbury'sTesco2016.351.232017.311.452018.200.672019.12.38Interpretation- The above table is reflecting that the solvency position of the Sainsbury'sis much better than Tesco because the debt equity ratio of Sainsbury's is lower than Tesco. It hasbeen stated that lower the ratio, better it is. Higher ratio indicates that debts are more againstequity which is not a good sign for the enterprise. Efficiency ratiosInventory turnover ratio Year / organizationsSainsbury'sTesco201622.4419.15201717.9322.41201814.8323.73201914.4424.49Interpretation- From the above analysis it has been interpreted that inventory turnoverratio of Tesco in the last three years is more than Sainsbury's which means that inefficient use ofits resources but in the year 2016, the ratio of Sainsbury's was higher than Tesco which in turndepicts that it has made corrective measures in order to improve its ratio and management of itsstock against sales. Total assets turnover ratio Year / organizationsSainsbury'sTesco20161.401.243
Financial Analysis Management & Enterprise - FAME TABLE OF CONTENTS INTRODUCTION_5
20171.431.2520181.361.2720191.271.36Interpretation- The above ratio states the ability of the company in using its assets for thepurpose of the increasing the sales. Therefore, as the asset turnover ratio of the Sainsbury's ishigher than its competitor that is Tesco which clearly depicts that it is making efficient use of itsassets in order to generate larger sales over its rivalry.Fixed assets turnover ratio Year / organizationsSainsbury'sTesco20161.911.7820172.021.8820182.071.8720191.931.89Interpretation- Fixed asset turnover ratio measures the ability of the enterprise in usingits fixed assets for gaining higher sales. As the ratio of Sainsbury's is greater than Tesco, it hasbeen interpreted that the former company is earning more with the use of its fixed assets whilethe latter company is not making effective and efficient use of its fixed assets in terms ofincreasing its sales. Investor's ratiosEPSYear / companiesSainsbury'sTesco2016.230.052017.17(0.01)2018.13.442019.08.41Interpretation- In the year 2016&17 the earning per share of Tesco was low and negativebecause its has attained net loss against it rivalry that is Sainsbury's. On the other hand, during2018 & 19, the ratio of Tesco is greater than Sainsbury's which means that it has earned largerprofitability. Dividends per share 4
Financial Analysis Management & Enterprise - FAME TABLE OF CONTENTS INTRODUCTION_6

End of preview

Want to access all the pages? Upload your documents or become a member.

Related Documents
Financial Analysis and Management Assignment Sample
|18
|4697
|44

Financial Analysis Management & Enterprise Solved Assignment (Doc)
|32
|5616
|25

Financial Analysis Management & Enterprise - Assignment
|27
|5865
|58

Financial Analysis Management & Enterprise: Assignment
|31
|7584
|54

Financial Analysis Management And Enterpirse - Assignment
|25
|3947
|54

Financial analysis and management enterprise (Doc)
|22
|5808
|21