Financial Markets and Portfolio Management AAF0406
VerifiedAdded on 2023/06/13
|14
|3485
|262
AI Summary
This report discusses the reason for choosing each industry and each company’s stocks, analyses 2-years financial statements of the selected companies, compares and contrasts the selected companies, and discusses Efficient Market Hypothesis (EMH) and Capital Asset Pricing Model (CAPM) explicitly using relevant and recent literature citations.
Contribute Materials
Your contribution can guide someone’s learning journey. Share your
documents today.
Financial Markets and
Portfolio Management
AAF0406
Portfolio Management
AAF0406
Secure Best Marks with AI Grader
Need help grading? Try our AI Grader for instant feedback on your assignments.

Contents
INTRODUCTION...........................................................................................................................................3
MAIN BODY.................................................................................................................................................3
Critically discuss the reason for chosen each industry and each company’s stocks................................3
Use 2-years financial statements of the selected companies to critically discuss the following.............4
Compare and contrast the selected company.........................................................................................7
Discuss Efficient Market Hypothesis (EMH) and Capital Asset Pricing Model (CAPM) explicitly using
relevant and recent literature citations...................................................................................................8
Explain at least 2 key factors behind the major increases and decreases from the price data with
relevant citation to price fluctuation.......................................................................................................9
Critically analyse the behaviour of selected companies using the following descriptive statistics
variables................................................................................................................................................11
REFERENCES..............................................................................................................................................12
INTRODUCTION
Financial markets are required for the efficient functioning of market society. Portfolio
control is the procedure of selecting, prioritizing and controlling an organization's programmers
and initiatives in accordance with its set initiatives and delivery capabilities. The objective is to
tread a fine line between successfully implementing projects and keeping regular activities with
maximizing financial return. For this report selected Tesco company which is retail sector
organisation that is listed in London stock exchange. Along with company select another
company Sainsbury which is also registered in London stock exchange and retail sector
organization. In this report consist of reason of selected industry and analysis of every
organisation stock. Moreover, analysis the background, size, market share, financial position,
EPS, marketing to book ratio. Identify 2 key factors behind increase and decrease of time series
data and conduct descriptive statistical analysis in broad manner.
MAIN BODY
Critically discuss the reason for chosen each industry and each company’s stocks
Retail industry: Retail is a large sector, with everything from clothing stores to coffee
houses, from the heart of towns to the online market, from its most promising developments to
the catastrophic. They'll look at the retail operation and its unique characteristics in this post.
Because it acts as a form of diagnostic for the economy over time, the retail industry is
frequently considered to as one of the most important for economy development. Production
rises in a robust economy, and wealth is reflected in consumer spending, which is primarily
centered on retailing.
Whenever the marketplace is increasing, retail is an appealing industry for a development
investment due to its proclivity for delivering larger-than-average gains. Automobile,
construction supplies, wholesalers, groceries and food, internet, generic, and specialized line or
retail stores are the seven distinct categories of retail securities. They all tend to mirror the
marketplace overall, but with a higher riskiness, which implies bigger profits throughout bull
markets and large losses whenever the bears come out swinging. For this industry select Tesco
and Sainsbury which have leading position and competitor of each other.
Secure Best Marks with AI Grader
Need help grading? Try our AI Grader for instant feedback on your assignments.
Pharmaceuticals: The pharmaceutical sector creates, produces, and distributes pharmaceuticals.
Its aim is not to define sickness. In practice, pharmaceutical firms' drugs target disorders that
have historically been identified by the medical community. The majority of the company's
earnings come from pharmacy businesses that manufacture prescribed, inexpensive, or above
medications for medicinal usage. In this industry selected AstraZeneca and GlaxoSmithKline.
Both company has good position in the market.
Mining industry: Currently, the majority of mineral output in the UK is made up of building
supplies and mineral products. In the United Kingdom, massive volumes of limestone’s are still
produced and crushed. The South West of England has the greatest concentration of met
sediments old mines. For this sector selected Anglo American and Rio Tinto which have good
stock in the market.
Finance industry: The financial services industry generated £164.8 billion to the UK economy
in 2020, accounting for 8.6 percent of overall economic activity. The sector was centred on
London, wherein half of its production was created. In terms of its share of overall wealth
creation, the UK financial services industry was the third biggest in the OECD in 2020. In this
industry selected two companies are Barclays and Prudential which have good position and listed
in LSE.
Oil and gas industry: As of 2016, the United Kingdom ranked 30th in the world with
2,754,685,000 tonnes of proved oil resources, representing for around 0.2 percent of the total
worldwide oil deposits of 1,650,585,140,000 barrels. The UK has gas reserves that are
comparable to 4.8 times its yearly usage. In this industry selected Glenore and BP Plc because of
have good position in this industry.
Use 2-years financial statements of the selected companies to critically discuss the following
Analysis of key information:
Tesco Plc
Background: Tesco PLC is a global supermarket and basic products store based in the United
Kingdom. Its headquarters are located in Cheshunt, Hertfordshire, England. Tesco is the
country's second supermarket in terms of profitability, and the consequently merchant in terms of
revenue growth, after Wal-Mart and Carrefour. Tesco operates 14 locations in Asia, North
America, and Europe. Tesco is also the supermarket chain member of the United Kingdom,
which has a customer base of about 30%, the Republic of Ireland, Malaysia, and Thailand,
according to the data.
Size: Tesco Metro shops were between 1,000 sq m in size, similar to Tesco big box stores and
Tesco Fast shops. In 2021, Tesco will have 4,673 stores worldwide, including franchised
locations. Tesco PLC, a multinational grocery and consumer goods corporation, was founded by
Jack Cohen in 1919.
Financial position: The financial perspective analyses the company budgetary objectives and
allows for the use of conventional financial benchmarks to assess financial performance. Despite
the reality that it may seem to be a too rudimentary method for a comprehensive evaluation, this
point of view is capable of interpreting how the business's plans might effect the profitability of
the business. As per the firm's most recent financial statistics, it was able to increase total income
by the more than 11% yearly, increasing total sales to more over £56 billion in 2019 (Tesco,
2019), up form £51 billion in 2018.
Dividends: Tesco plc's upcoming dividend is slated to go ex in 3 months and be paid in four.
Tesco plc's recent dividend was 3.2p, which declared ex four months ago and it was payable
three months ago. Payments are typically paid twice a year (except specials), with a payout cover
of about 2.3.
Market share: Tesco, along with Asda, Sainsbury's and Morrisons, is the Biggest International
food retailer, having existing customers of over 25%. Together with Asda, Sainsbury's, and
Morrisons, Tesco has been one of the 'big four' retailers. According to Kantar Intelligence, the
FTSE 100 grocery powerhouse boosted its customer base by 0.2 percent to 27.4 percent in
February 2021, the first gain since December 2016, as sales figures jumped 13.2 percent. Tesco's
stellar success was matched across its circle of acquaintances, with revenues rising by 15.1 % in
the four weeks ending February 21, the fastest rate of growth until June 2020.
Market to book ratio: The book value per share of TESCO PLC ORD is around 1.64 times,
according to publicly disclosed financial data. This is 91.26 percent less than the Consumption
Protective sector's average and 92.93 percent less than the Large Supermarkets industry's
average. All UK stocks have a book value per share that is 99.92 points greater than the
industry's.
Earnings per share: Tesco's EPS (Earnings Per Share) increased by 30% to £15.4 per share, and
also a 92 percent increase in payouts, which were paid out at £5.77 in amount equal to £3 in
2018. The growth in revenue was matched by a decrease in spending, resulting in a 17 percent
increasing operating revenue versus an 11 percent annual growth. This shows that the company's
goal would have been to generate returns while minimizing expenses via the adoption of efficient
principles and methods. It can be seen from this company's identity that the company's
procedures contribute to their final result.
Sainsbury Plc
Background: Sainsbury's was established in 1919 by John James and Mary Ann Sainsbury, and
it swiftly grew to become the UK's largest food store in 1922, and also the country's first brand
store. The 1980s were its most affluent years. It is the United Kingdom's earliest important food
retailing chain. The original values and ideals still motivate us now, as they did in the
beginnings, to be the person's first choice for food spending by providing outstanding products,
excellent price, and exceptional service.
Size: J Sainsbury Plc is a supermarket and convenience store company with 872 locations,
including 537 shops and 335 grocery stores, as well as Sainsbury's Banking. Sainsbury's
currently serves approximately 19 million people weekly basis. Sainsbury's is a vast shop with
over 30,000 goods, 40 percent of which are Sainsbury's own label. Non-food items and facilities
are offered at many shops. Almost 60% of our businesses are in town centres or on the outskirts
of town, with many of them built on historically derelict properties. They have 150,000
coworkers, 70% of whom are component and 30% of whom are comprehensive. It is the UK's
3rd biggest food retailer, with a 16 percent market share, following worldwide powerhouse
Tesco (31% share) and Wal-Mart-owned ASDA (17%). (http://www.Hemscott.com/).
Approximately 90% of UK homes have access to a world wide web delivered online store.
Financial position: Ever since coronavirus outbreak, the company has claimed a 10.5 percent
boost in supermarket purchases, including more than tripling its online income. Furthermore, the
Paraphrase This Document
Need a fresh take? Get an instant paraphrase of this document with our AI Paraphraser
company's clothes and gasoline sales have begun to rebound "more swiftly than predicted," and
its finance sector has a better asset condition than at the end of the previous year.
Dividends: J For the previous fiscal year, Sainsbury plc normally pays interest in December and
a last payout in July. The next instalment from Sainsbury (J) plc is due in four months and will
be paid in five. The most current dividend payout by Sainsbury (J) plc was 3.2p, which came ex
3 months ago and was received 2 months ago. Other than in rare circumstances, bonds are
normally paid times per year, with a monthly coverage of roughly 2.0.
Market share: Tesco and Sainsbury's had the major market share over the timeframe studied,
accounting for 42.3 percent of market share as of May 2021.
Market to book ratio: J Sainsbury (JSAIY) historic price to book ration in the last 10 years. J
Sainsbury's market valuation ratio is 0.97 as of February 10, 2022.
Earnings per share: The Earnings per Share (Diluted) of Sainsbury (J) for the six months
ending September 2021 was $0.23. For the previous 12 months (TTM) ending in September
2021, earnings per share (dissolved) were $0.16. The EPS (Basic) of Sainsbury (J) for the six
months ending September 2021 was $0.24. For the previous 12 months (TTM) ending in
September 2021, its EPS (Basic) was $0.17.
Compare and contrast the selected company
Price to earnings ratio: The price to earnings indication of TESCO PLC ORD is around 3.35
times, according to the most recent financial statement. This is 84.02 percent less than the
Consumption Protective industry's average and 73.58 percent less than the Large Supermarkets
company's average. All United Kingdom companies have a price to earnings ratio of 88.34%
greater than the corporation.
EBIT: TESCO PLC ORD has a Profit Margin of 10.61 percent, according to the most recent
financial filing. This is 250.17 percent more than the Consumption Protective business and much
more than the Large Supermarkets business. The profitability for all UK stocks is significantly
smaller than the firm's.
Gross profit margin: TESCO PLC ORD achieved gross profit of 3.17 billion pounds, as per the
firm's filings. This is 68.38 percent less than the Consumers Defensive industry, and 50.72
percent less than the Grocery Stores industry. The firm's gross profit is 88.42 percent larger than
the operating income of all UK equities
Return on assets: TESCO PLC ORD has a Return On Asset of 2.66 percent, according to the
most recent financial statement. This is much greater than the Consumption Protective industry's
and 22.22 percent less than the Large Supermarkets industry's. The return on asset for all UK
stocks is significantly lower than the firm's.
Return on equity: TESCO PLC ORD has a Return On Equity of 5.61 percent, according to the
most recent financial statement. This is greater by 112.5 percent than the Consumer Protective
industry and lesser by 42.76 percent than the Large Supermarkets business. The company's
return on equity is much smaller than that of all UK equities.
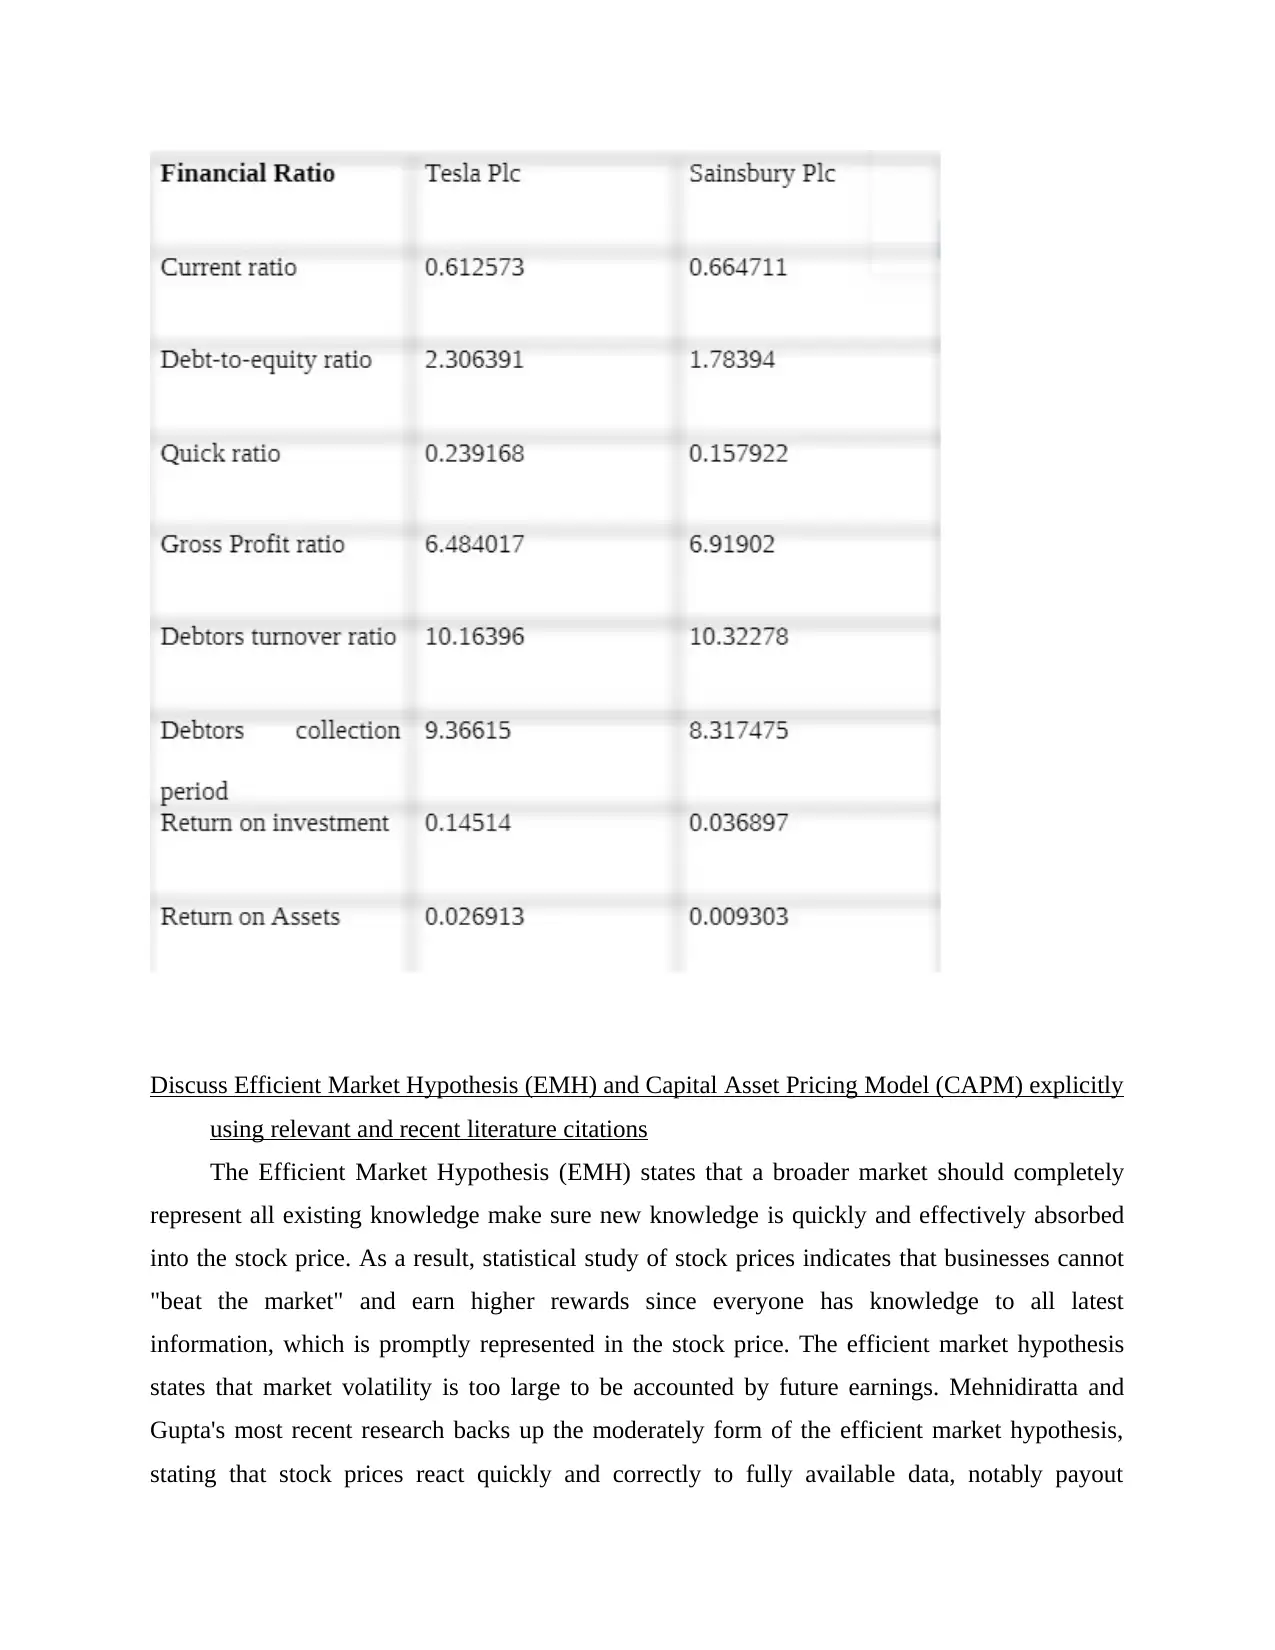
Liquidity ratio: Tesco Plc now has a current ratio of 0.612573. This metric is used to assess a
company's capacity to meet its short-term commitments. Since the result is more than 0.5, it is
apparent that the corporation has the potential to satisfy its short-term obligations within a year
depending on this figure of ratio from computation. The situation is similar with Sainsbury Plc,
which has a current ratio of 0.664711.
firm's filings. This is 68.38 percent less than the Consumers Defensive industry, and 50.72
percent less than the Grocery Stores industry. The firm's gross profit is 88.42 percent larger than
the operating income of all UK equities
Return on assets: TESCO PLC ORD has a Return On Asset of 2.66 percent, according to the
most recent financial statement. This is much greater than the Consumption Protective industry's
and 22.22 percent less than the Large Supermarkets industry's. The return on asset for all UK
stocks is significantly lower than the firm's.
Return on equity: TESCO PLC ORD has a Return On Equity of 5.61 percent, according to the
most recent financial statement. This is greater by 112.5 percent than the Consumer Protective
industry and lesser by 42.76 percent than the Large Supermarkets business. The company's
return on equity is much smaller than that of all UK equities.
Liquidity ratio: Tesco Plc now has a current ratio of 0.612573. This metric is used to assess a
company's capacity to meet its short-term commitments. Since the result is more than 0.5, it is
apparent that the corporation has the potential to satisfy its short-term obligations within a year
depending on this figure of ratio from computation. The situation is similar with Sainsbury Plc,
which has a current ratio of 0.664711.
Discuss Efficient Market Hypothesis (EMH) and Capital Asset Pricing Model (CAPM) explicitly
using relevant and recent literature citations
The Efficient Market Hypothesis (EMH) states that a broader market should completely
represent all existing knowledge make sure new knowledge is quickly and effectively absorbed
into the stock price. As a result, statistical study of stock prices indicates that businesses cannot
"beat the market" and earn higher rewards since everyone has knowledge to all latest
information, which is promptly represented in the stock price. The efficient market hypothesis
states that market volatility is too large to be accounted by future earnings. Mehnidiratta and
Gupta's most recent research backs up the moderately form of the efficient market hypothesis,
stating that stock prices react quickly and correctly to fully available data, notably payout
Secure Best Marks with AI Grader
Need help grading? Try our AI Grader for instant feedback on your assignments.
declarations. The two-stage research examines how stock prices react to dividend
announcements.
The Capital Asset Pricing Model (or CAPM) links a product risk of equity RE to its stock
beta as well as two macroeconomic determinants, the risk-free interest and the equity risk
premium: subscription fee). The yield on 3-month UK Treasury securities can be used to
estimate the risk-free rate. The Economic Times published this data. Imagine an annual growth
rate of 6%. [The T-bill rate reported in the Financial Times on April 24, 2008 was 5.85 percent.]
The risk premium is a measurement of how far the equity industry's lengthy return is predicted to
outperform the risk-free asset. Imagine a yearly growth rate of 4%.
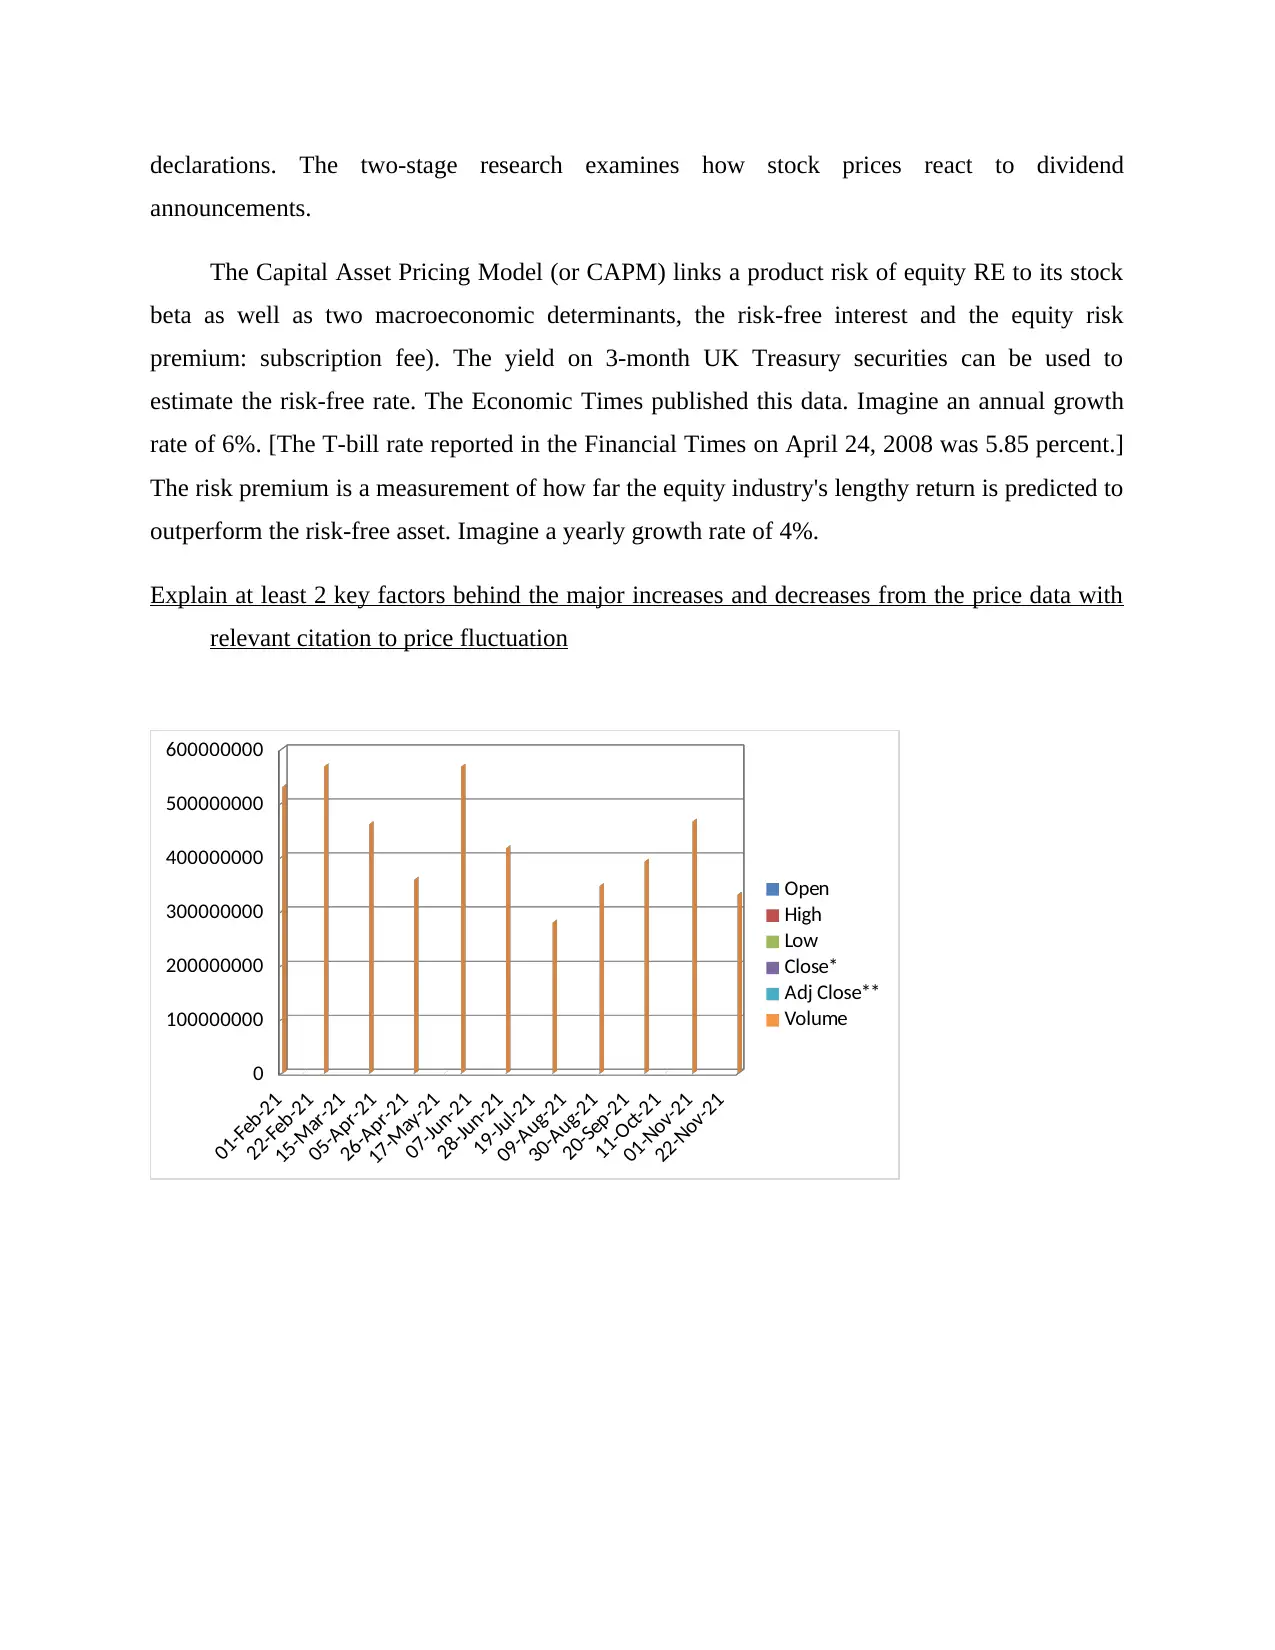
Explain at least 2 key factors behind the major increases and decreases from the price data with
relevant citation to price fluctuation
01-Feb-21
22-Feb-21
15-Mar-21
05-Apr-21
26-Apr-21
17-May-21
07-Jun-21
28-Jun-21
19-Jul-21
09-Aug-21
30-Aug-21
20-Sep-21
11-Oct-21
01-Nov-21
22-Nov-21
0
100000000
200000000
300000000
400000000
500000000
600000000
Open
High
Low
Close*
Adj Close**
Volume
announcements.
The Capital Asset Pricing Model (or CAPM) links a product risk of equity RE to its stock
beta as well as two macroeconomic determinants, the risk-free interest and the equity risk
premium: subscription fee). The yield on 3-month UK Treasury securities can be used to
estimate the risk-free rate. The Economic Times published this data. Imagine an annual growth
rate of 6%. [The T-bill rate reported in the Financial Times on April 24, 2008 was 5.85 percent.]
The risk premium is a measurement of how far the equity industry's lengthy return is predicted to
outperform the risk-free asset. Imagine a yearly growth rate of 4%.
Explain at least 2 key factors behind the major increases and decreases from the price data with
relevant citation to price fluctuation
01-Feb-21
22-Feb-21
15-Mar-21
05-Apr-21
26-Apr-21
17-May-21
07-Jun-21
28-Jun-21
19-Jul-21
09-Aug-21
30-Aug-21
20-Sep-21
11-Oct-21
01-Nov-21
22-Nov-21
0
100000000
200000000
300000000
400000000
500000000
600000000
Open
High
Low
Close*
Adj Close**
Volume
01-Jan-20
25-Jan-20
18-Feb-20
13-Mar-20
06-Apr-20
30-Apr-20
24-May-20
17-Jun-20
11-Jul-20
04-Aug-20
28-Aug-20
21-Sep-20
15-Oct-20
08-Nov-20
0
100000000
200000000
300000000
400000000
500000000
600000000
700000000
800000000
900000000
Open
High
Low
Close*
Adj Close**
Volume
01-Jan-19
24-Jan-19
16-Feb-19
11-Mar-19
03-Apr-19
26-Apr-19
19-May-19
11-Jun-19
04-Jul-19
27-Jul-19
19-Aug-19
11-Sep-19
04-Oct-19
27-Oct-19
19-Nov-19
0
100000000
200000000
300000000
400000000
500000000
600000000
Open
High
Low
Close*
Adj Close**
Volume
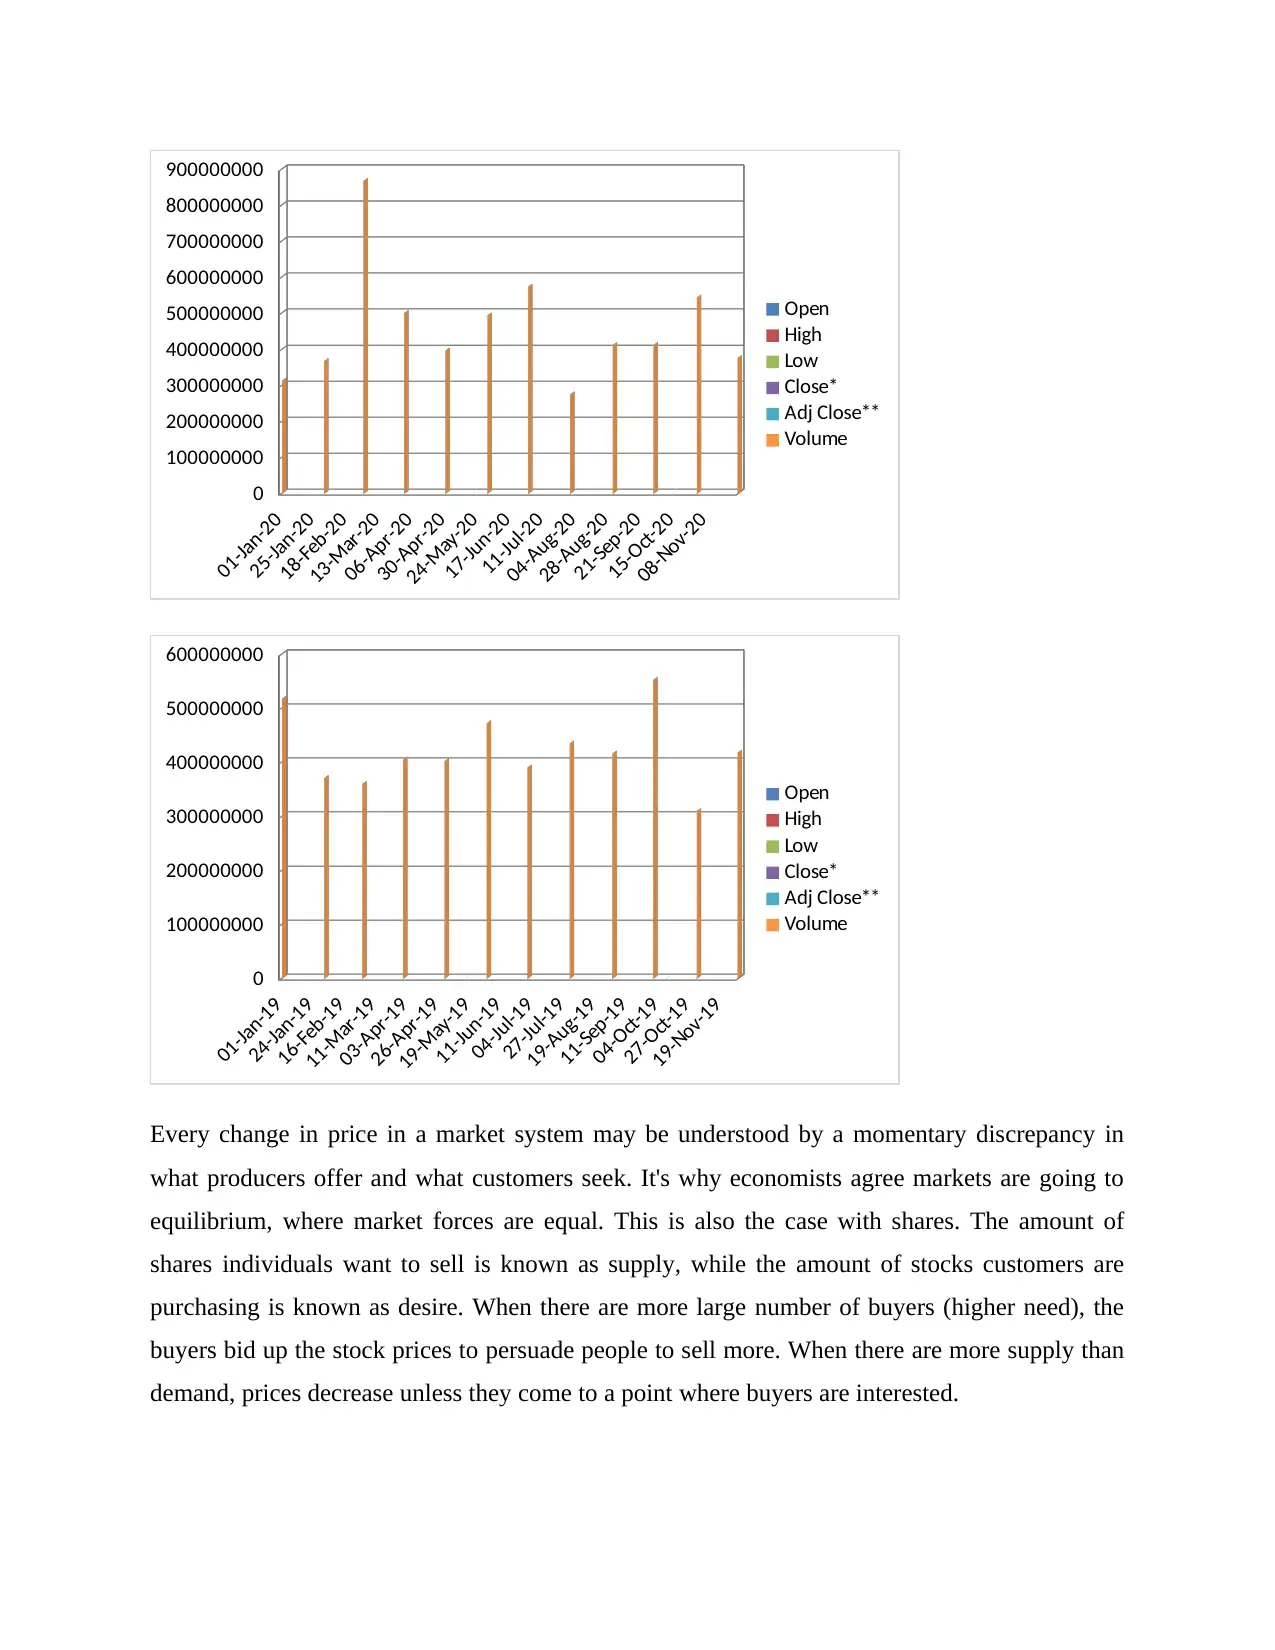
Every change in price in a market system may be understood by a momentary discrepancy in
what producers offer and what customers seek. It's why economists agree markets are going to
equilibrium, where market forces are equal. This is also the case with shares. The amount of
shares individuals want to sell is known as supply, while the amount of stocks customers are
purchasing is known as desire. When there are more large number of buyers (higher need), the
buyers bid up the stock prices to persuade people to sell more. When there are more supply than
demand, prices decrease unless they come to a point where buyers are interested.
25-Jan-20
18-Feb-20
13-Mar-20
06-Apr-20
30-Apr-20
24-May-20
17-Jun-20
11-Jul-20
04-Aug-20
28-Aug-20
21-Sep-20
15-Oct-20
08-Nov-20
0
100000000
200000000
300000000
400000000
500000000
600000000
700000000
800000000
900000000
Open
High
Low
Close*
Adj Close**
Volume
01-Jan-19
24-Jan-19
16-Feb-19
11-Mar-19
03-Apr-19
26-Apr-19
19-May-19
11-Jun-19
04-Jul-19
27-Jul-19
19-Aug-19
11-Sep-19
04-Oct-19
27-Oct-19
19-Nov-19
0
100000000
200000000
300000000
400000000
500000000
600000000
Open
High
Low
Close*
Adj Close**
Volume
Every change in price in a market system may be understood by a momentary discrepancy in
what producers offer and what customers seek. It's why economists agree markets are going to
equilibrium, where market forces are equal. This is also the case with shares. The amount of
shares individuals want to sell is known as supply, while the amount of stocks customers are
purchasing is known as desire. When there are more large number of buyers (higher need), the
buyers bid up the stock prices to persuade people to sell more. When there are more supply than
demand, prices decrease unless they come to a point where buyers are interested.
Differentiates in interest rate: Interest rates, poverty, and the value of a currency are all
intertwined. Interest rates are used by financial organizations to influence both the currency
exchange and inflation rates, and changing interest rates impacts both rising inflationary values.
Increasing interest rates offer lenders in a certain nation with a favorable price especially
compared to other nations. As a consequence of the large bond yields money, the currency rate
has risen. However, the impact of higher interest rates is minimized when pricing in one country
are significantly higher than in others, but other factors contribute to the country's currency
devaluation. Borrowing rates have an inverse relationship with exchange rates, i.e., borrowing
costs help to reduce currency volatility.
Critically analyse the behaviour of selected companies using the following descriptive statistics
variables
Included in Excel
Paraphrase This Document
Need a fresh take? Get an instant paraphrase of this document with our AI Paraphraser
REFERENCES
Books and Journal
Gull, S., Parah, S. A. and Muhammad, K., 2020. Reversible data hiding exploiting Huffman
encoding with dual images for IoMT based healthcare. Computer Communications. 163.
pp.134-149.
Salas, R. N. and et.al., 2020. A pathway to net zero emissions for healthcare. Bmj, 371.
Hassan, T. A. and et.al., 2020. The global impact of Brexit uncertainty (No. w26609). National
Bureau of Economic Research.
Navas, L. P. and et.al., 2020. Colombian higher education institutions evaluation. Socio-
Economic Planning Sciences. 71. p.100801.
Raghupathi, V. and Raghupathi, W., 2020. Healthcare expenditure and economic performance:
insights from the United States Data. Frontiers in Public Health. 8. p.156.
Smaldone, F., Ippolito, A. and Ruberto, M., 2020. The shadows know me: Exploring the dark
side of social media in the healthcare field. European Management Journal. 38(1). pp.19-
32.
Parekh, P. and et.al., 2020. Systematic review and meta-analysis of augmented reality in
medicine, retail, and games. Visual computing for industry, biomedicine, and art. 3(1).
pp.1-20.
1 out of 14
Related Documents


Your All-in-One AI-Powered Toolkit for Academic Success.
+13062052269
info@desklib.com
Available 24*7 on WhatsApp / Email
![[object Object]](/_next/static/media/star-bottom.7253800d.svg)
Unlock your academic potential
© 2024 | Zucol Services PVT LTD | All rights reserved.