Auditing Printers by Choice Ltd: Financial Statement Analysis Report
VerifiedAdded on 2023/06/06
|9
|1946
|307
Report
AI Summary
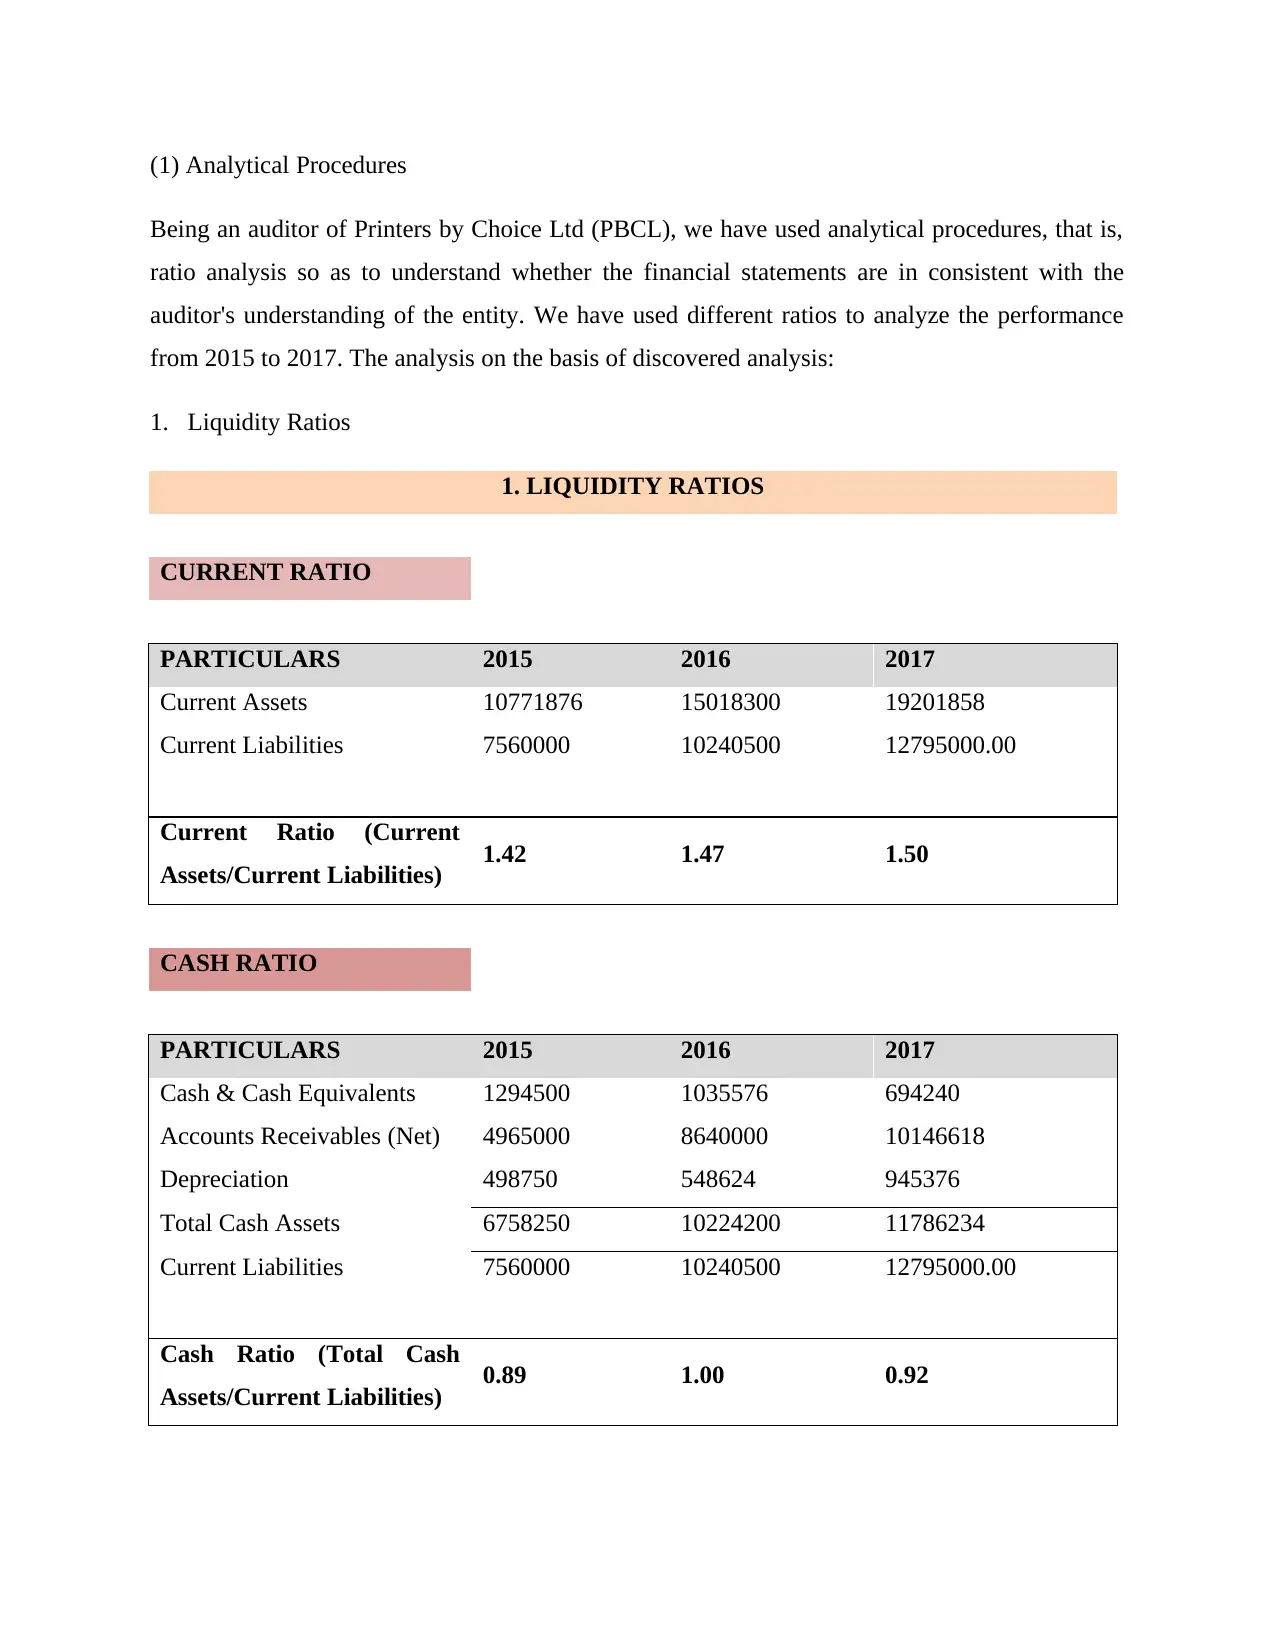
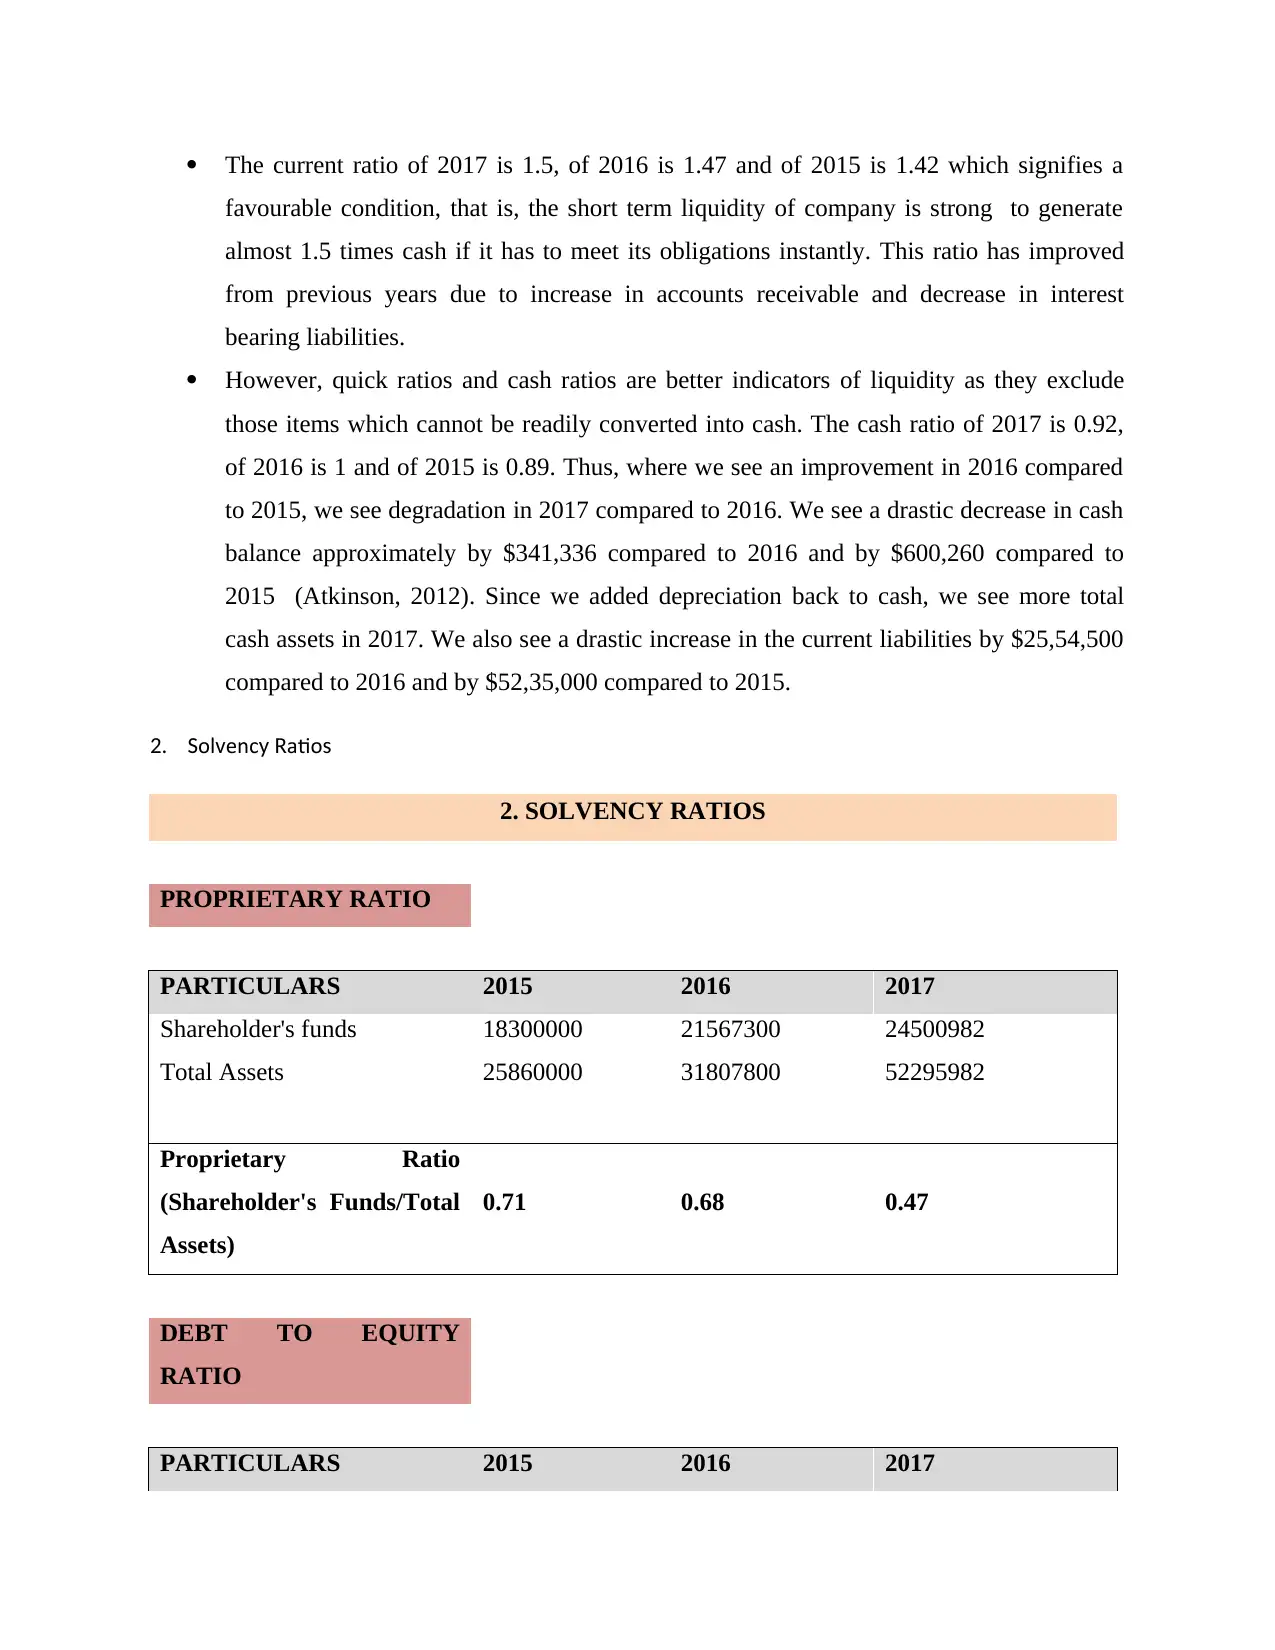
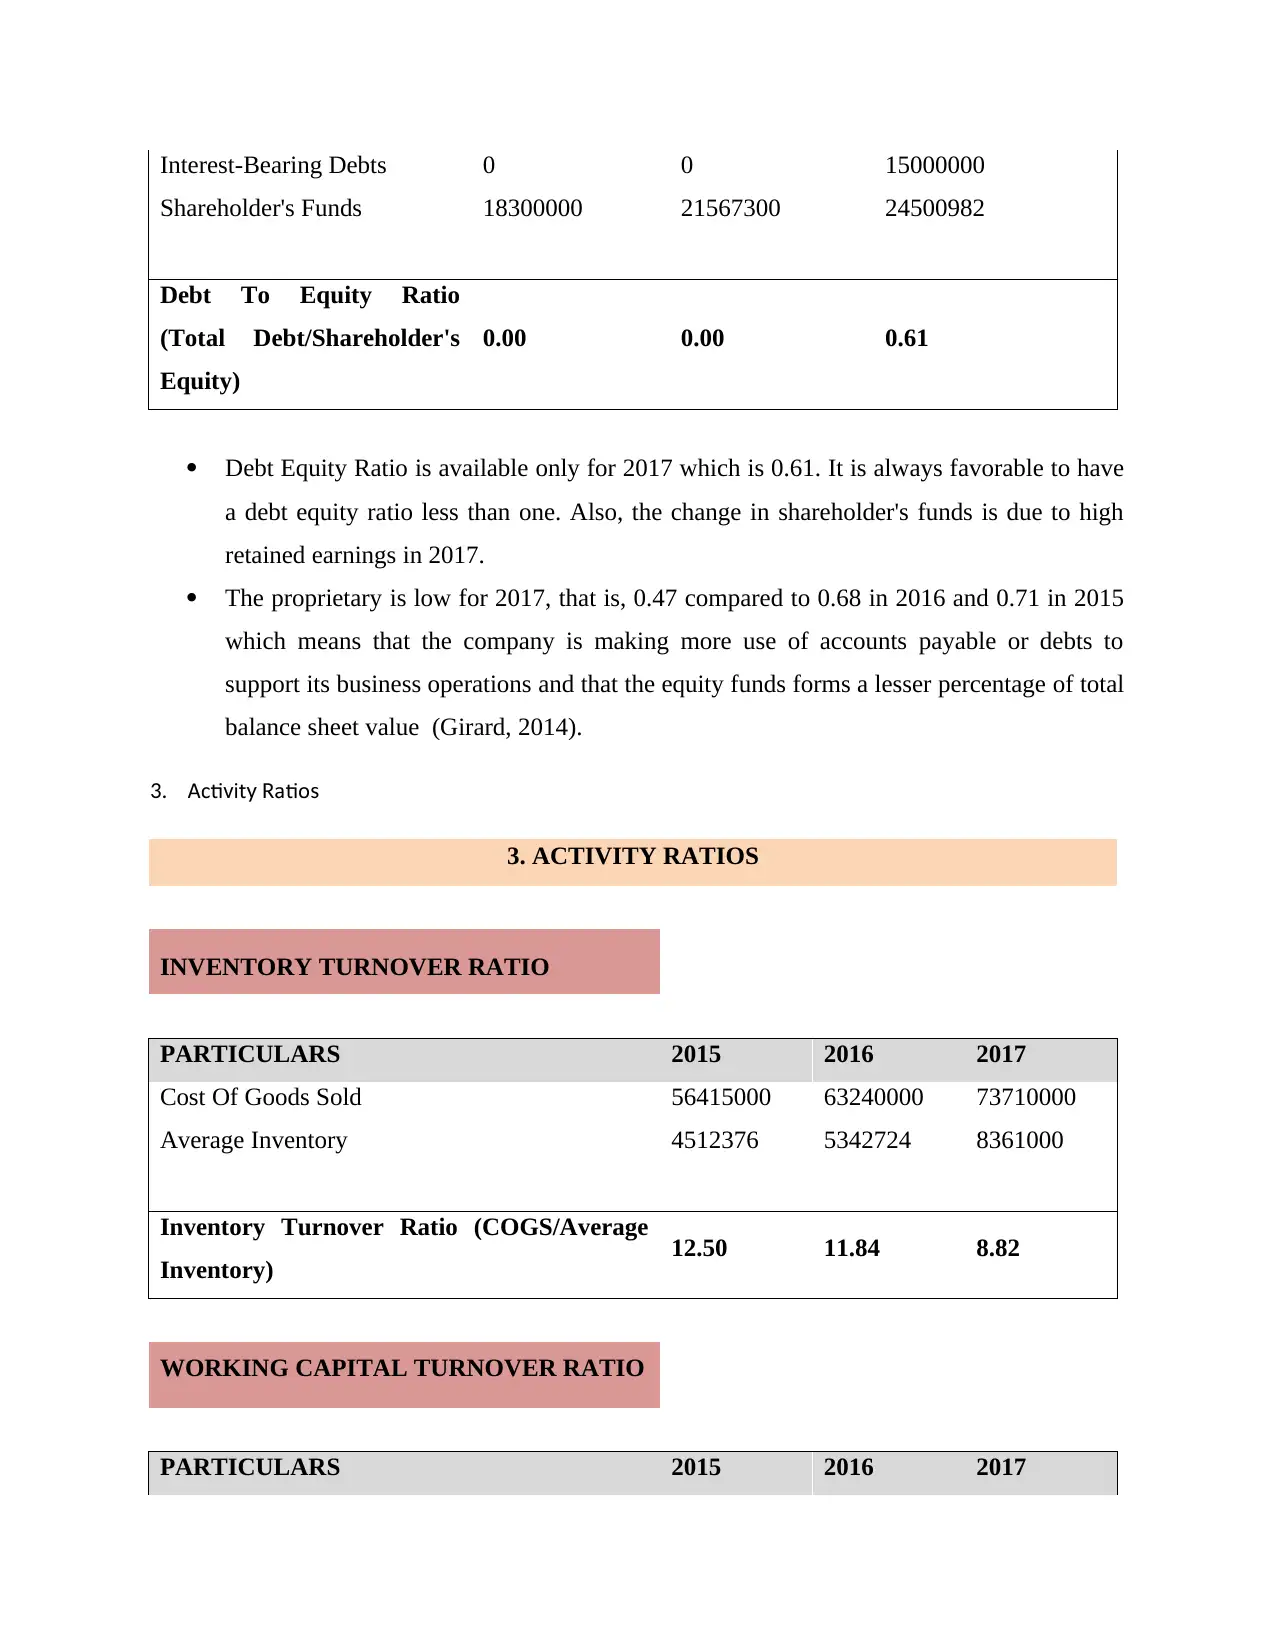
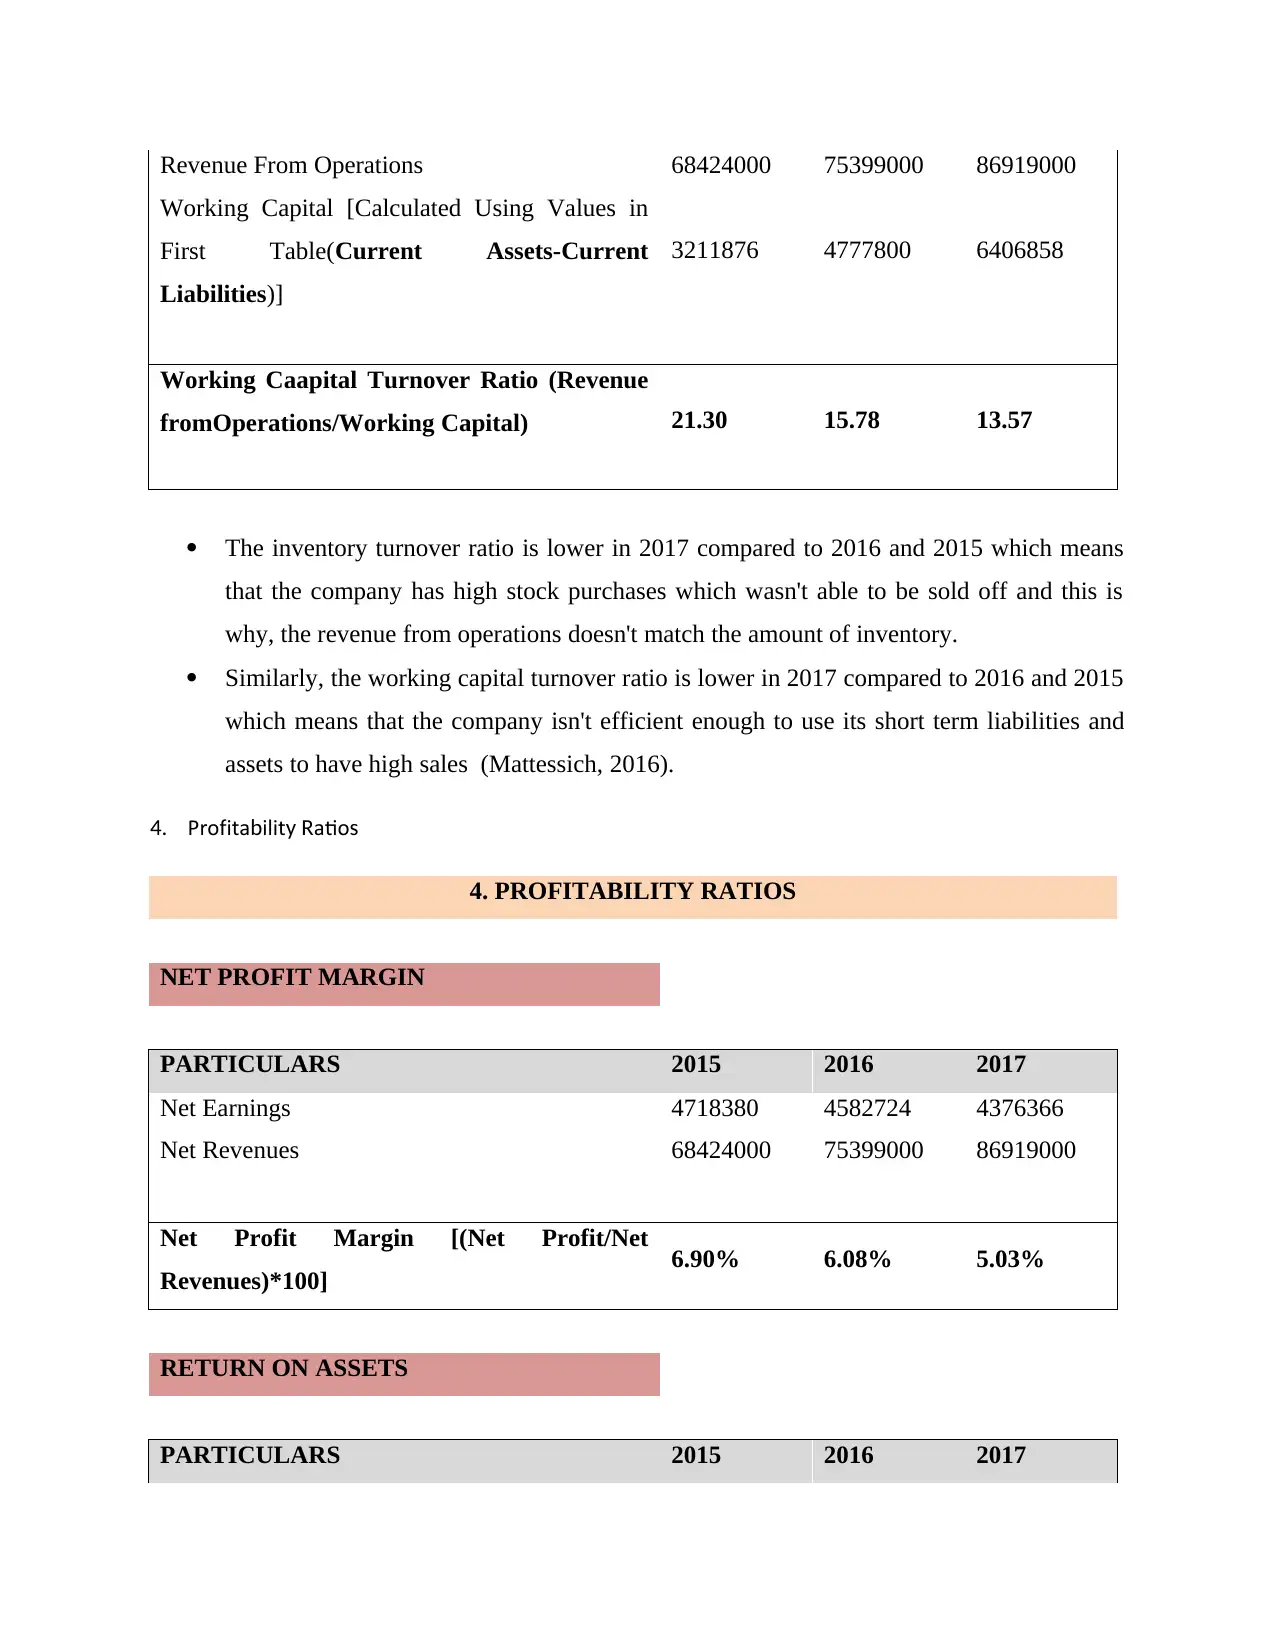
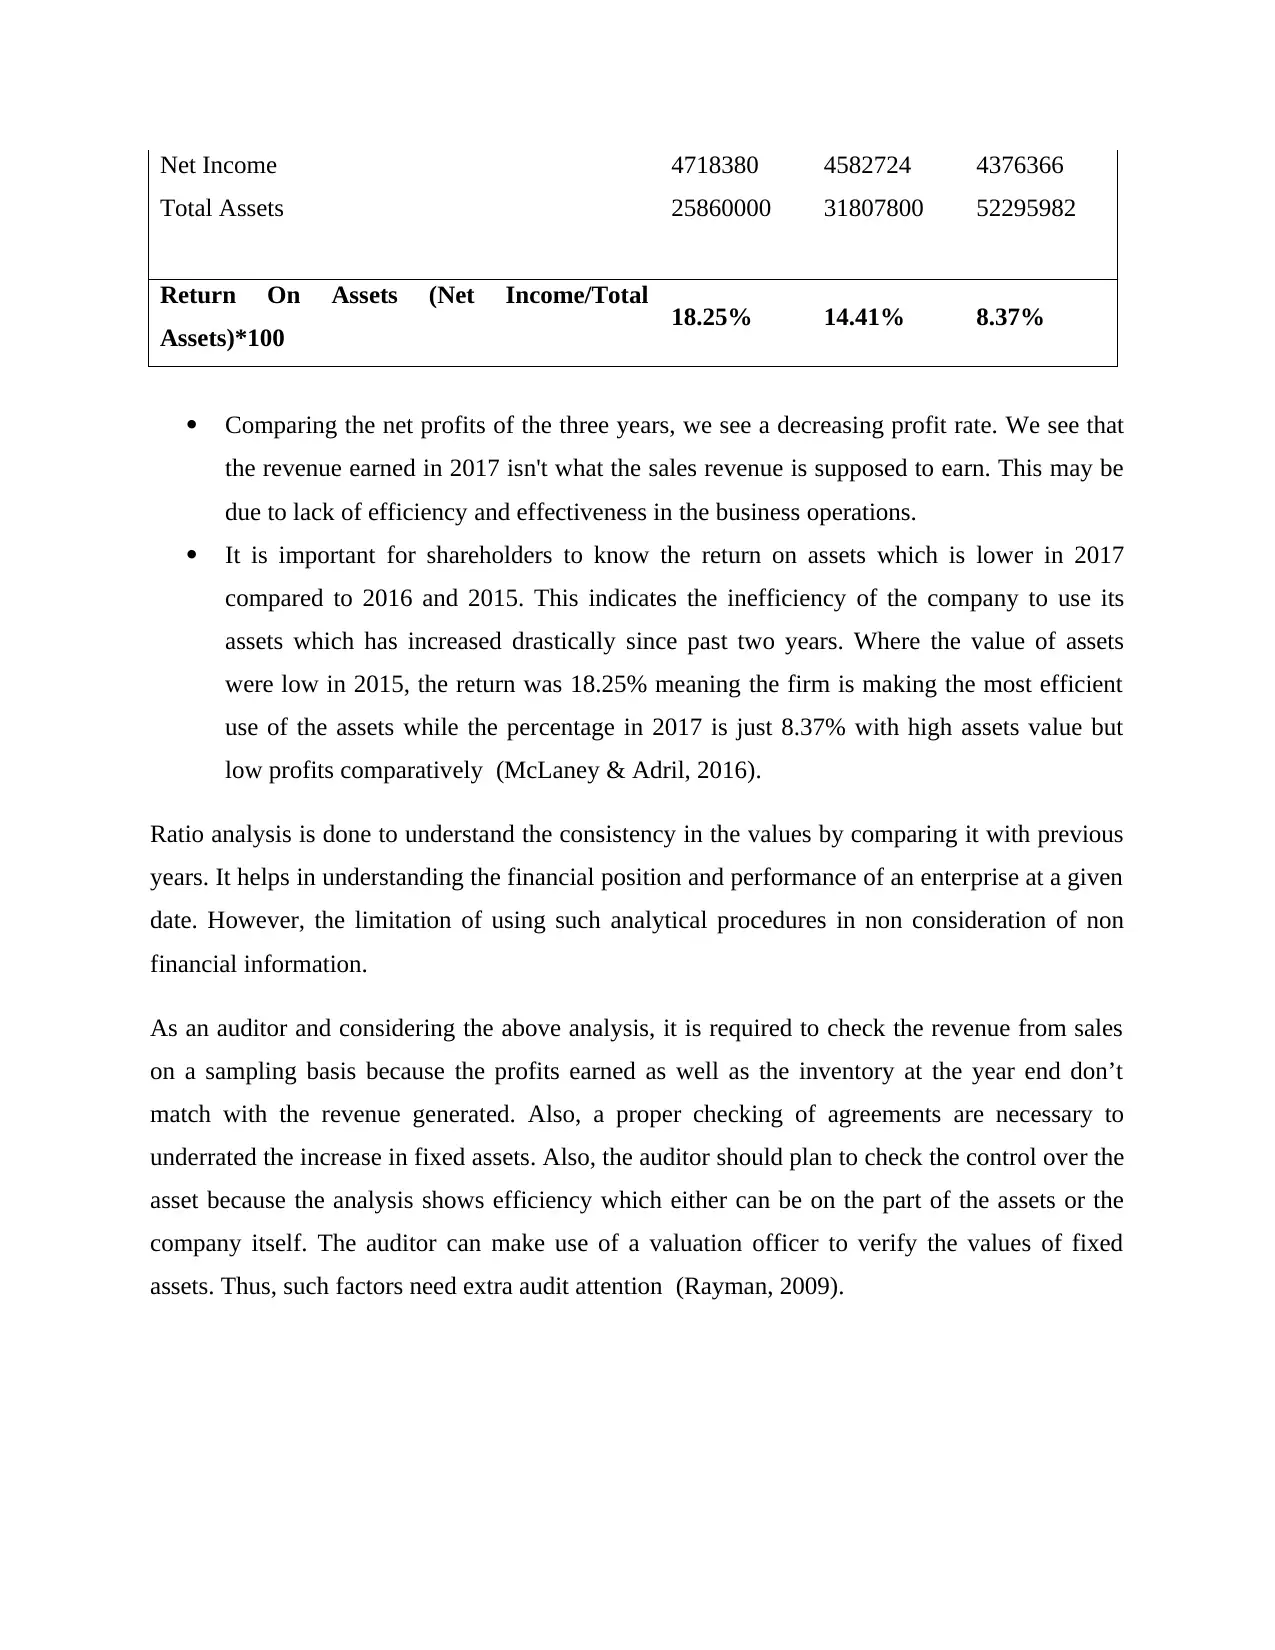
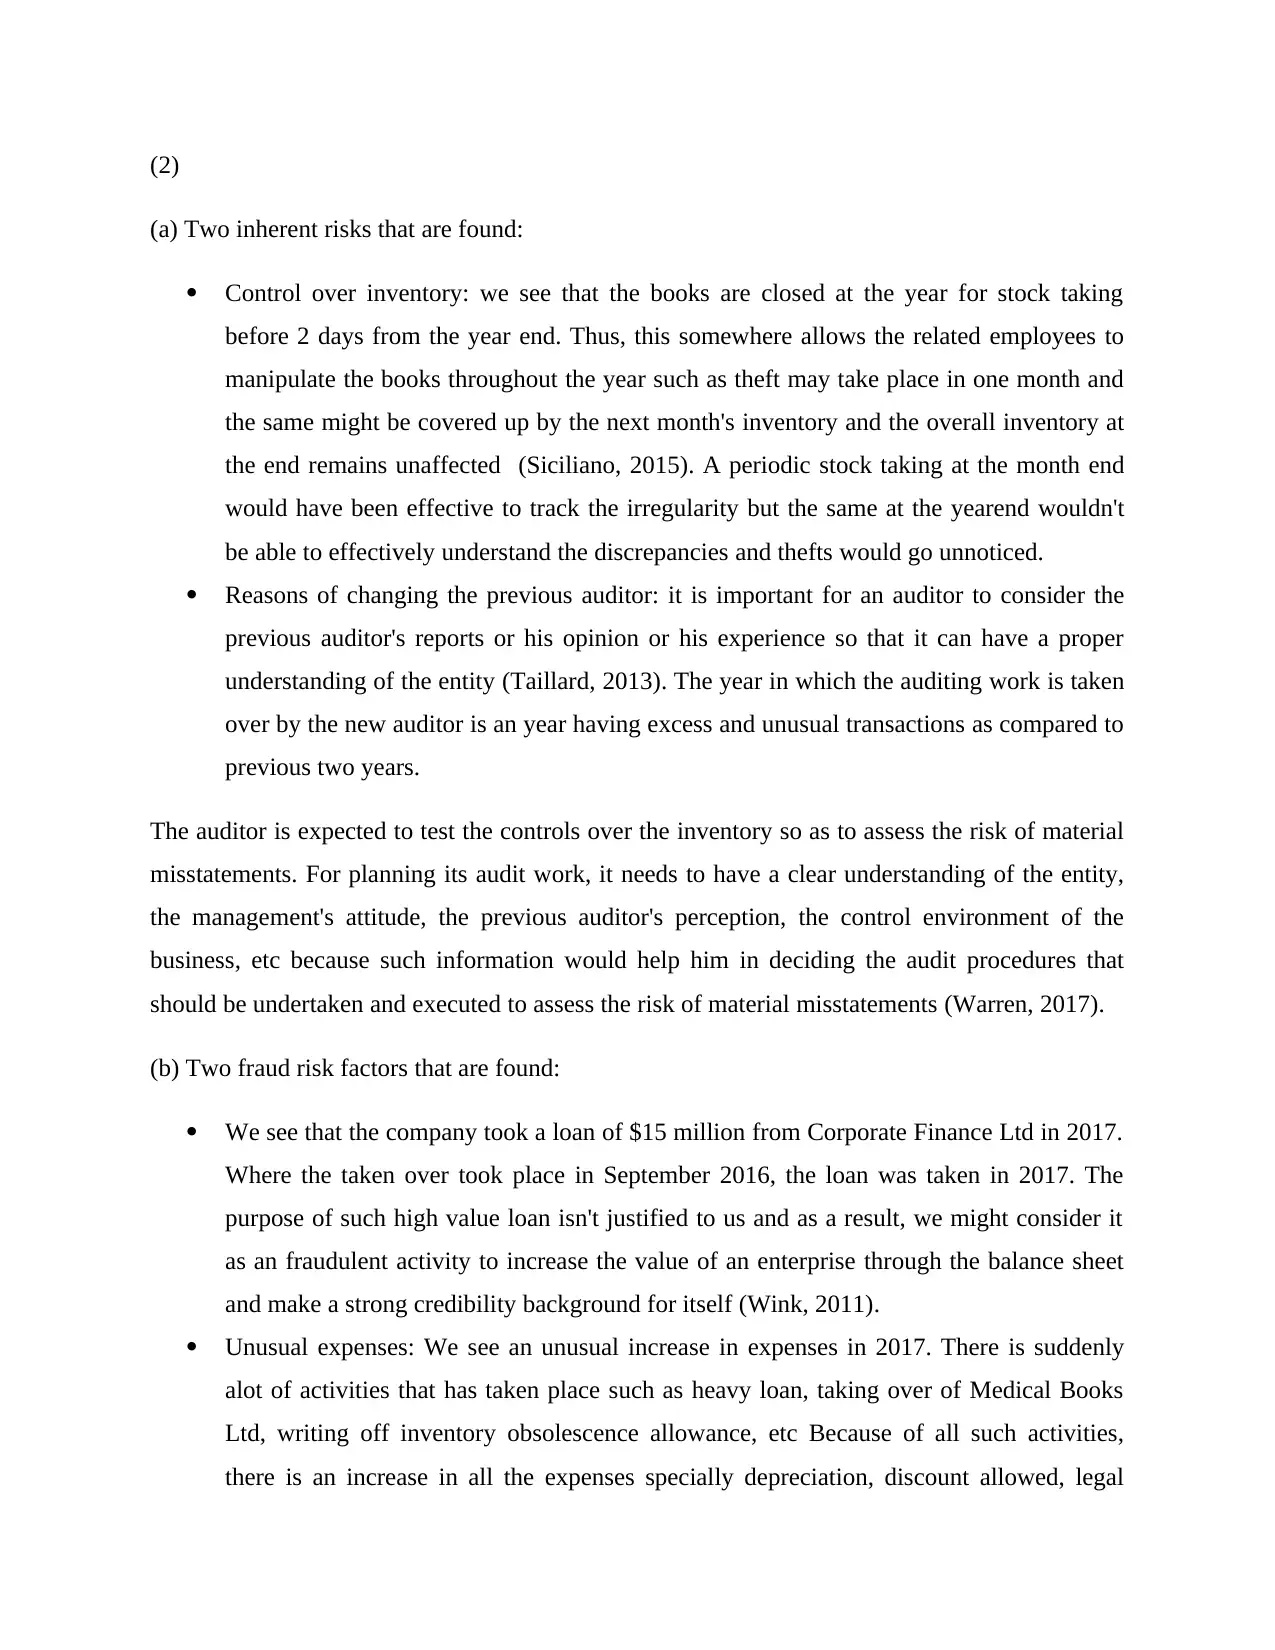
This report presents an audit analysis of Printers by Choice Ltd (PBCL), evaluating its financial performance from 2015 to 2017 using various ratio analyses, including liquidity, solvency, activity, and profitability ratios. The analysis reveals trends in PBCL's financial health, such as improvements in liquidity ratios but declining profitability. The report identifies inherent risks, including control over inventory and the implications of changing auditors, and fraud risk factors, such as a significant loan taken in 2017 and unusual expense patterns. The auditor recommends further investigation into revenue, inventory, and fixed assets, along with a review of the loan agreement and the rationale behind unusual expenses. The analysis is supported by a comprehensive bibliography of relevant accounting and finance literature. The report emphasizes the importance of understanding the entity, management's attitude, and the control environment to assess material misstatements and plan effective audit procedures. The findings highlight potential areas for further audit attention and scrutiny to ensure the accuracy and reliability of the financial statements.
1 out of 9
Related Documents


Your All-in-One AI-Powered Toolkit for Academic Success.
+13062052269
info@desklib.com
Available 24*7 on WhatsApp / Email
![[object Object]](/_next/static/media/star-bottom.7253800d.svg)
Copyright © 2020–2026 A2Z Services. All Rights Reserved. Developed and managed by ZUCOL.