Frequency Distributions and Graphs PDF
14 Pages2848 Words425 Views
Added on 2021-01-02
Frequency Distributions and Graphs PDF
Added on 2021-01-02
ShareRelated Documents
STATISTICS

TABLE OF CONTENTSINTRODUCTION...........................................................................................................................1QUESTION 1...................................................................................................................................1A. Analysing the data set as per distributions........................................................................1B. Histogram of Percent Frequency distribution....................................................................2QUESTION 2...................................................................................................................................2A. Determining the sample size..............................................................................................2B. Identifying the relevance between demand and unit price................................................3C. Computing the coefficient of determination with interpretation.......................................3D. Analysing the relationship between supply and unit price as per computing coefficient ofcorrelation...............................................................................................................................3E. Predicting the supply in units.............................................................................................4QUESTION 3...................................................................................................................................4A. Constructing ANOVA Table.............................................................................................4B. Advising statistical consultant...........................................................................................5QUESTION 4...................................................................................................................................6A. Estimated regression equation...........................................................................................6B. determination of significant model Significance level 10%..............................................7C. Ascertaining the competitor’s price and advertising individually relevant with sales......8D. Re-estimating data set by insignificant independent variable...........................................9E. Interpretation of slope co-efficiency of model.................................................................10CONCLUSION..............................................................................................................................11REFERENCES..............................................................................................................................12
INTRODUCTIONStatistical analysis plays main role in analysing the large data base and bringing accurateoutcomes. Implication of various tools and techniques in identifying the actual result will bebeneficial in proper decision making. In the present report, there will be analysis and discussionbased on various methods which is presented accurate results of the variables. There will be useof simple statistical measurement and make proper operational analysis with the help of MSexcel and SPSS tools. There will be analysis of correlation coefficient, regression as well asvariations methods which are involved in analysing the outcomes.QUESTION 1A. Analysing the data set as per distributionsAnalysing the marks scored by a class in a respective period which can be throughdetermining frequencies of data base (Pope and Stanistreet, 2017). With respect to analysingvariable in the set criteria there were analysis made as listed in the below table: ClassFCFRelativefrequencyCumulative relativefrequencyPercentagefrequency50-60330.150.0615%60-70250.10.1010%70-805100.250.1925%80-904140.20.2720%90-1006200.30.3830%Total205211.00100%Interpretation: On the basis of above report, the marks of 20 students were categorised ina group of 10 classes. Thus, in class 50-60 there were 3 students, in 60-70 there were 2, in 70-80there were 5, in 80-90 there were 4 and in 90-100 there were 6. The Differentiation is based onfrequency of marks scored by these students on which further analysis were made. Cumulativefrequency had been generated on which previous frequency data were added in this. Therefore,the last category brings total of all variables. Relative frequency had been analysed which is based on concept of identifying the time ofrepeating a number. Therefore, in a frequency of variable there have been chances of repeating aparticular number most often. It can identify by dividing the frequency variable with totalnumber of frequency. It ensures that, total of this table needed to be 1. Similarly, in analysing the1
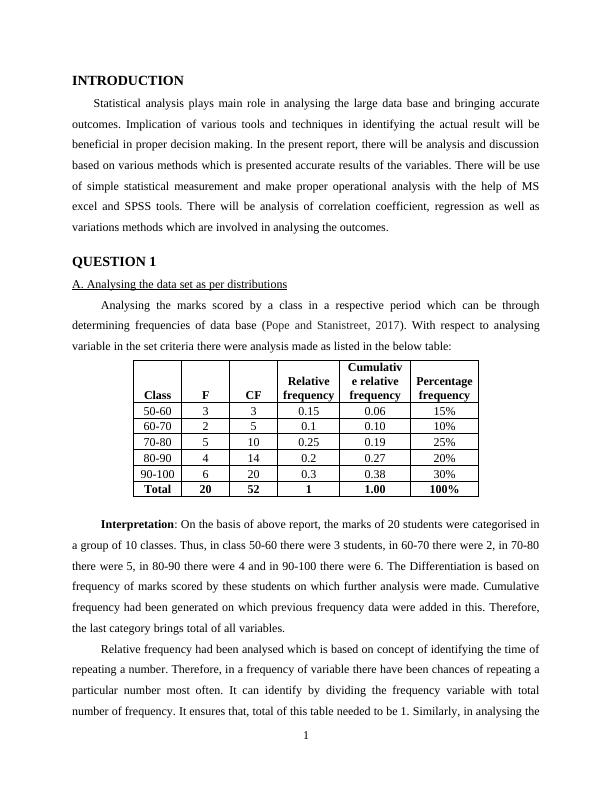
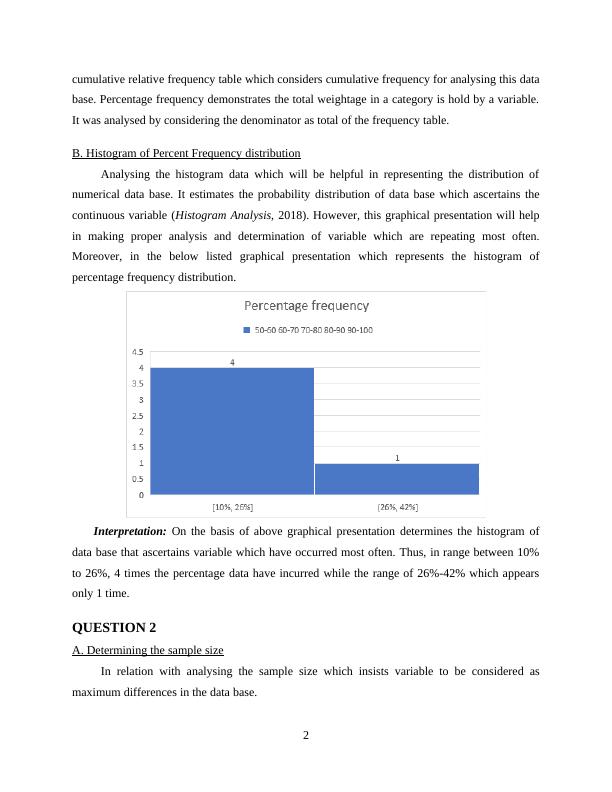
cumulative relative frequency table which considers cumulative frequency for analysing this database. Percentage frequency demonstrates the total weightage in a category is hold by a variable.It was analysed by considering the denominator as total of the frequency table.B. Histogram of Percent Frequency distributionAnalysing the histogram data which will be helpful in representing the distribution ofnumerical data base. It estimates the probability distribution of data base which ascertains thecontinuous variable (Histogram Analysis, 2018). However, this graphical presentation will helpin making proper analysis and determination of variable which are repeating most often.Moreover, in the below listed graphical presentation which represents the histogram ofpercentage frequency distribution.Interpretation: On the basis of above graphical presentation determines the histogram ofdata base that ascertains variable which have occurred most often. Thus, in range between 10%to 26%, 4 times the percentage data have incurred while the range of 26%-42% which appearsonly 1 time.QUESTION 2A. Determining the sample sizeIn relation with analysing the sample size which insists variable to be considered asmaximum differences in the data base.2
End of preview
Want to access all the pages? Upload your documents or become a member.
Related Documents
Business Statistics Assignment Solutionlg...
|10
|1896
|497
Statistics Assignment Solutions | Deskliblg...
|8
|1150
|326
Statistics for Business Decisions - Deskliblg...
|12
|1603
|290
Statistics for Business Decisionlg...
|17
|2515
|396
Statistics Assignment: Australian Exports Analysis, Analysis of Sales, Estimation and Testing Significance Levellg...
|11
|1439
|69
Assignment on Analysis on Accountinglg...
|11
|801
|26