Frequency Distribution, Regression Analysis, ANOVA and Interpretation of Results
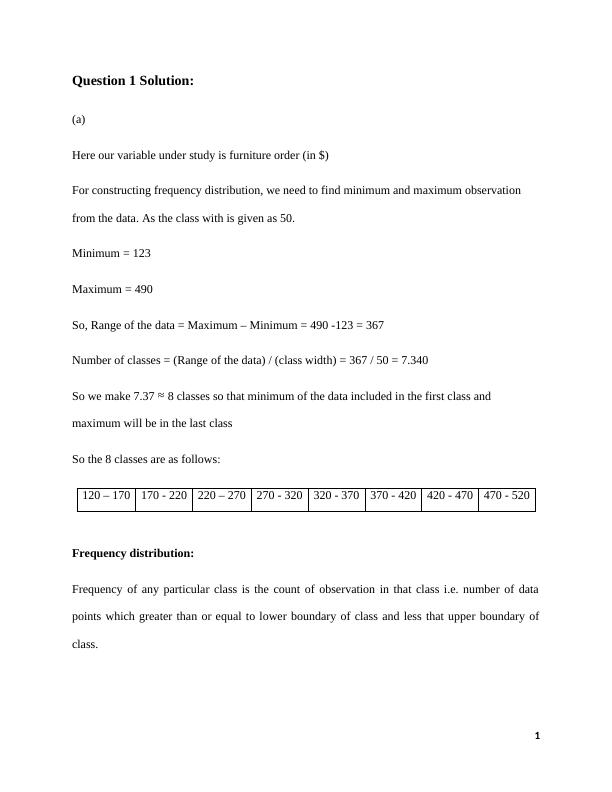
Prepare a frequency distribution, relative frequency distribution, and percent frequency
13 Pages2207 Words492 Views
Added on 2023-06-12
About This Document
This article explains the concepts of frequency distribution, regression analysis, ANOVA and interpretation of results with solved examples. It covers topics such as constructing frequency distribution, testing hypotheses using ANOVA, interpreting regression coefficients and more. The article also mentions Desklib as a platform for accessing study material, solved assignments, essays, dissertations and more.
Frequency Distribution, Regression Analysis, ANOVA and Interpretation of Results
Prepare a frequency distribution, relative frequency distribution, and percent frequency
Added on 2023-06-12
ShareRelated Documents
End of preview
Want to access all the pages? Upload your documents or become a member.
Assignment on Frequency Distribution
|7
|1102
|124
Deslib - Statistics Assignment Solution
|15
|2468
|269
Frequency Distribution, Hypothesis Testing, Regression Analysis
|2
|757
|346
Calculations and Graphing Representations Assignment PDF
|9
|656
|118
Statistics: Frequency Distribution, Regression Analysis, and Hypothesis Testing
|5
|835
|148
Understanding the Digital Revolution: Hat Bonanza
|6
|846
|62