Effect of Height on Weight
VerifiedAdded on 2023/06/03
|9
|1475
|153
AI Summary
This research study aimed to determine the effect of height on weight. A simple linear regression analysis was utilized to determine the relationship between height and weight. Results were presented using tables and figures.
Contribute Materials
Your contribution can guide someone’s learning journey. Share your
documents today.

Student ID: Module: FC005
Running head: EFFECT OF HEIGHT ON WEIGHT 1
Effect of Height on Weight
Name:
Institution:
Running head: EFFECT OF HEIGHT ON WEIGHT 1
Effect of Height on Weight
Name:
Institution:
Secure Best Marks with AI Grader
Need help grading? Try our AI Grader for instant feedback on your assignments.
Student ID: Module: FC005
EFFECT OF HEIGHT ON WEIGHT 2
Effect of Height on Weight
Introduction
The aim of this research study was be to determine the effect of height on weight. The research
question was: Does height have an effect on the weight of an individual? Previous studies have
indicated that height has a significant impact on weight. That is, the height of an individual is
very key in determining the weight of the person (Marshall, et al., 2017). Data from 213
respondents was used to check on the impact of height and weight. A simple linear regression
analysis was utilized to determine the relationship between height and weight. Regression is
important is important in checking the association between variables in a given study (Draper &
Smith, 2014). Additionally, descriptive statistics were computed in order to check on properties
of the data such as the mean, standard deviation and distribution of the given data. Descriptive
statistics help in providing the elementary characteristics of a dataset by giving simple
summaries (Ho & Yu, 2015). The results of the analysis were presented using tables and figures.
Results
This part of the research study presents tables and figures that give results of the data analysis.
The results are as given below:
Descriptive Statistics
N Minimum Maximum Mean Std. Deviation
Height 213 55.0 80.0 67.312 4.4750
Weight 213 95 280 145.86 32.514
Valid N (listwise) 213
The results above show descriptive statistics, which give summaries of the data used in this
research study.
Student ID: Module: FC005
EFFECT OF HEIGHT ON WEIGHT 3
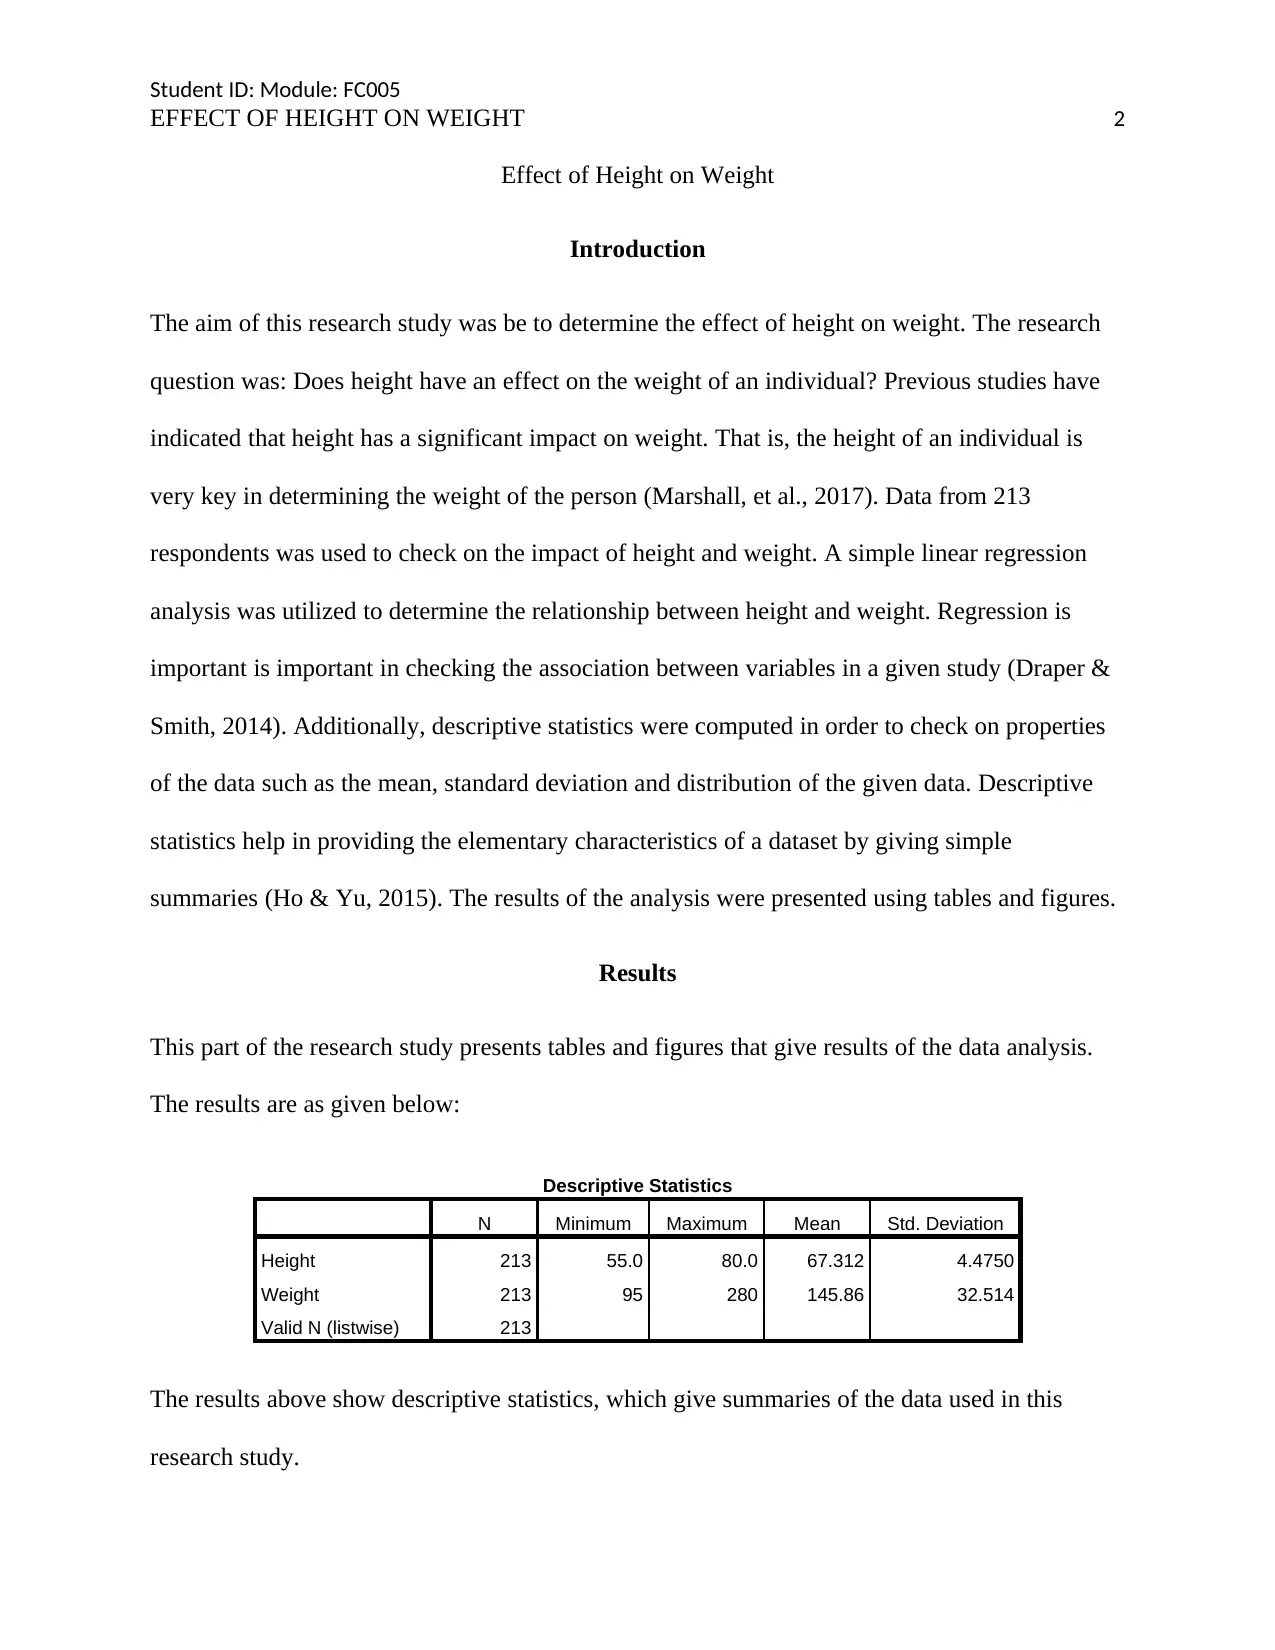
The figure above shows a histogram of height. The histogram is essential in giving a picture of
the distribution of height.
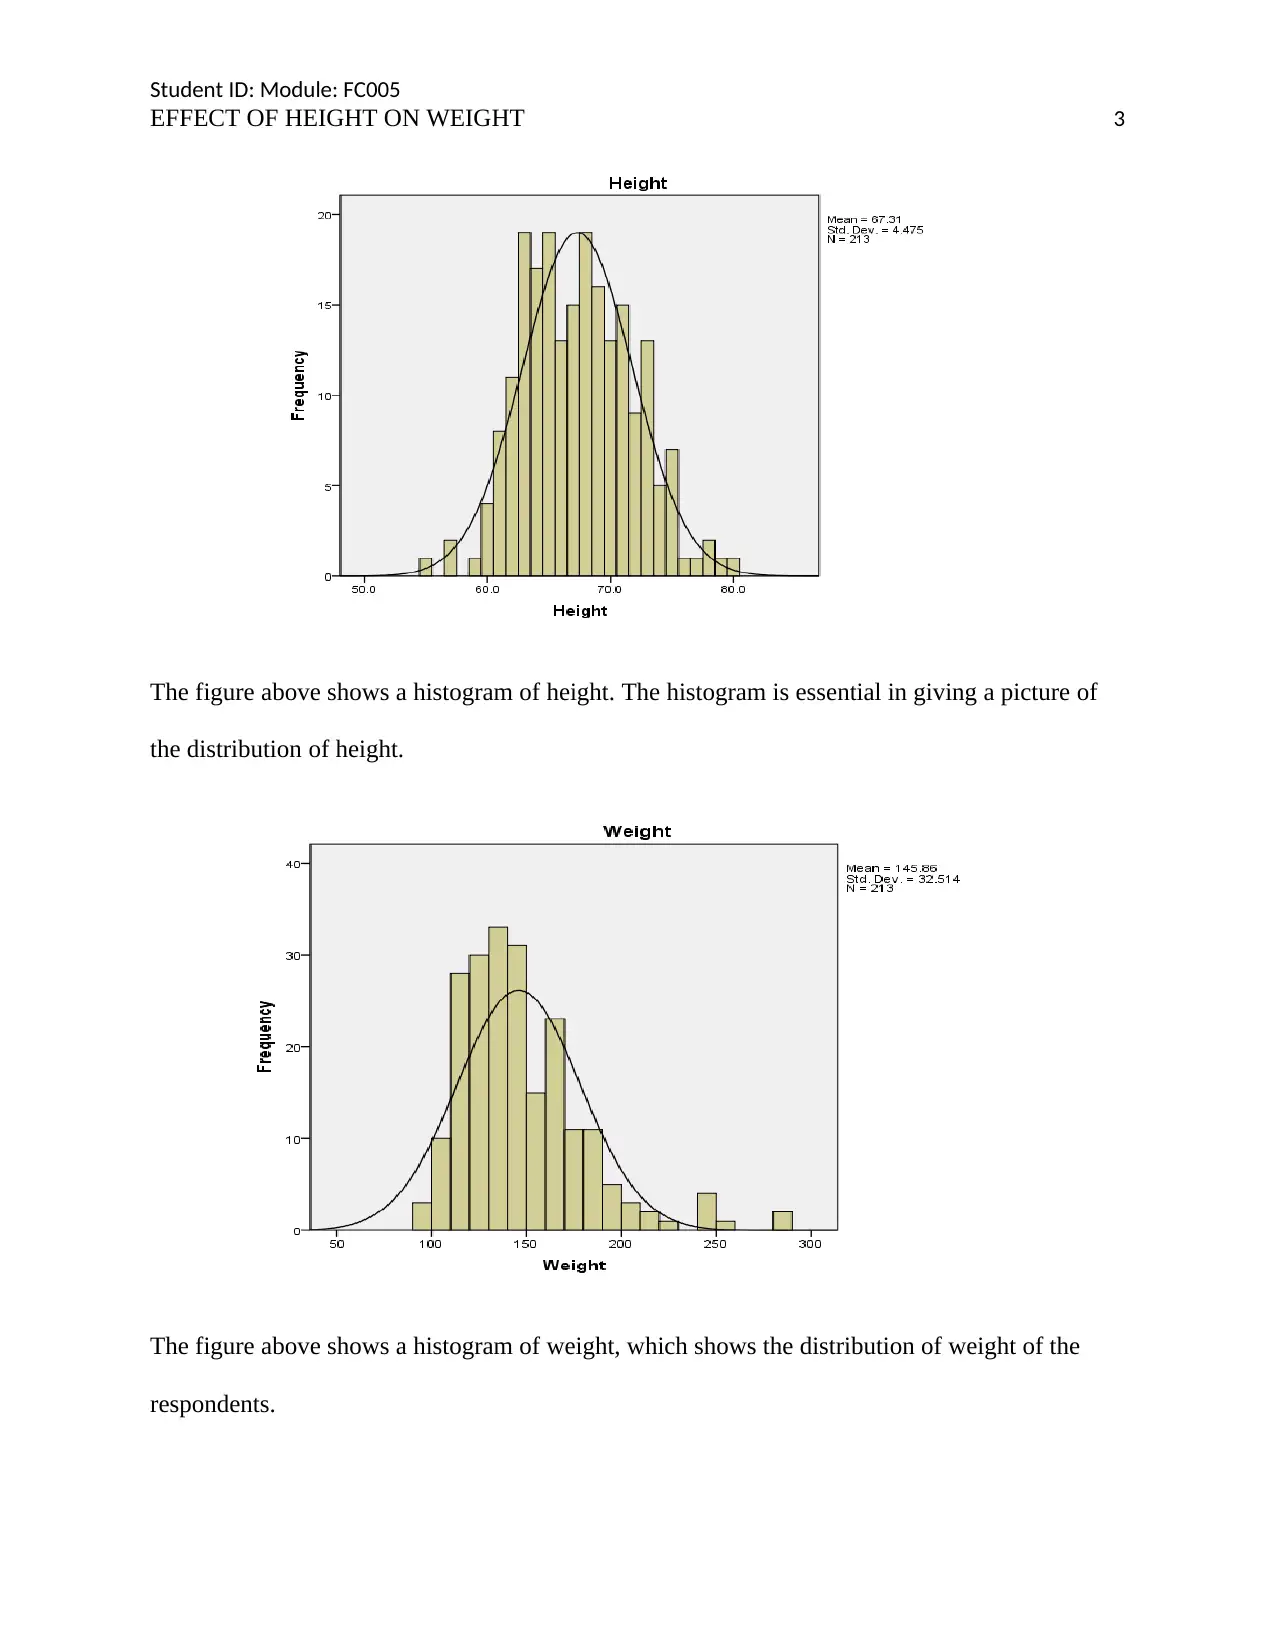
The figure above shows a histogram of weight, which shows the distribution of weight of the
respondents.
EFFECT OF HEIGHT ON WEIGHT 3
The figure above shows a histogram of height. The histogram is essential in giving a picture of
the distribution of height.
The figure above shows a histogram of weight, which shows the distribution of weight of the
respondents.
Student ID: Module: FC005
EFFECT OF HEIGHT ON WEIGHT 4
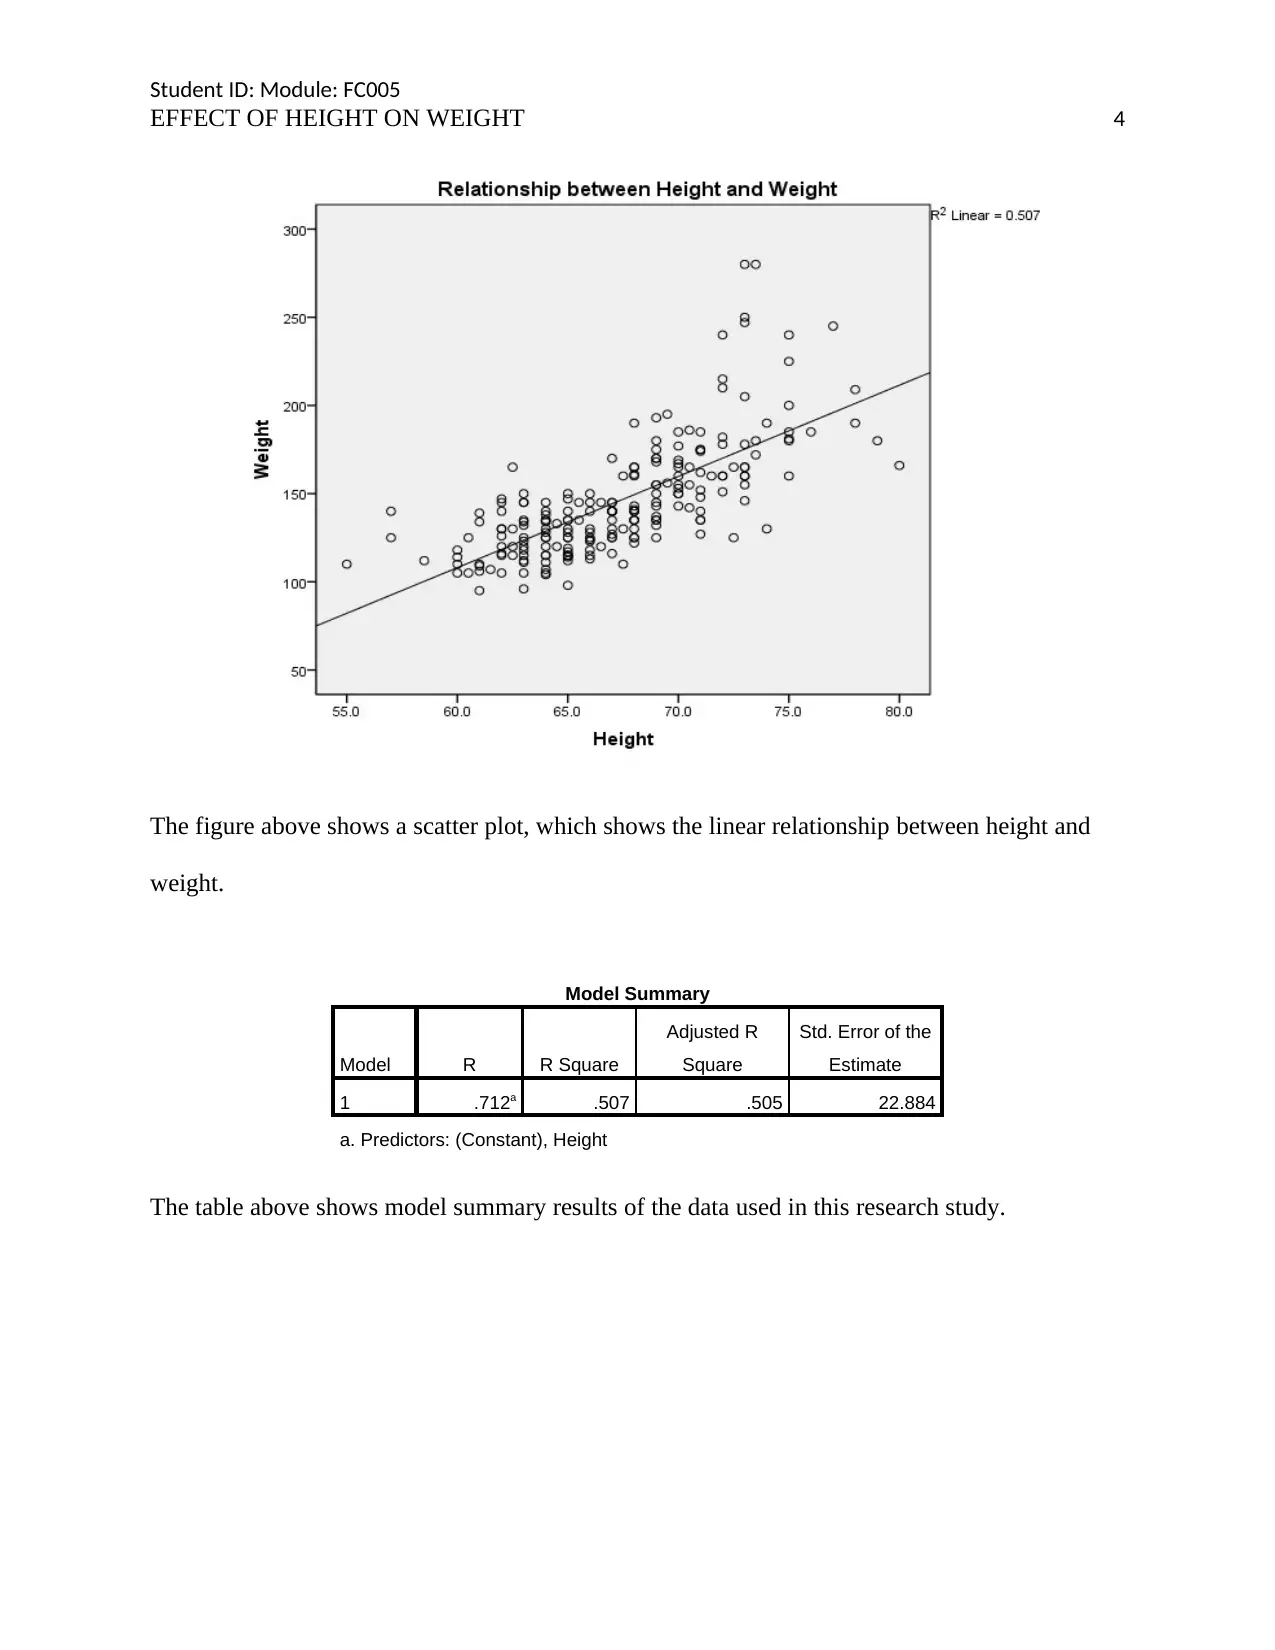
The figure above shows a scatter plot, which shows the linear relationship between height and
weight.
Model Summary
Model R R Square
Adjusted R
Square
Std. Error of the
Estimate
1 .712a .507 .505 22.884
a. Predictors: (Constant), Height
The table above shows model summary results of the data used in this research study.
EFFECT OF HEIGHT ON WEIGHT 4
The figure above shows a scatter plot, which shows the linear relationship between height and
weight.
Model Summary
Model R R Square
Adjusted R
Square
Std. Error of the
Estimate
1 .712a .507 .505 22.884
a. Predictors: (Constant), Height
The table above shows model summary results of the data used in this research study.
Secure Best Marks with AI Grader
Need help grading? Try our AI Grader for instant feedback on your assignments.
Student ID: Module: FC005
EFFECT OF HEIGHT ON WEIGHT 5
ANOVAb
Model Sum of Squares df Mean Square F Sig.
1 Regression 113620.792 1 113620.792 216.959 .000a
Residual 110500.259 211 523.698
Total 224121.052 212
a. Predictors: (Constant), Height
b. Dependent Variable: Weight
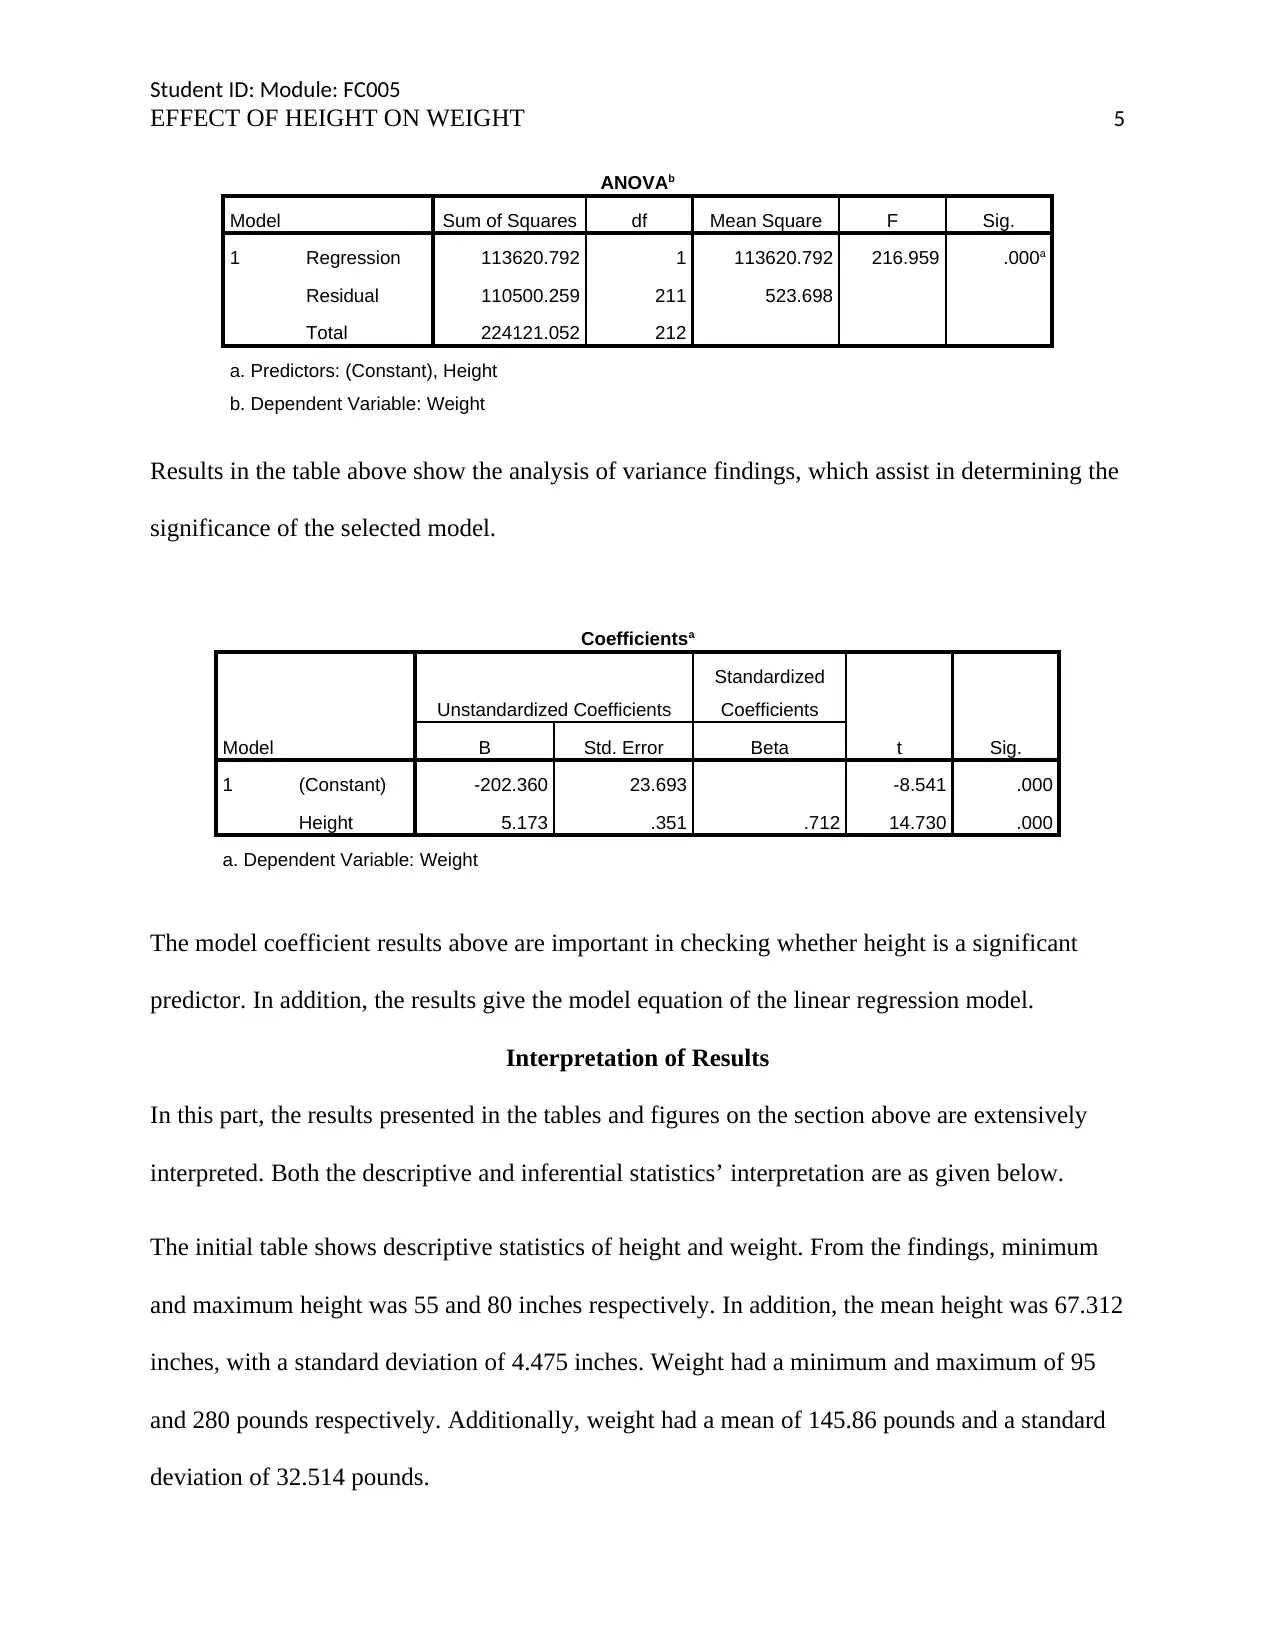
Results in the table above show the analysis of variance findings, which assist in determining the
significance of the selected model.
Coefficientsa
Model
Unstandardized Coefficients
Standardized
Coefficients
t Sig.B Std. Error Beta
1 (Constant) -202.360 23.693 -8.541 .000
Height 5.173 .351 .712 14.730 .000
a. Dependent Variable: Weight
The model coefficient results above are important in checking whether height is a significant
predictor. In addition, the results give the model equation of the linear regression model.
Interpretation of Results
In this part, the results presented in the tables and figures on the section above are extensively
interpreted. Both the descriptive and inferential statistics’ interpretation are as given below.
The initial table shows descriptive statistics of height and weight. From the findings, minimum
and maximum height was 55 and 80 inches respectively. In addition, the mean height was 67.312
inches, with a standard deviation of 4.475 inches. Weight had a minimum and maximum of 95
and 280 pounds respectively. Additionally, weight had a mean of 145.86 pounds and a standard
deviation of 32.514 pounds.
EFFECT OF HEIGHT ON WEIGHT 5
ANOVAb
Model Sum of Squares df Mean Square F Sig.
1 Regression 113620.792 1 113620.792 216.959 .000a
Residual 110500.259 211 523.698
Total 224121.052 212
a. Predictors: (Constant), Height
b. Dependent Variable: Weight
Results in the table above show the analysis of variance findings, which assist in determining the
significance of the selected model.
Coefficientsa
Model
Unstandardized Coefficients
Standardized
Coefficients
t Sig.B Std. Error Beta
1 (Constant) -202.360 23.693 -8.541 .000
Height 5.173 .351 .712 14.730 .000
a. Dependent Variable: Weight
The model coefficient results above are important in checking whether height is a significant
predictor. In addition, the results give the model equation of the linear regression model.
Interpretation of Results
In this part, the results presented in the tables and figures on the section above are extensively
interpreted. Both the descriptive and inferential statistics’ interpretation are as given below.
The initial table shows descriptive statistics of height and weight. From the findings, minimum
and maximum height was 55 and 80 inches respectively. In addition, the mean height was 67.312
inches, with a standard deviation of 4.475 inches. Weight had a minimum and maximum of 95
and 280 pounds respectively. Additionally, weight had a mean of 145.86 pounds and a standard
deviation of 32.514 pounds.
Student ID: Module: FC005
EFFECT OF HEIGHT ON WEIGHT 6
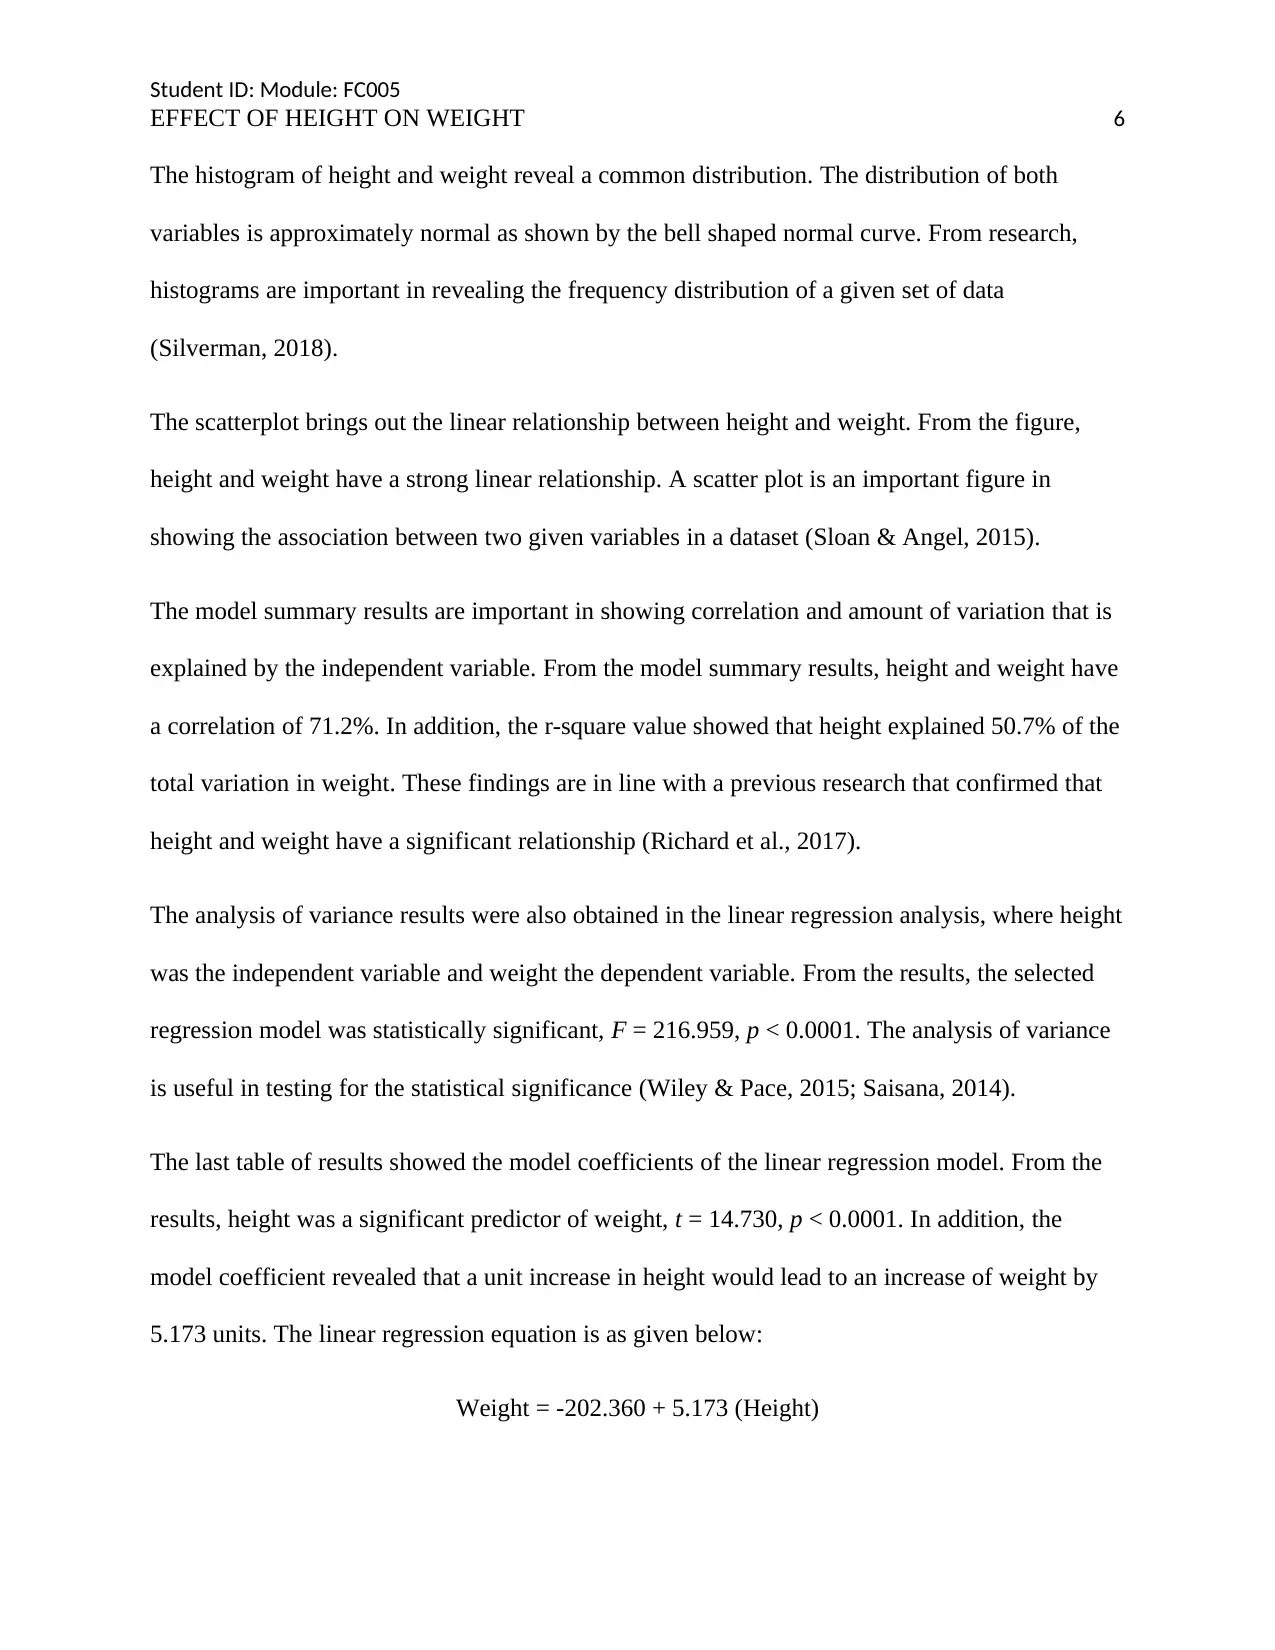
The histogram of height and weight reveal a common distribution. The distribution of both
variables is approximately normal as shown by the bell shaped normal curve. From research,
histograms are important in revealing the frequency distribution of a given set of data
(Silverman, 2018).
The scatterplot brings out the linear relationship between height and weight. From the figure,
height and weight have a strong linear relationship. A scatter plot is an important figure in
showing the association between two given variables in a dataset (Sloan & Angel, 2015).
The model summary results are important in showing correlation and amount of variation that is
explained by the independent variable. From the model summary results, height and weight have
a correlation of 71.2%. In addition, the r-square value showed that height explained 50.7% of the
total variation in weight. These findings are in line with a previous research that confirmed that
height and weight have a significant relationship (Richard et al., 2017).
The analysis of variance results were also obtained in the linear regression analysis, where height
was the independent variable and weight the dependent variable. From the results, the selected
regression model was statistically significant, F = 216.959, p < 0.0001. The analysis of variance
is useful in testing for the statistical significance (Wiley & Pace, 2015; Saisana, 2014).
The last table of results showed the model coefficients of the linear regression model. From the
results, height was a significant predictor of weight, t = 14.730, p < 0.0001. In addition, the
model coefficient revealed that a unit increase in height would lead to an increase of weight by
5.173 units. The linear regression equation is as given below:
Weight = -202.360 + 5.173 (Height)
EFFECT OF HEIGHT ON WEIGHT 6
The histogram of height and weight reveal a common distribution. The distribution of both
variables is approximately normal as shown by the bell shaped normal curve. From research,
histograms are important in revealing the frequency distribution of a given set of data
(Silverman, 2018).
The scatterplot brings out the linear relationship between height and weight. From the figure,
height and weight have a strong linear relationship. A scatter plot is an important figure in
showing the association between two given variables in a dataset (Sloan & Angel, 2015).
The model summary results are important in showing correlation and amount of variation that is
explained by the independent variable. From the model summary results, height and weight have
a correlation of 71.2%. In addition, the r-square value showed that height explained 50.7% of the
total variation in weight. These findings are in line with a previous research that confirmed that
height and weight have a significant relationship (Richard et al., 2017).
The analysis of variance results were also obtained in the linear regression analysis, where height
was the independent variable and weight the dependent variable. From the results, the selected
regression model was statistically significant, F = 216.959, p < 0.0001. The analysis of variance
is useful in testing for the statistical significance (Wiley & Pace, 2015; Saisana, 2014).
The last table of results showed the model coefficients of the linear regression model. From the
results, height was a significant predictor of weight, t = 14.730, p < 0.0001. In addition, the
model coefficient revealed that a unit increase in height would lead to an increase of weight by
5.173 units. The linear regression equation is as given below:
Weight = -202.360 + 5.173 (Height)
Student ID: Module: FC005
EFFECT OF HEIGHT ON WEIGHT 7
Conclusions
As stated previously, the research study aimed at finding out whether height has an impact on the
weight of an individual. The data analysis above was conducted and presented both in
descriptive and inferential statistics. The descriptive statistics showed the basic characteristics of
the data such as mean, standard deviation and the distribution. Inferential analysis involved
performing a linear regression analysis. The findings of regression revealed that height has
statistically significant impacts on the weight of an individual.
Paraphrase This Document
Need a fresh take? Get an instant paraphrase of this document with our AI Paraphraser
Student ID: Module: FC005
EFFECT OF HEIGHT ON WEIGHT 8
References
Draper, N. R., & Smith, H. (2014). Applied regression analysis (Vol. 326). London: John Wiley
& Sons, 127-135.
Ho, A. D., & Yu, C. C. (2015). Descriptive statistics for modern test score distributions:
Skewness, kurtosis, discreteness, and ceiling effects. Educational and Psychological
Measurement, 75(3), 365-388.
Marshall, B. A., Mai, X., Sperrazza, J. N., Hovey, K. M., & Wactawski-Wende, J. (2017).
Inaccurate self-report of height and its impact on misclassification of body mass index in
postmenopausal women. Menopause (New York, NY), 24(5), 484-489.
Wiley, J. F., & Pace, L. A. (2015). Analysis of variance. In Beginning R. Apress, Berkeley, CA,
111–120.
Richard, J., Antonisamy, B., Vasan, S. K., Geethanjali, F. S., Gowri, M., Hepsy, Y. S., ... & Fall,
C. H. (2017). Weight gain and height growth during infancy, childhood, and adolescence
as predictors of adult cardiovascular risk. The Journal of pediatrics, 180, 53-61.
Saisana, M. (2014). Analysis of Variance. Encyclopedia of Quality of Life and Well-Being
Research. Canada: Springer. 162-165.
Silverman, B. W. (2018). Density estimation for statistics and data analysis. London: Routledge.
2(1), 175-193.
Sloan, L., & Angell, R. (2015). Two-way scatter plot and the UK Living Cost and Food Survey
(2010): Household income and expenditure. SAGE Publications Ltd, 59-68.

Student ID: Module: FC005
EFFECT OF HEIGHT ON WEIGHT 9
Appendix: Data
EFFECT OF HEIGHT ON WEIGHT 9
Appendix: Data
1 out of 9
Related Documents


Your All-in-One AI-Powered Toolkit for Academic Success.
+13062052269
info@desklib.com
Available 24*7 on WhatsApp / Email
![[object Object]](/_next/static/media/star-bottom.7253800d.svg)
Unlock your academic potential
© 2024 | Zucol Services PVT LTD | All rights reserved.