Biostatistics SPSS Assignment: Analyzing Diabetes and Framingham Data
VerifiedAdded on 2023/06/04
|11
|2317
|467
Homework Assignment
AI Summary
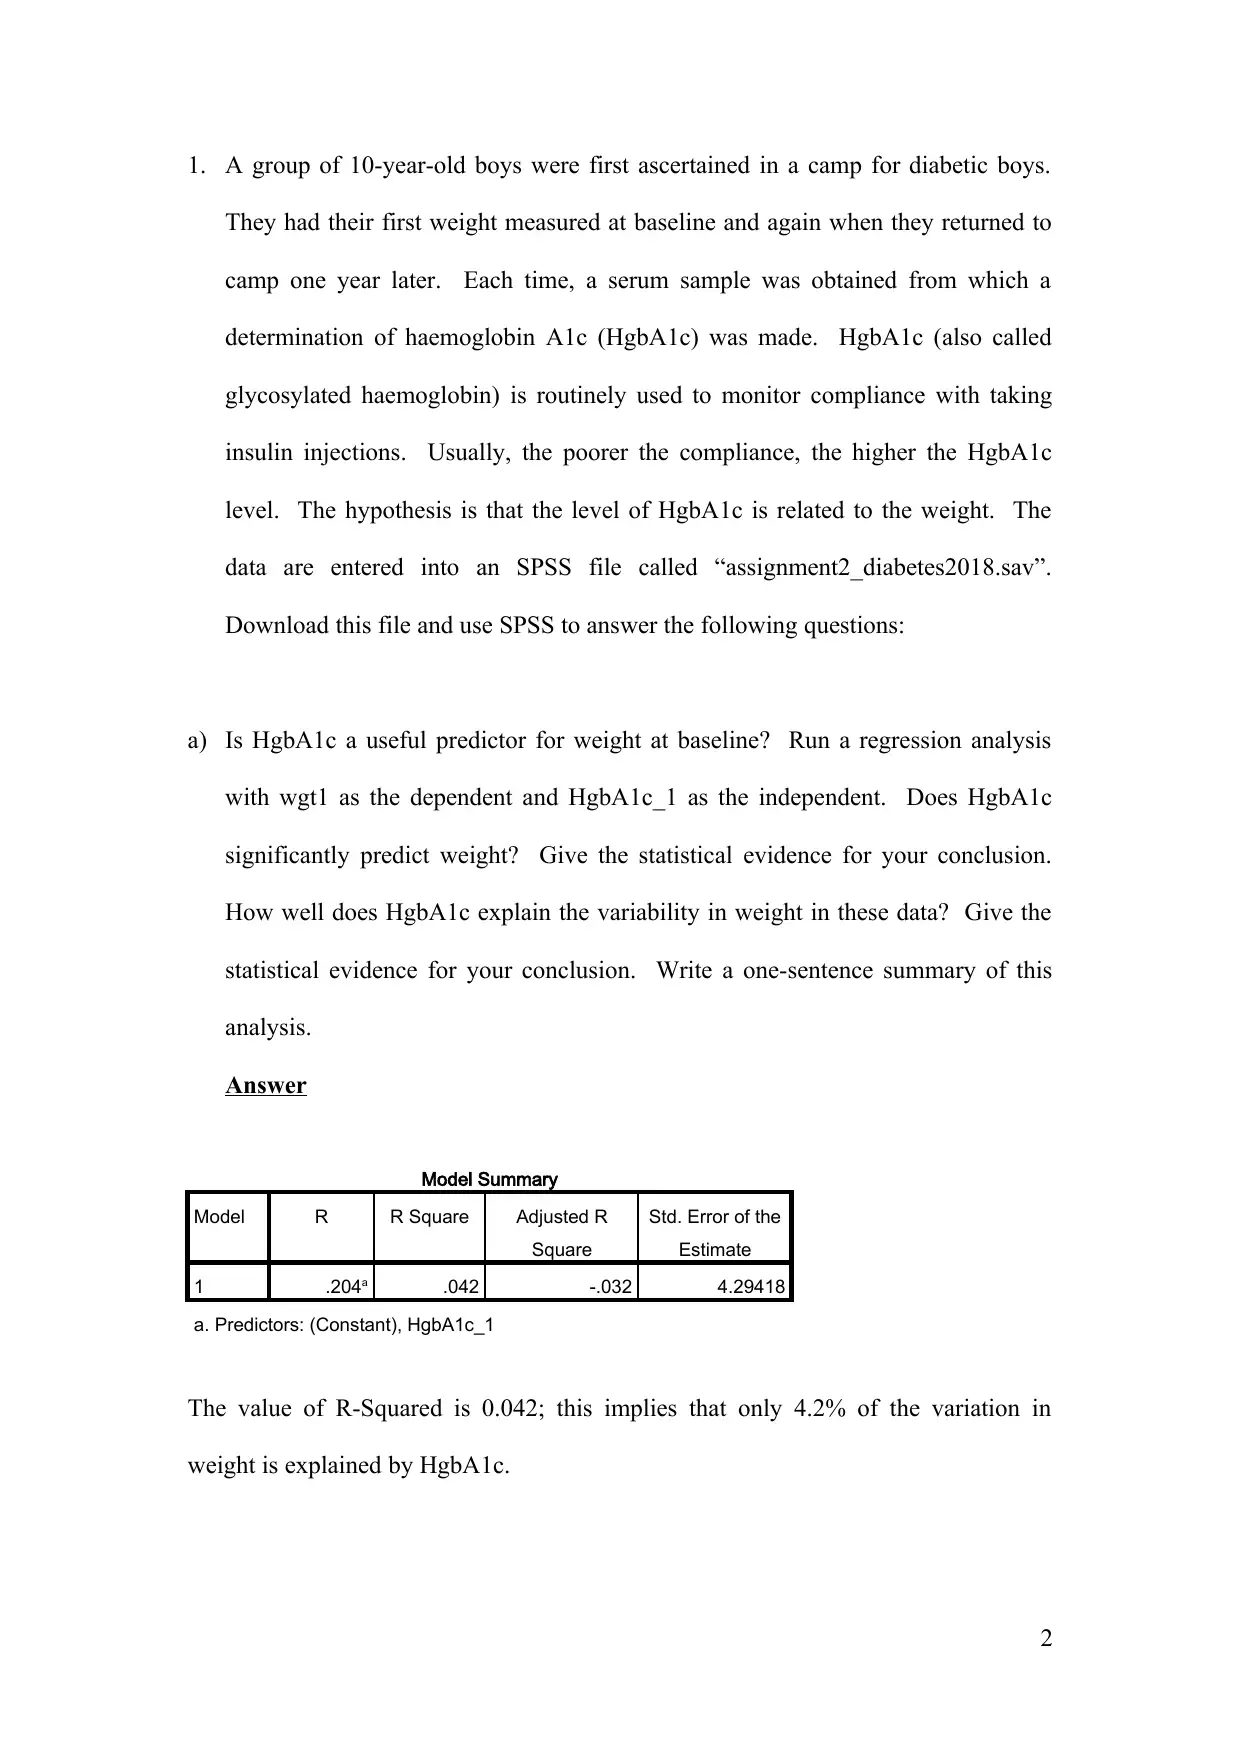
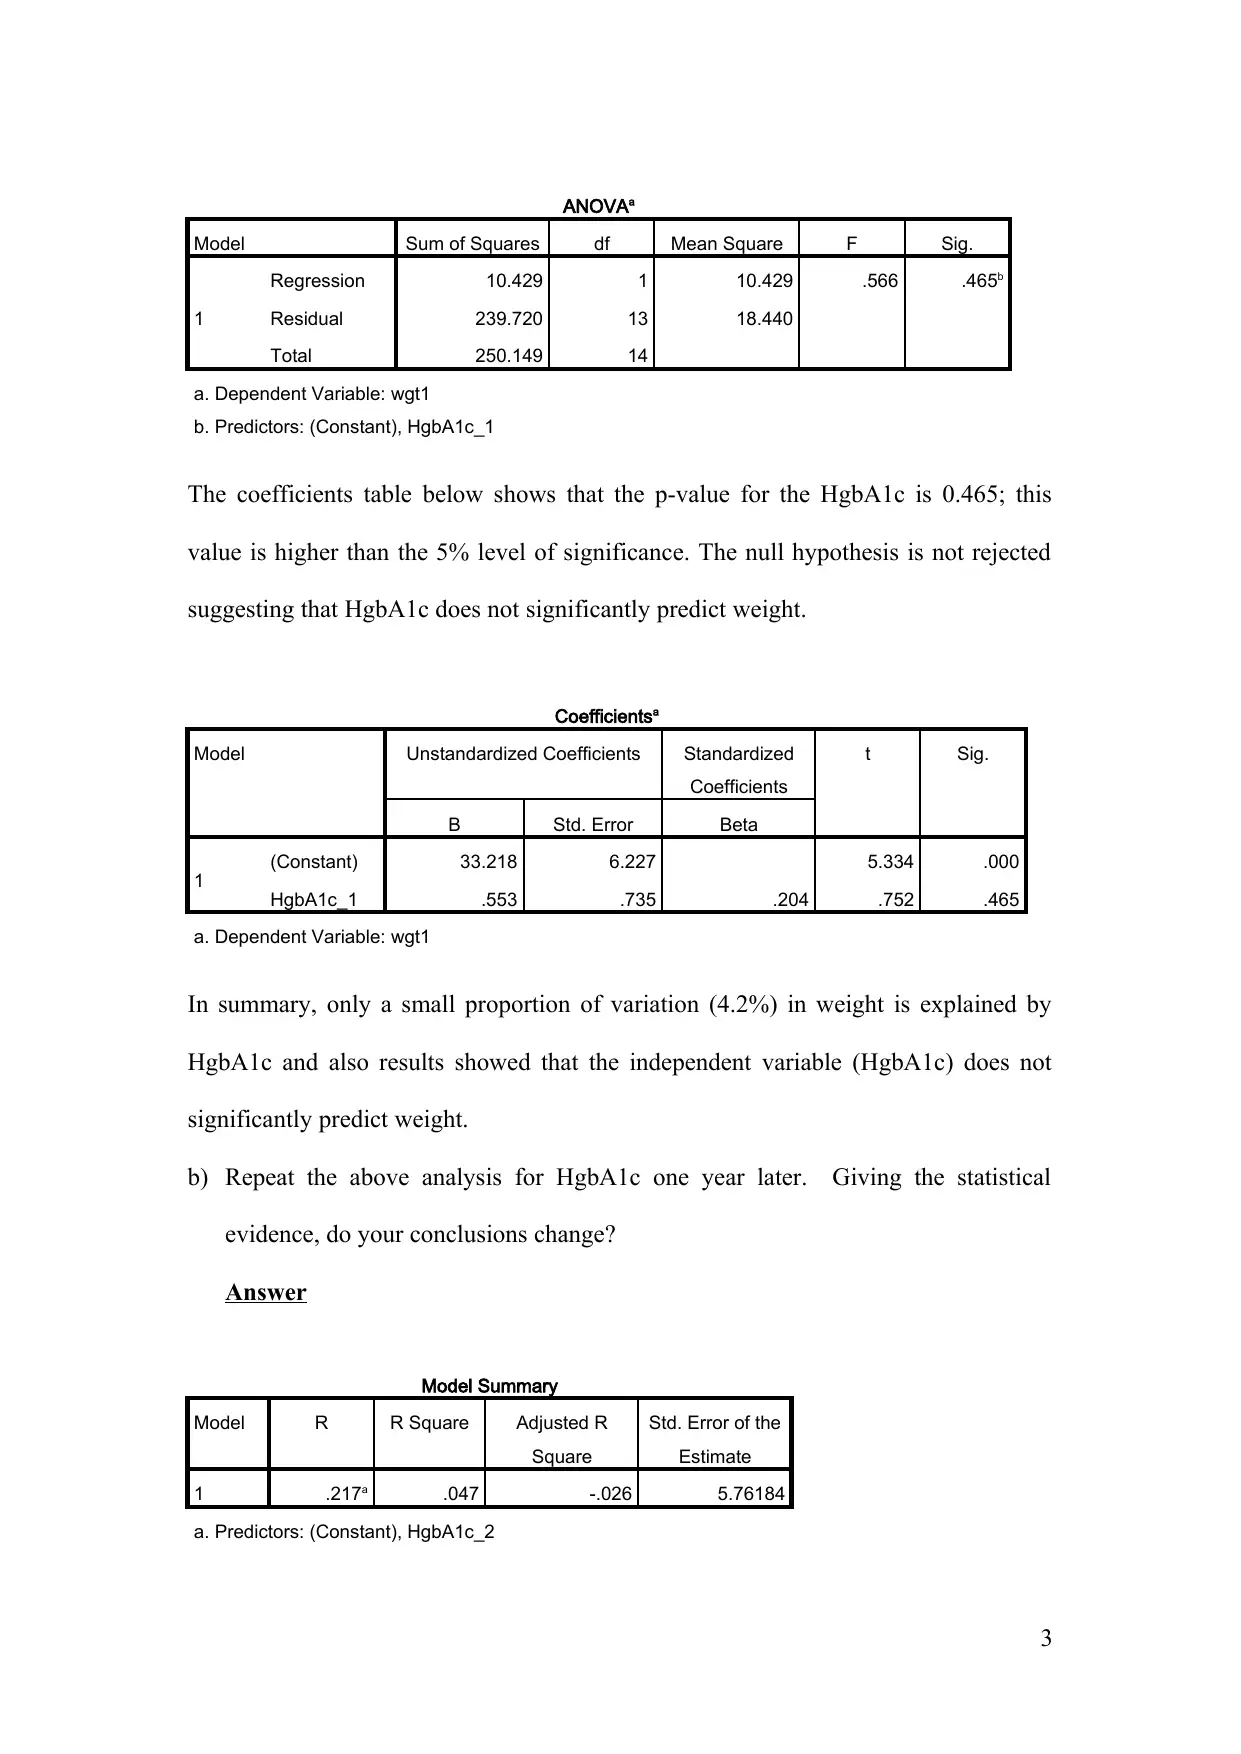
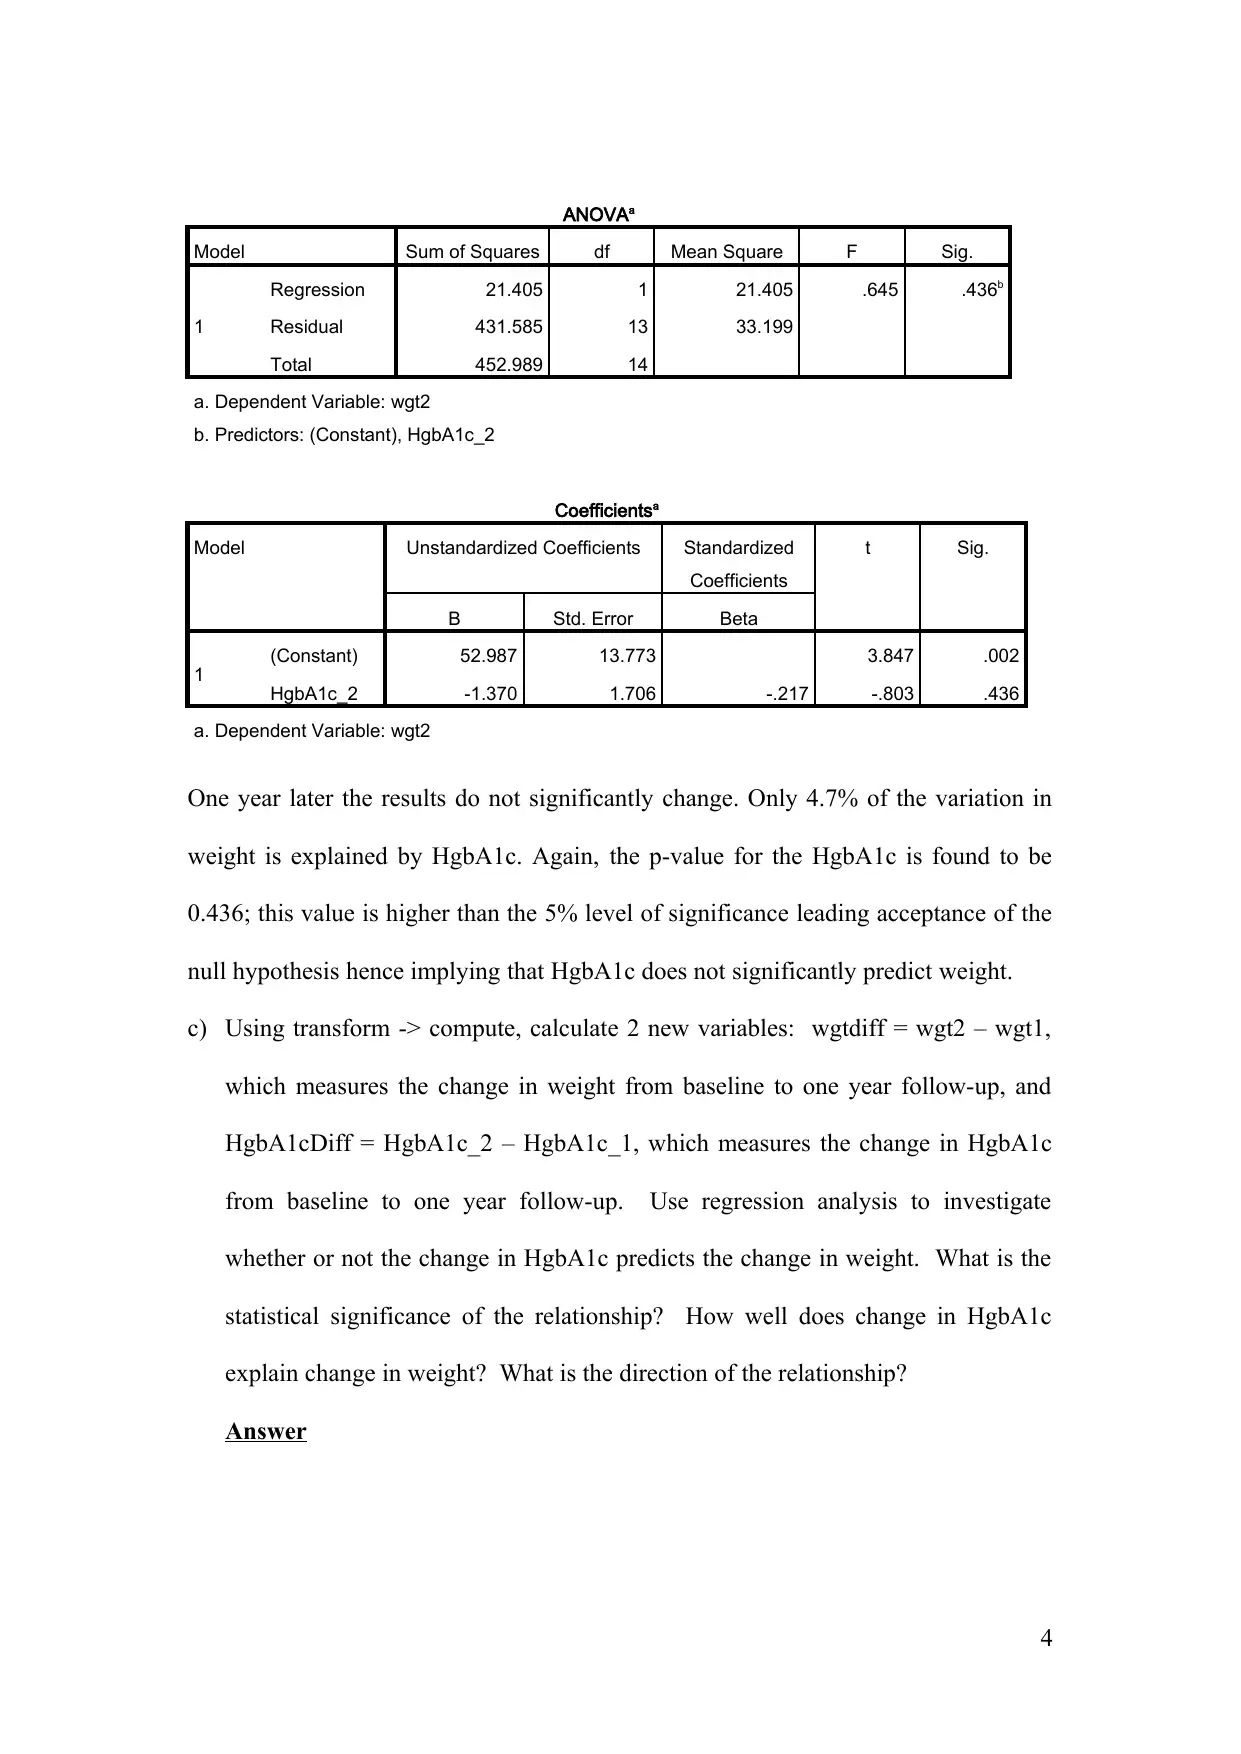
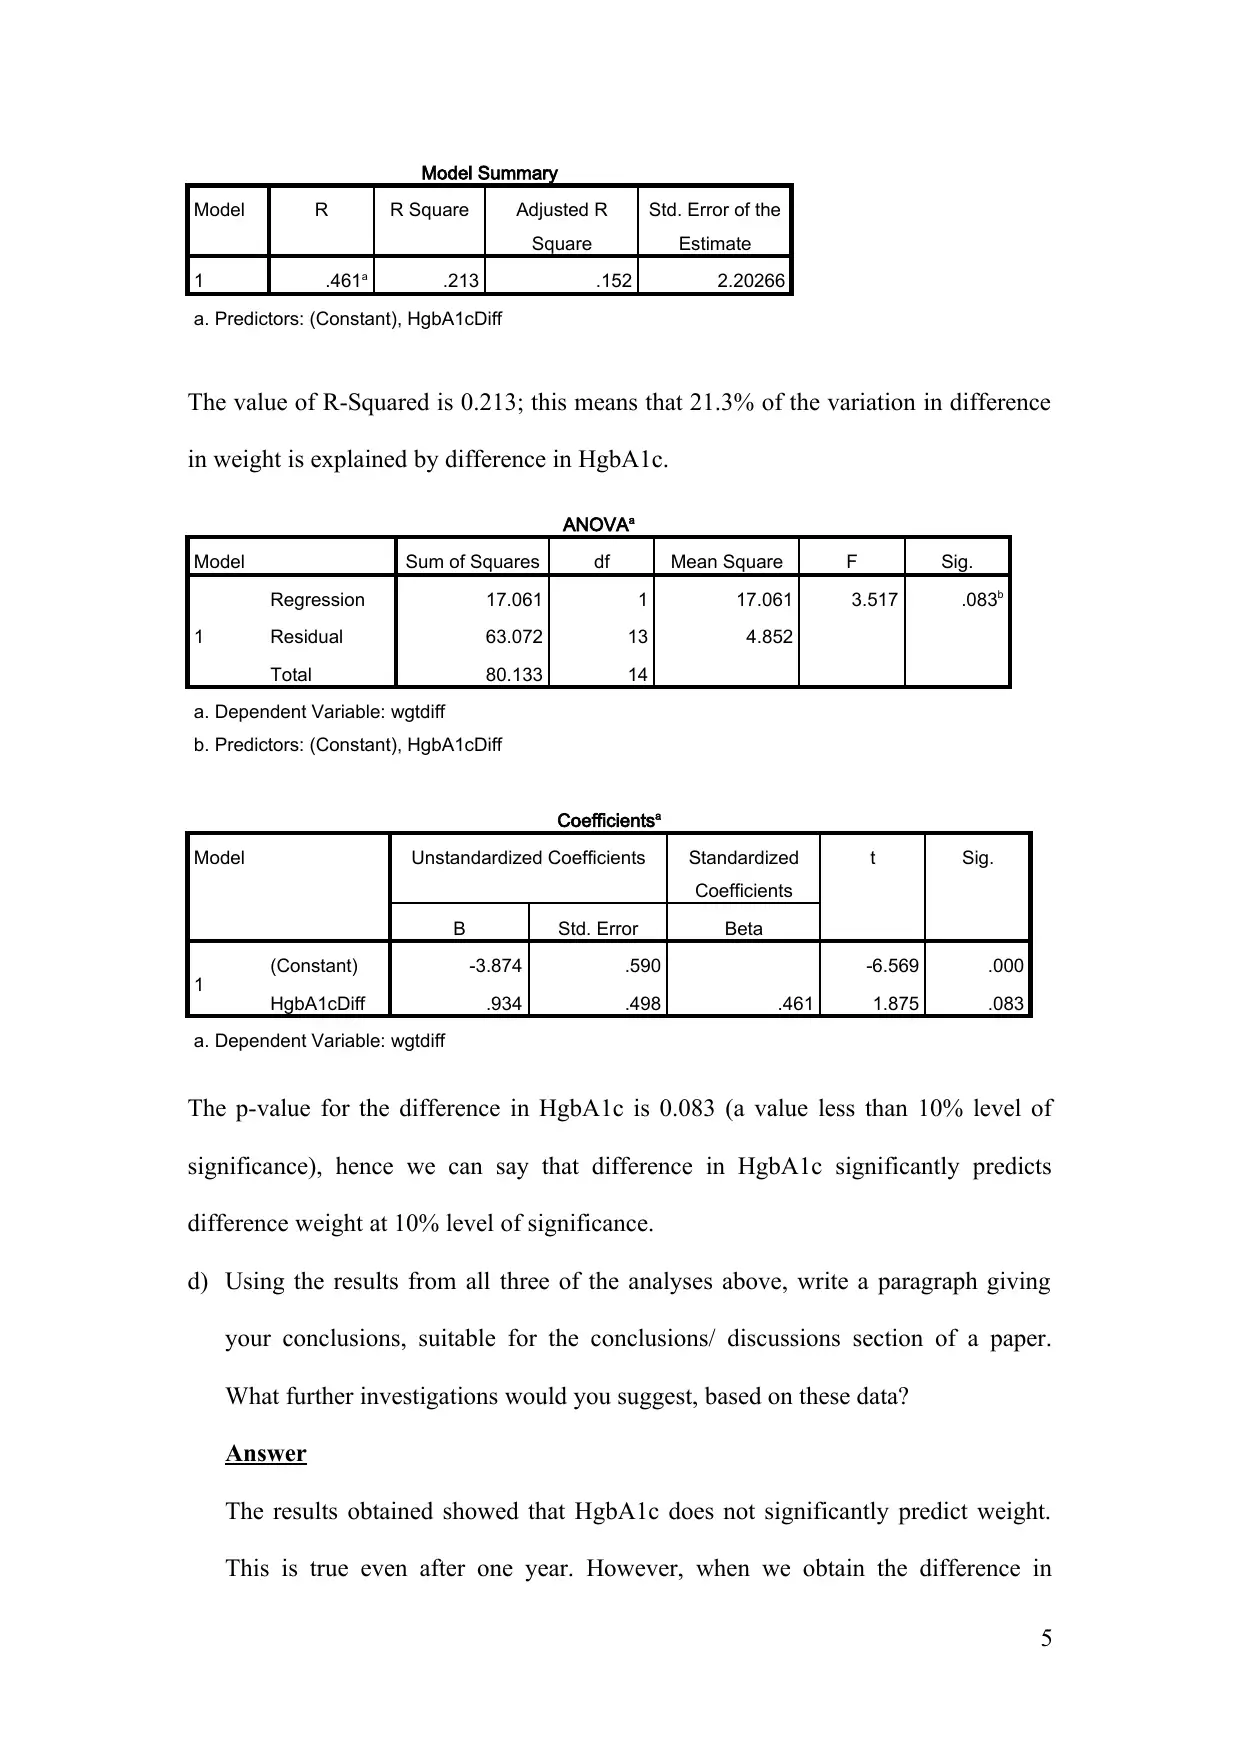
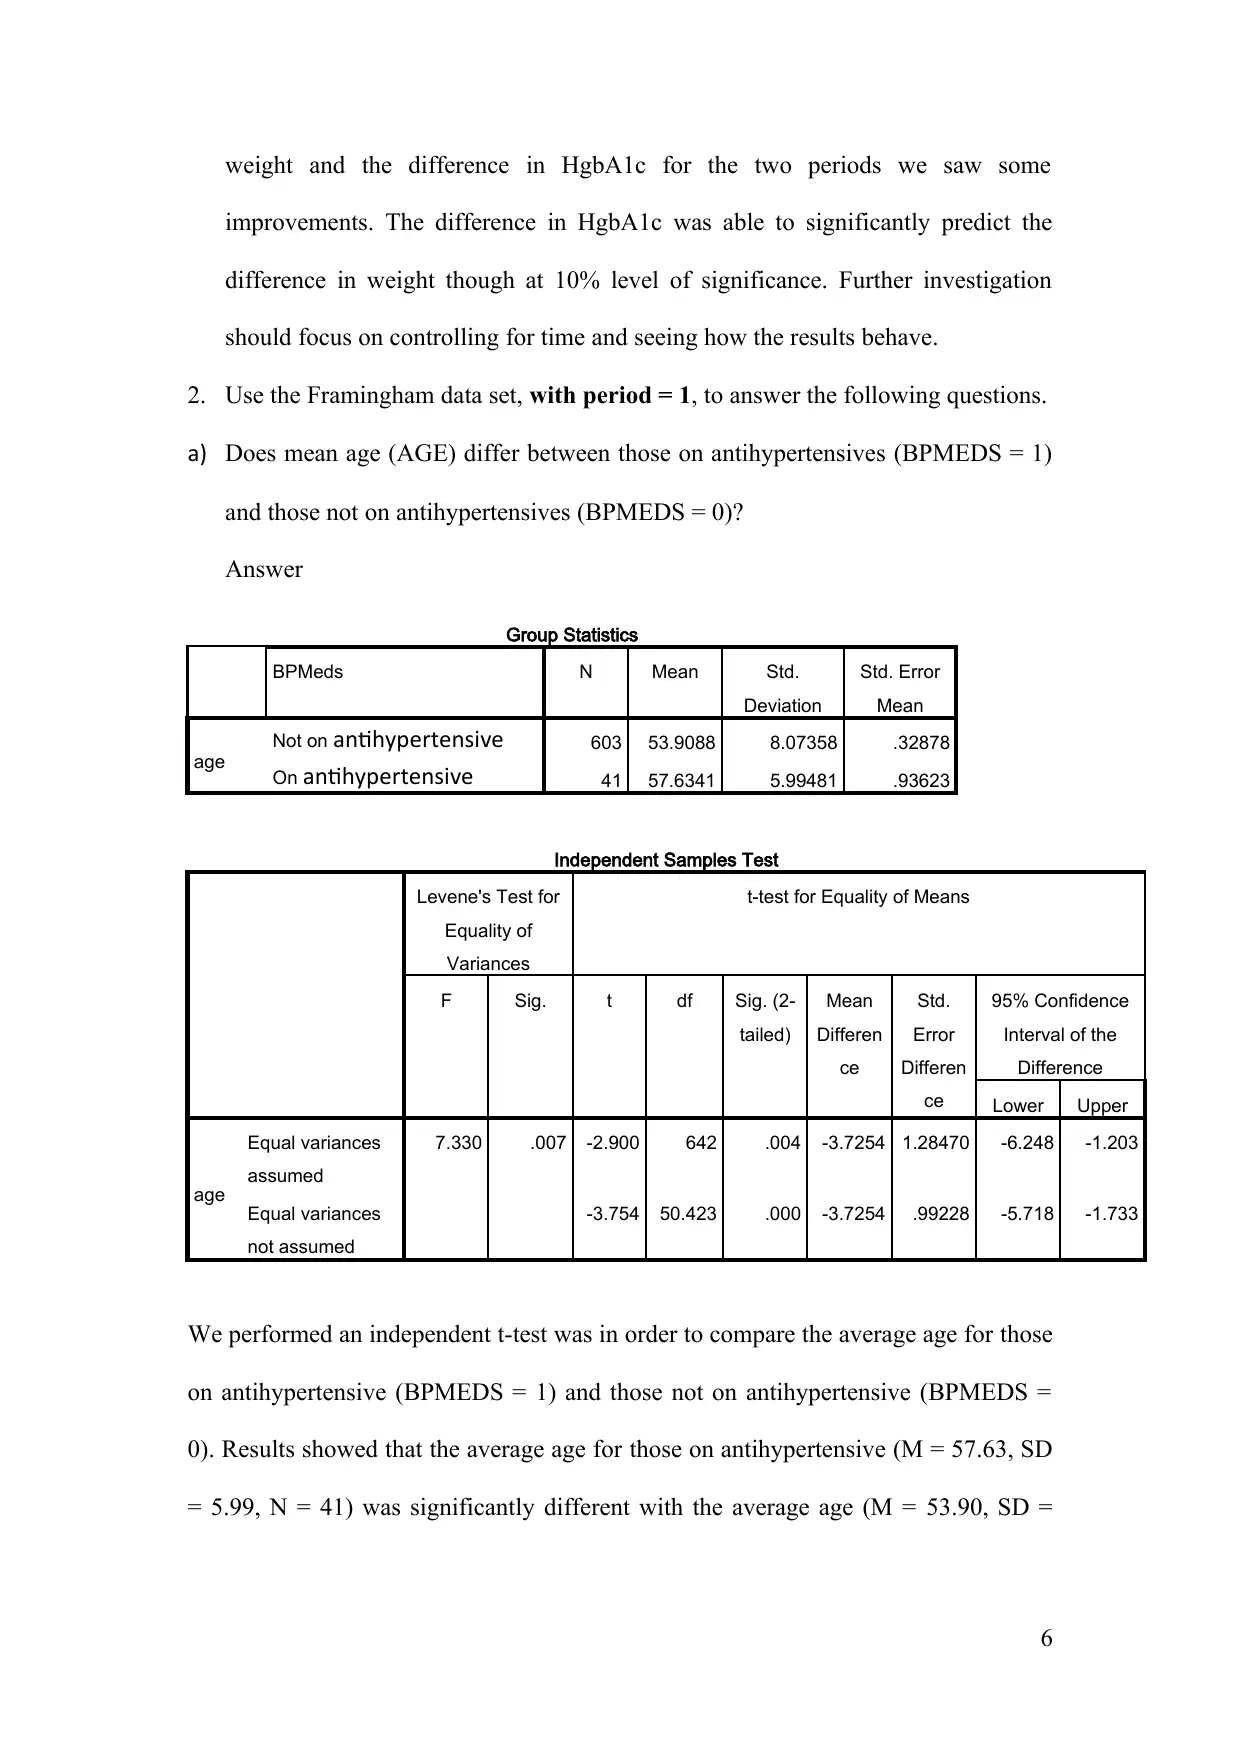
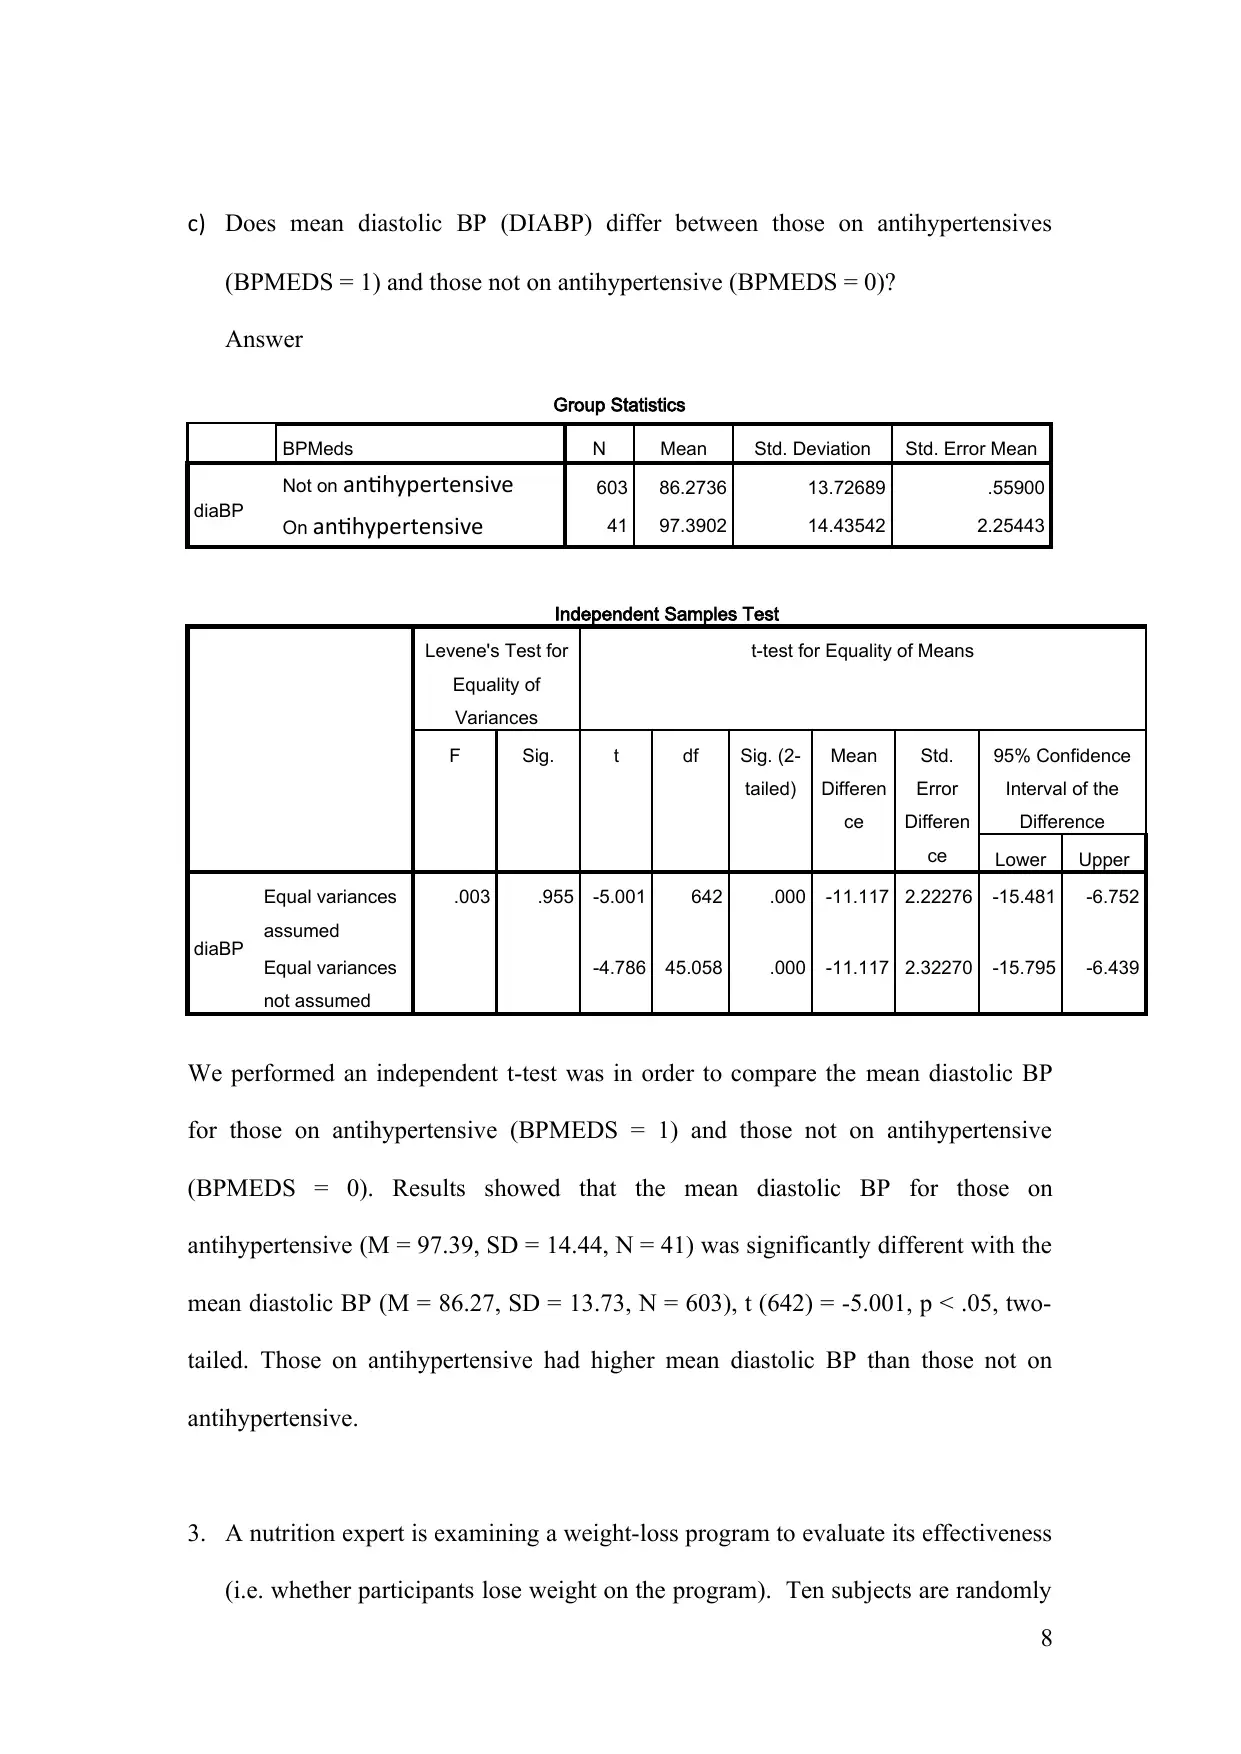
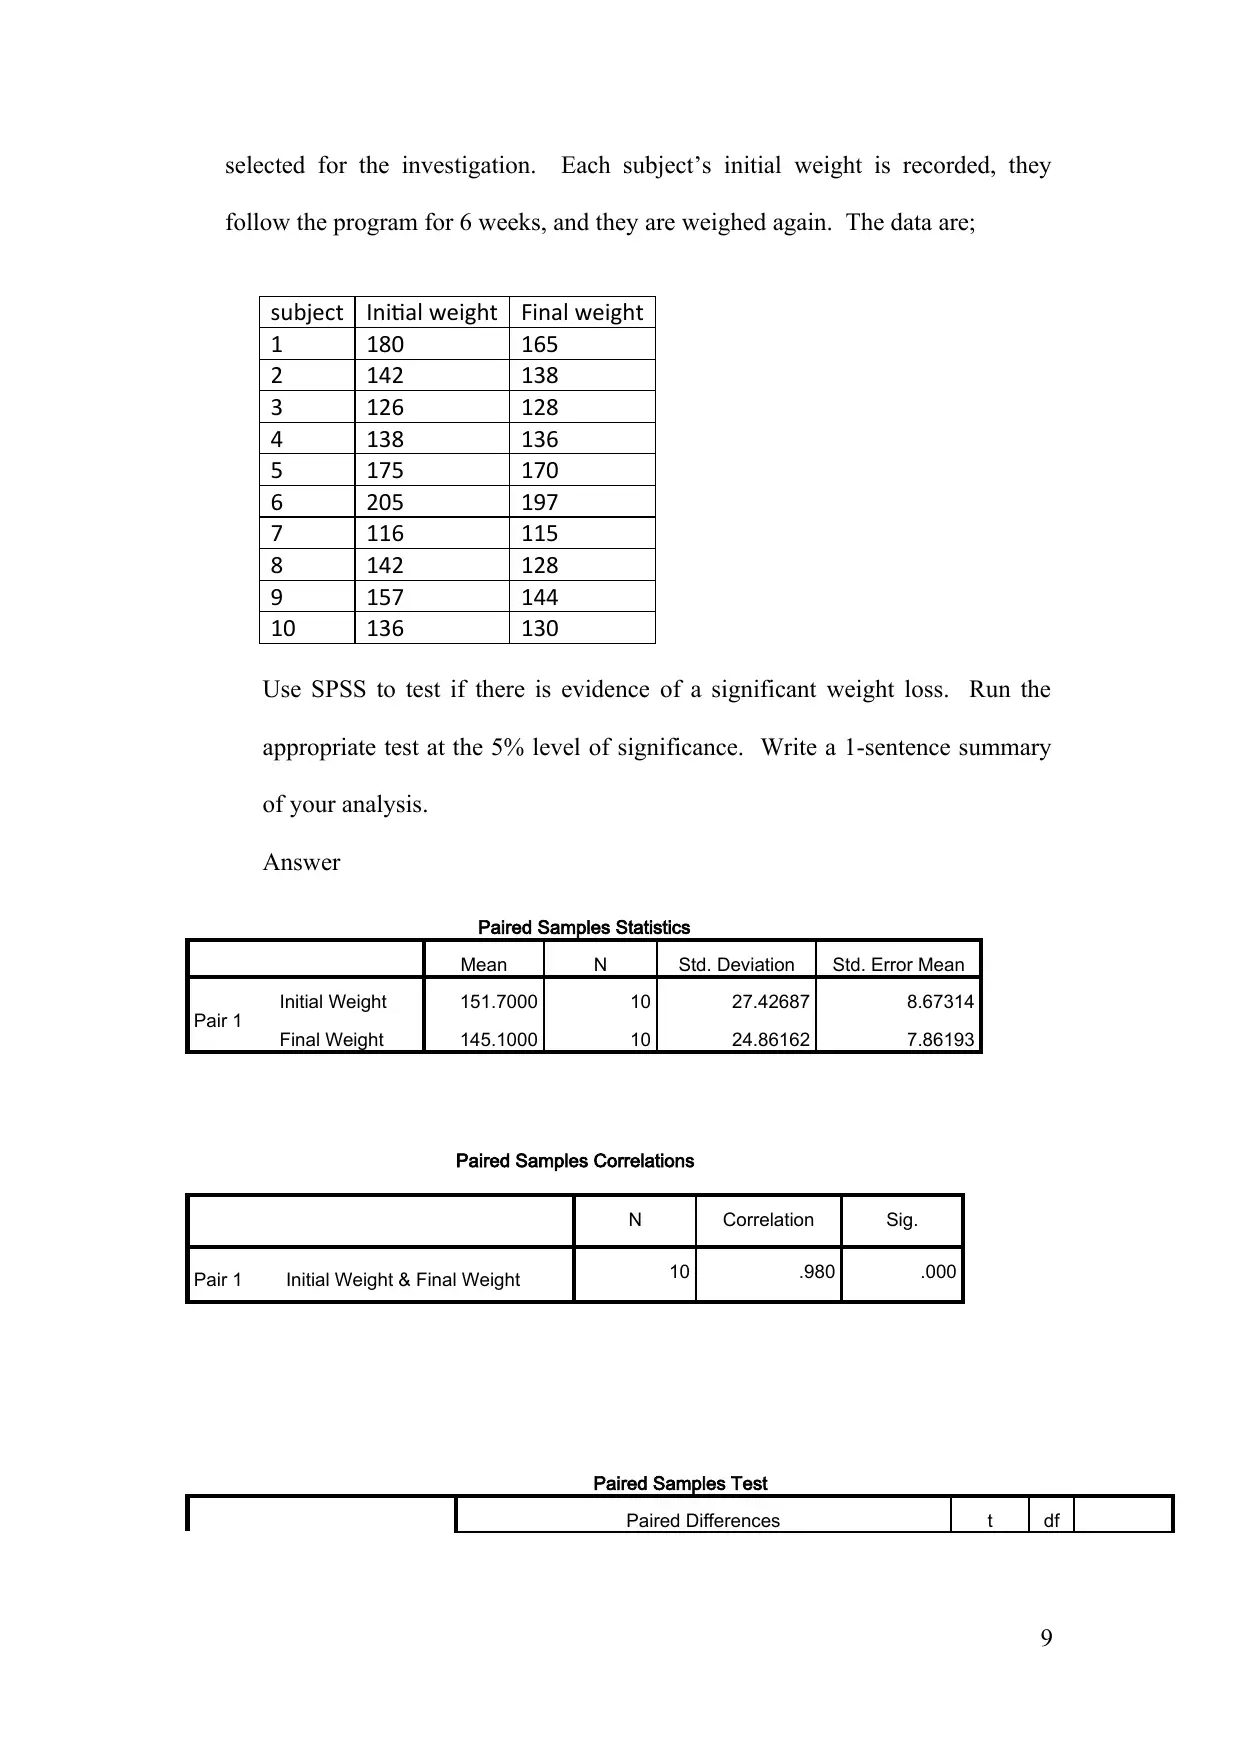
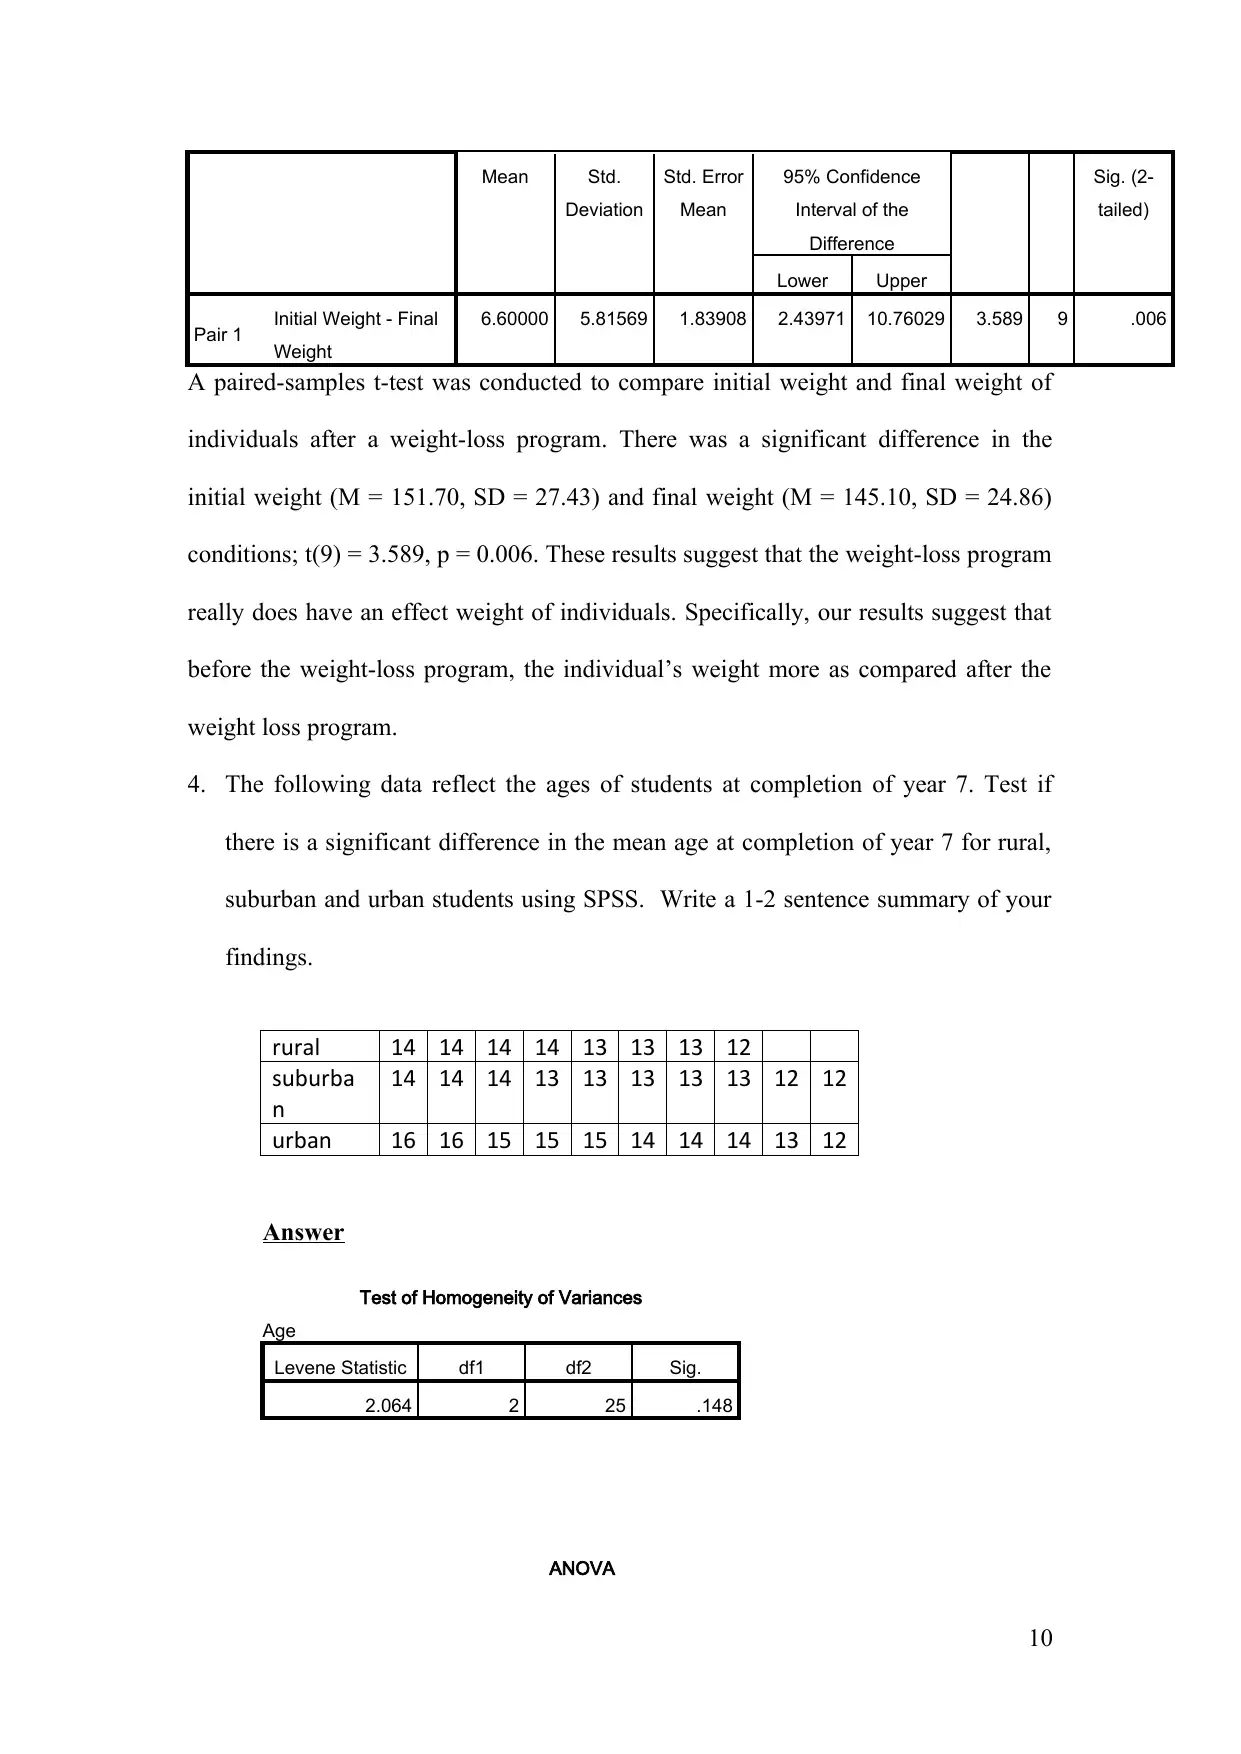
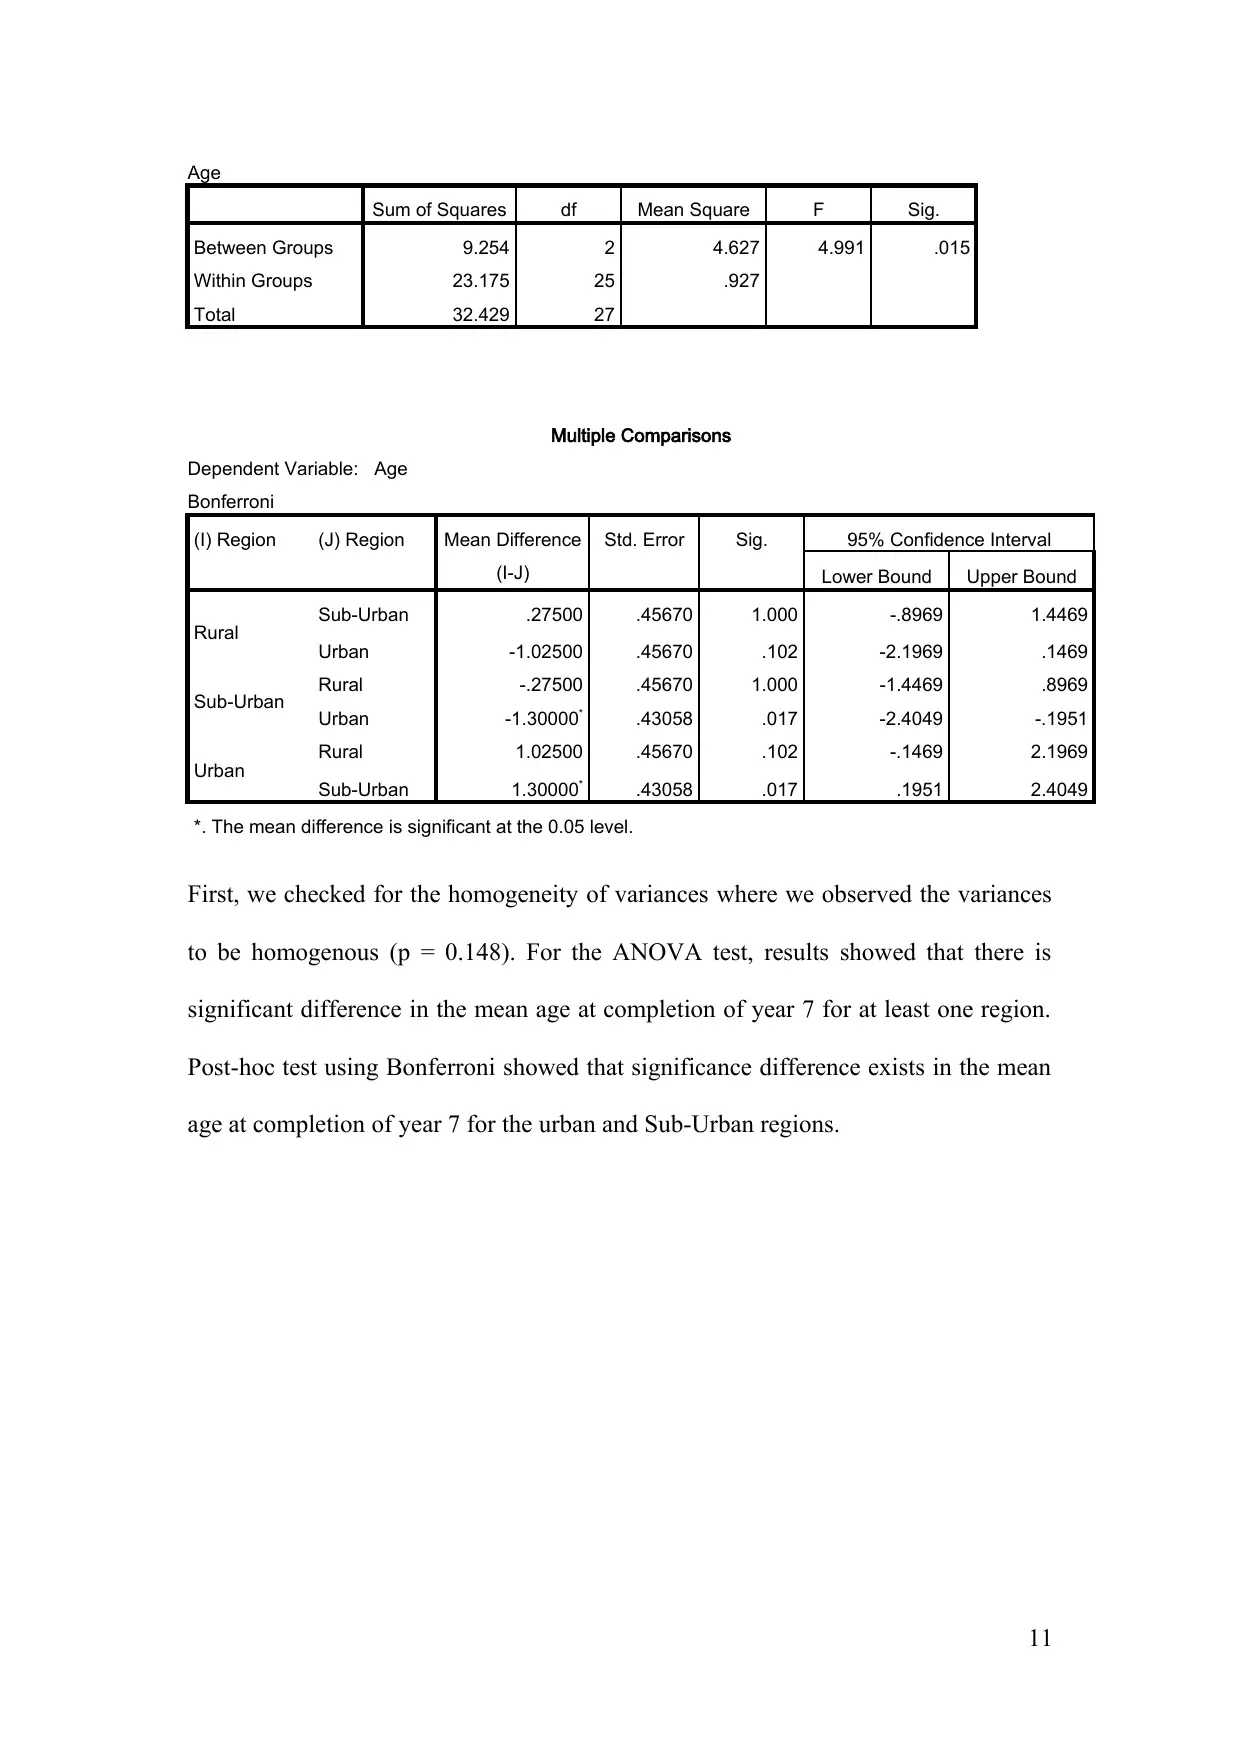
This assignment provides solutions to several biostatistics problems using SPSS. The first problem analyzes a diabetes dataset, investigating the relationship between HbA1c levels and weight in a group of 10-year-old boys. Regression analysis is used to determine if HbA1c is a useful predictor of weight at baseline and one year later, as well as whether changes in HbA1c predict changes in weight. The second problem uses the Framingham dataset to compare mean age, systolic BP, and diastolic BP between individuals on antihypertensive medication and those not on medication, using independent t-tests. The third problem examines a weight-loss program, using a paired-samples t-test to assess if there is significant weight loss among participants. Finally, the fourth problem investigates differences in the mean age at completion of year 7 for rural, suburban, and urban students, employing ANOVA and post-hoc tests. The assignment concludes with interpretations of the statistical results and suggestions for further investigations. Desklib is a great resource to find similar solved assignments and past papers.

1 out of 11
Related Documents


Your All-in-One AI-Powered Toolkit for Academic Success.
+13062052269
info@desklib.com
Available 24*7 on WhatsApp / Email
![[object Object]](/_next/static/media/star-bottom.7253800d.svg)
Copyright © 2020–2026 A2Z Services. All Rights Reserved. Developed and managed by ZUCOL.