HI5002 Finance for Business: Financial Statement and WACC Analysis
VerifiedAdded on 2024/06/04
|12
|1724
|184
Report
AI Summary
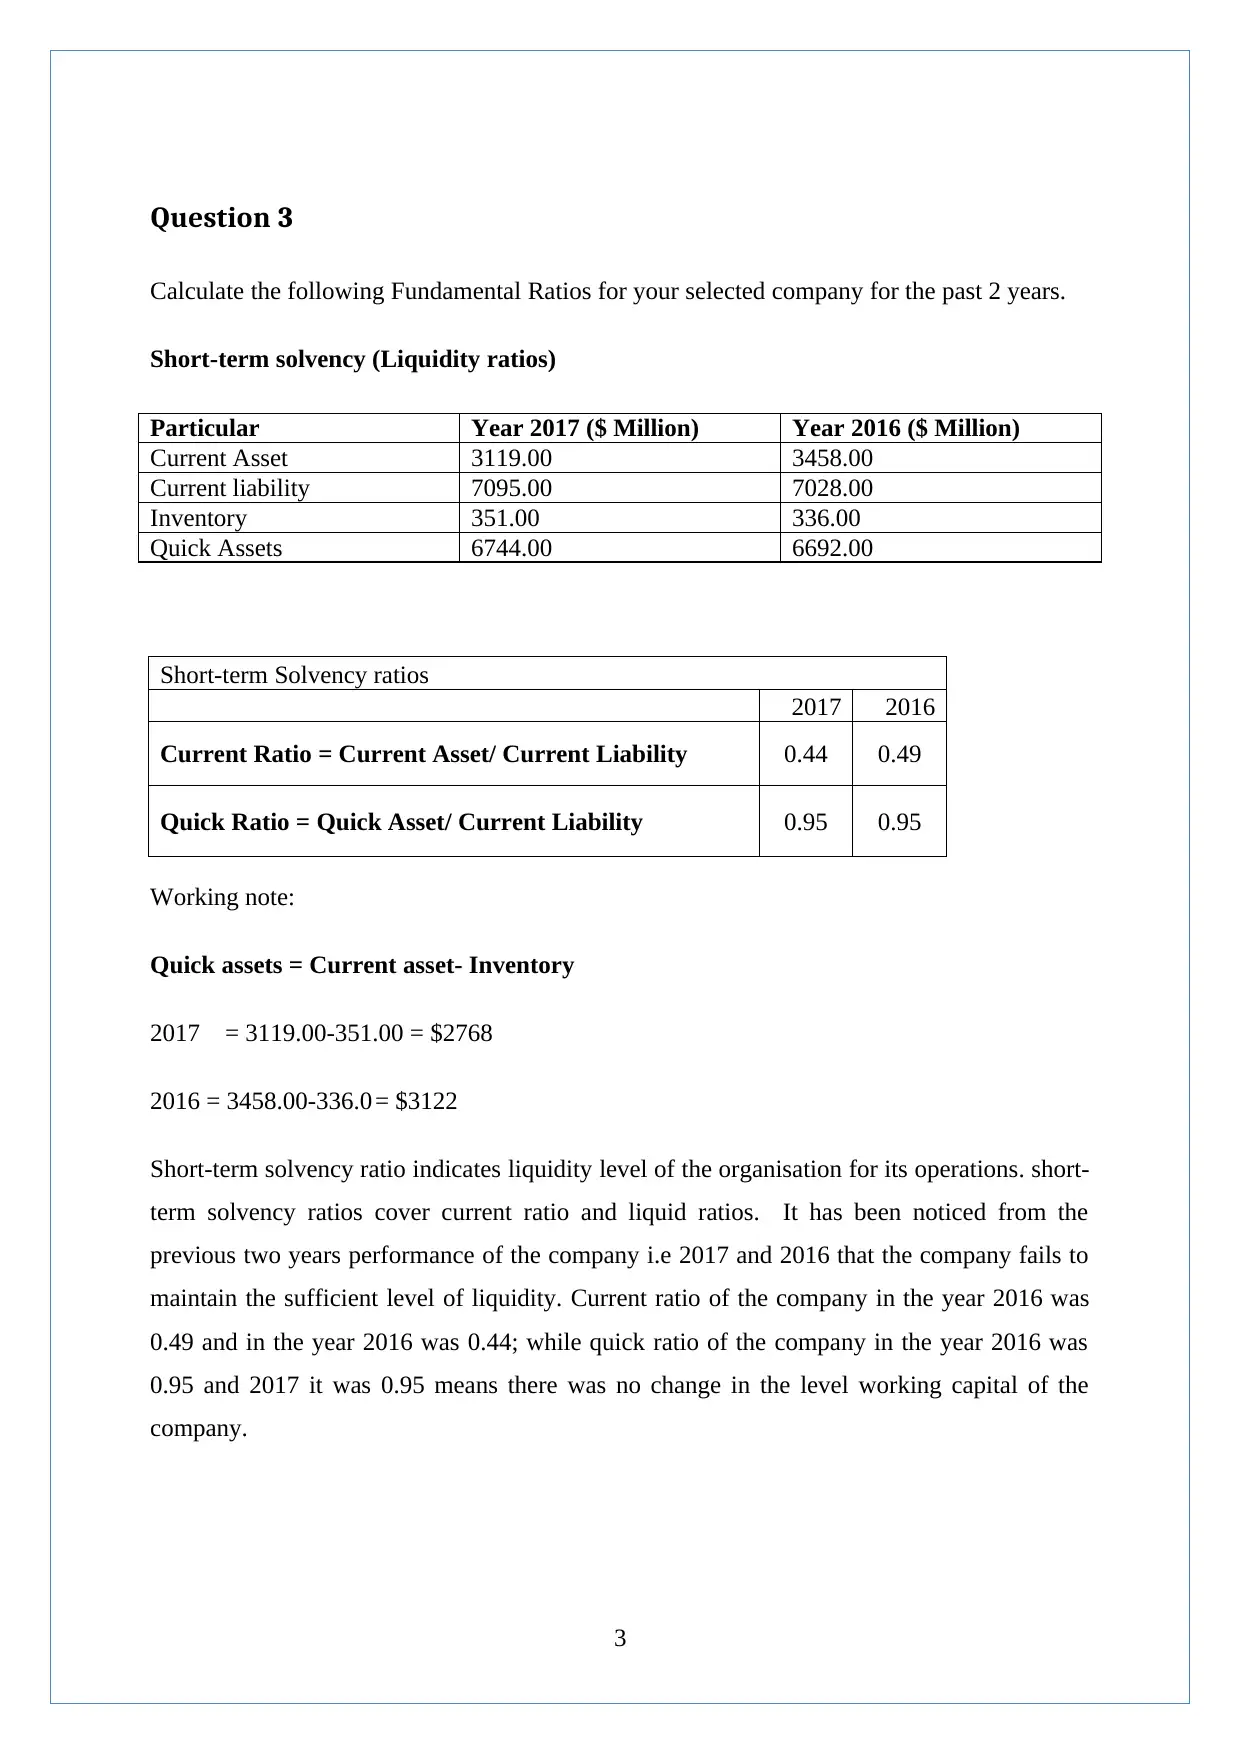
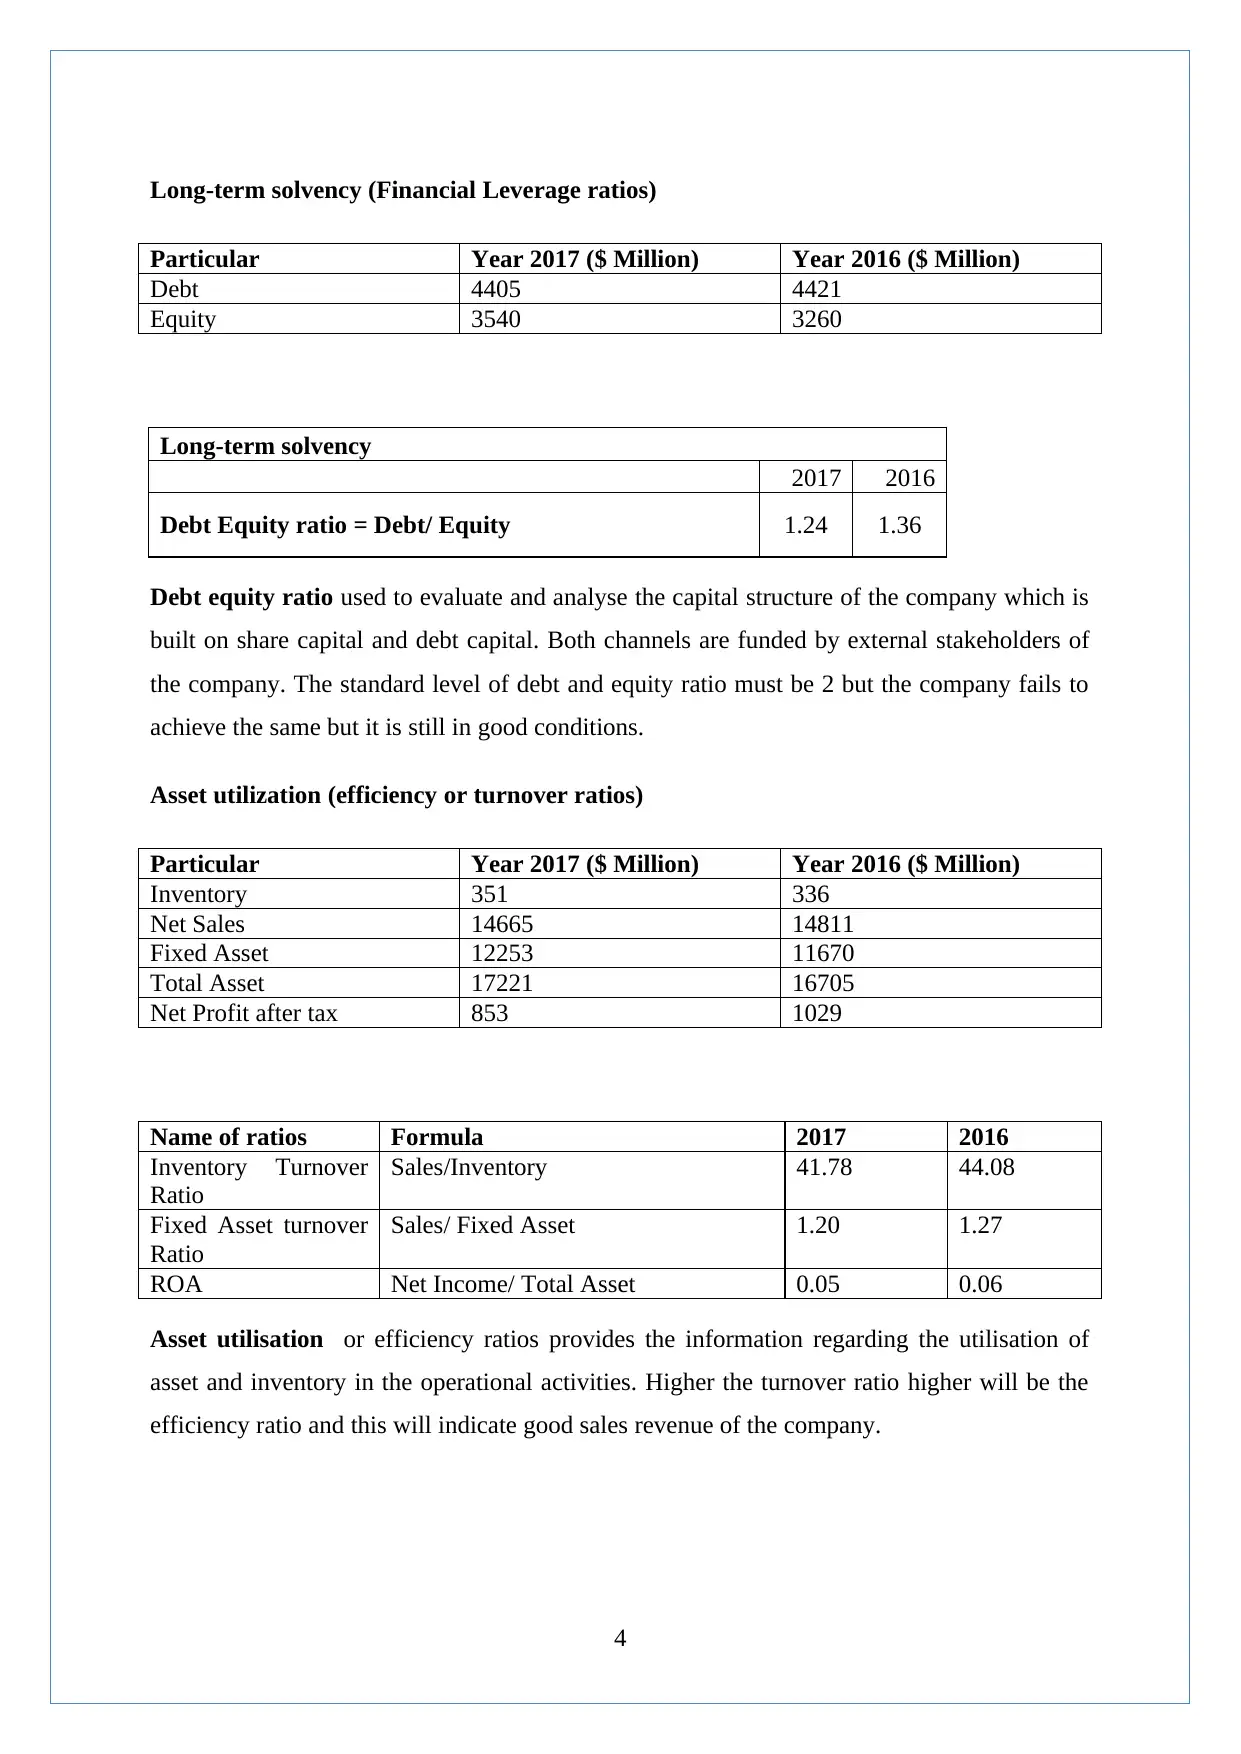
This report provides a financial analysis of a selected company, including the calculation and interpretation of fundamental ratios such as short-term solvency, long-term solvency, asset utilization, and profitability ratios for the past two years. It features a share price analysis presented graphically, comparing it with an index, and discusses the implications of a company's weighted average cost of capital (WACC). The report also examines the company's capital structure, gearing ratios, and dividend policy, referencing the company's annual reports to support its findings. Desklib provides access to this and other solved assignments for students.
1 out of 12
Related Documents


Your All-in-One AI-Powered Toolkit for Academic Success.
+13062052269
info@desklib.com
Available 24*7 on WhatsApp / Email
![[object Object]](/_next/static/media/star-bottom.7253800d.svg)
Copyright © 2020–2026 A2Z Services. All Rights Reserved. Developed and managed by ZUCOL.