Regression Analysis of Franchise Sales
VerifiedAdded on 2020/03/23
|13
|1702
|31
AI Summary
This assignment focuses on analyzing the factors influencing the net annual sales of a franchise using regression analysis. Students build a multiple linear regression model incorporating variables like store size, inventory, advertising expenditure, district size, and competition. They interpret the model coefficients, assess statistical significance, and apply the model to forecast the estimated net annual sales for a specific franchisee based on provided data.
Contribute Materials
Your contribution can guide someone’s learning journey. Share your
documents today.

Student Name:
Partner(s) Name:
Course:
Professor Name:
Due Date:
HI6007 - Group Assignment
Partner(s) Name:
Course:
Professor Name:
Due Date:
HI6007 - Group Assignment
Secure Best Marks with AI Grader
Need help grading? Try our AI Grader for instant feedback on your assignments.
1
Task 1
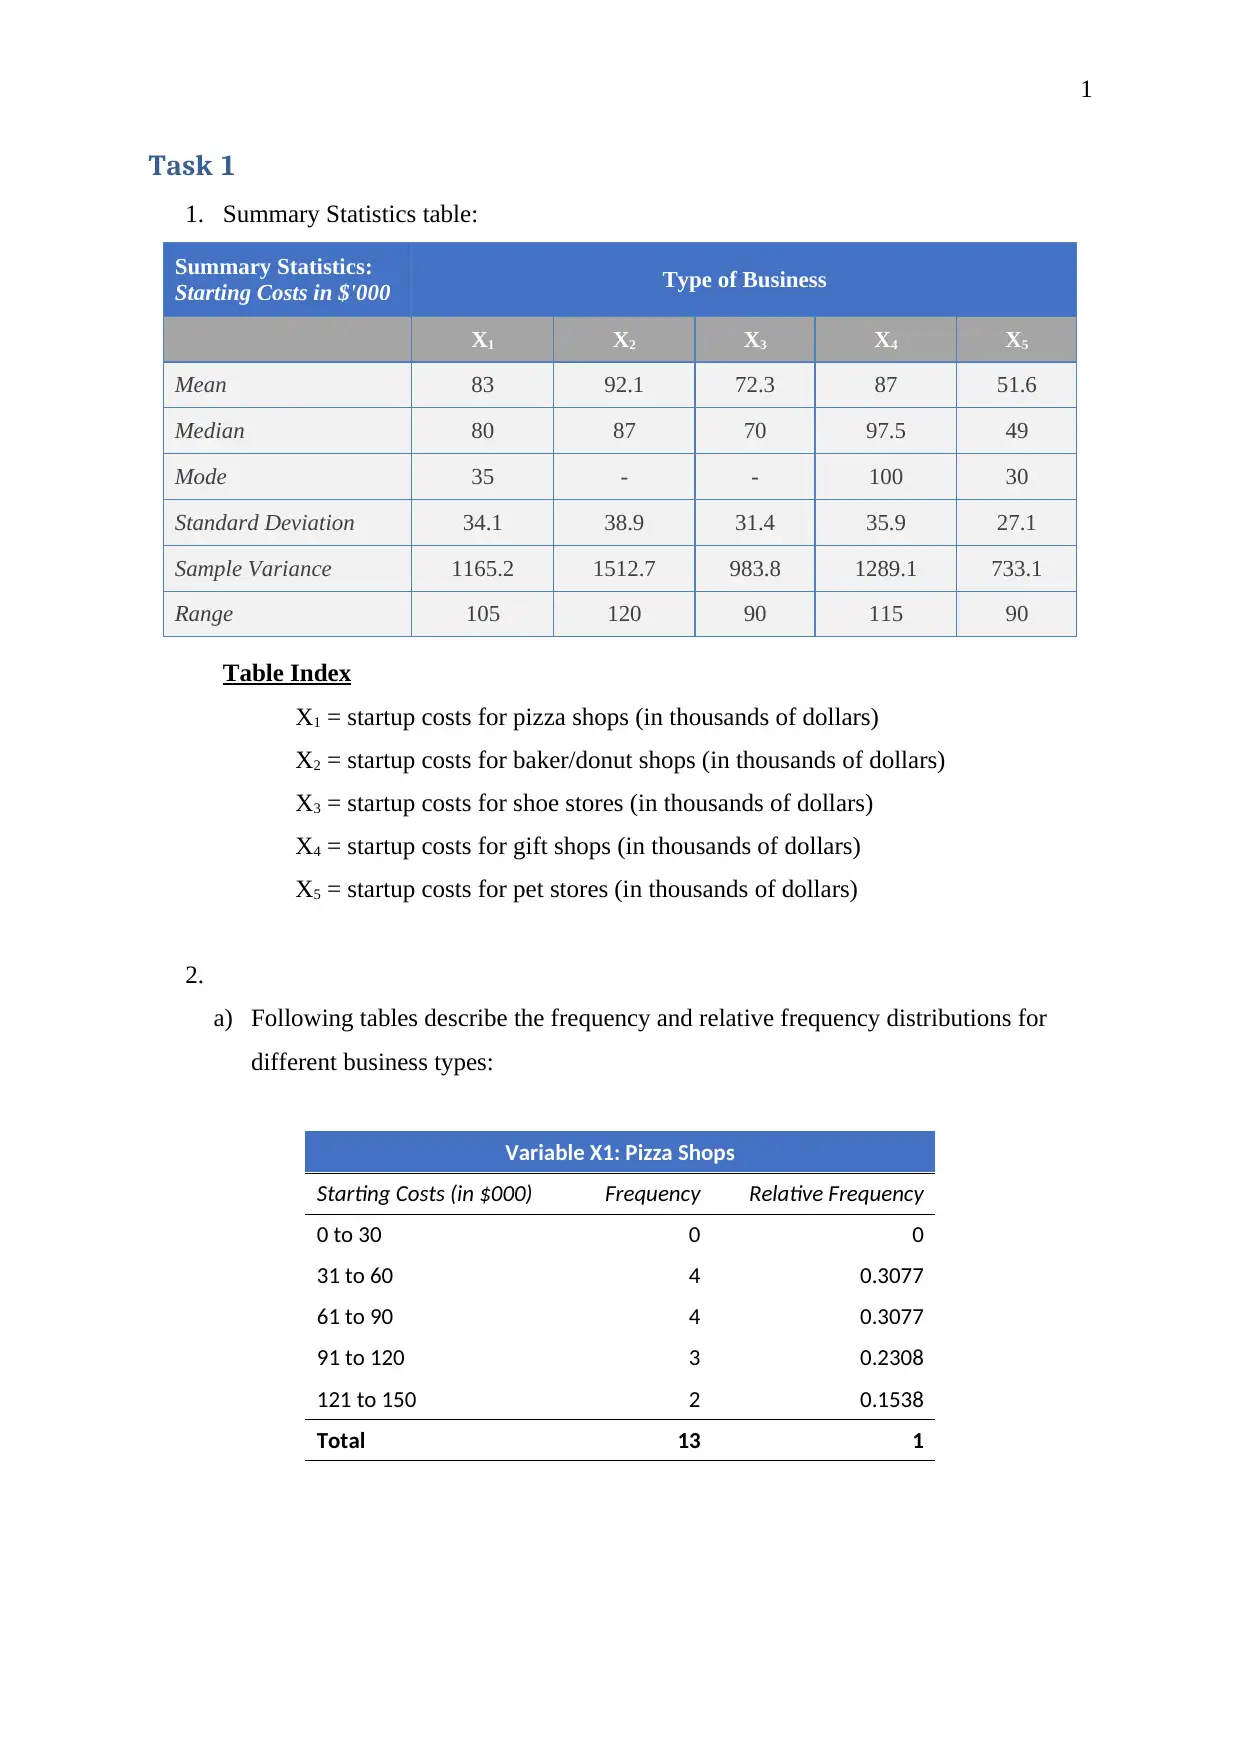
1. Summary Statistics table:
Summary Statistics:
Starting Costs in $'000 Type of Business
X1 X2 X3 X4 X5
Mean 83 92.1 72.3 87 51.6
Median 80 87 70 97.5 49
Mode 35 - - 100 30
Standard Deviation 34.1 38.9 31.4 35.9 27.1
Sample Variance 1165.2 1512.7 983.8 1289.1 733.1
Range 105 120 90 115 90
Table Index
X1 = startup costs for pizza shops (in thousands of dollars)
X2 = startup costs for baker/donut shops (in thousands of dollars)
X3 = startup costs for shoe stores (in thousands of dollars)
X4 = startup costs for gift shops (in thousands of dollars)
X5 = startup costs for pet stores (in thousands of dollars)
2.
a) Following tables describe the frequency and relative frequency distributions for
different business types:
Variable X1: Pizza Shops
Starting Costs (in $000) Frequency Relative Frequency
0 to 30 0 0
31 to 60 4 0.3077
61 to 90 4 0.3077
91 to 120 3 0.2308
121 to 150 2 0.1538
Total 13 1
Task 1
1. Summary Statistics table:
Summary Statistics:
Starting Costs in $'000 Type of Business
X1 X2 X3 X4 X5
Mean 83 92.1 72.3 87 51.6
Median 80 87 70 97.5 49
Mode 35 - - 100 30
Standard Deviation 34.1 38.9 31.4 35.9 27.1
Sample Variance 1165.2 1512.7 983.8 1289.1 733.1
Range 105 120 90 115 90
Table Index
X1 = startup costs for pizza shops (in thousands of dollars)
X2 = startup costs for baker/donut shops (in thousands of dollars)
X3 = startup costs for shoe stores (in thousands of dollars)
X4 = startup costs for gift shops (in thousands of dollars)
X5 = startup costs for pet stores (in thousands of dollars)
2.
a) Following tables describe the frequency and relative frequency distributions for
different business types:
Variable X1: Pizza Shops
Starting Costs (in $000) Frequency Relative Frequency
0 to 30 0 0
31 to 60 4 0.3077
61 to 90 4 0.3077
91 to 120 3 0.2308
121 to 150 2 0.1538
Total 13 1

2
Variable X2: Baker or Donuts Shops
Starting Costs (in $000) Frequency Relative Frequency
0 to 30 0 0
31 to 60 3 0.2727
61 to 90 4 0.3636
91 to 120 2 0.1818
121 to 150 1 0.0909
151 to 180 1 0.0909
Total 11 1
Variable X3: Shoe Store
Starting Costs (in $000) Frequency Relative Frequency
0 to 30 0 0
31 to 60 4 0.4
61 to 90 3 0.3
91 to 120 2 0.2
121 to 150 1 0.1
Total 10 1
Variable X4: Gift Shop
Starting Costs (in $000) Frequency Relative Frequency
0 to 30 0 0
31 to 60 3 0.3
61 to 90 1 0.1
91 to 120 5 0.5
121 to 150 1 0.1
Total 10 1
3
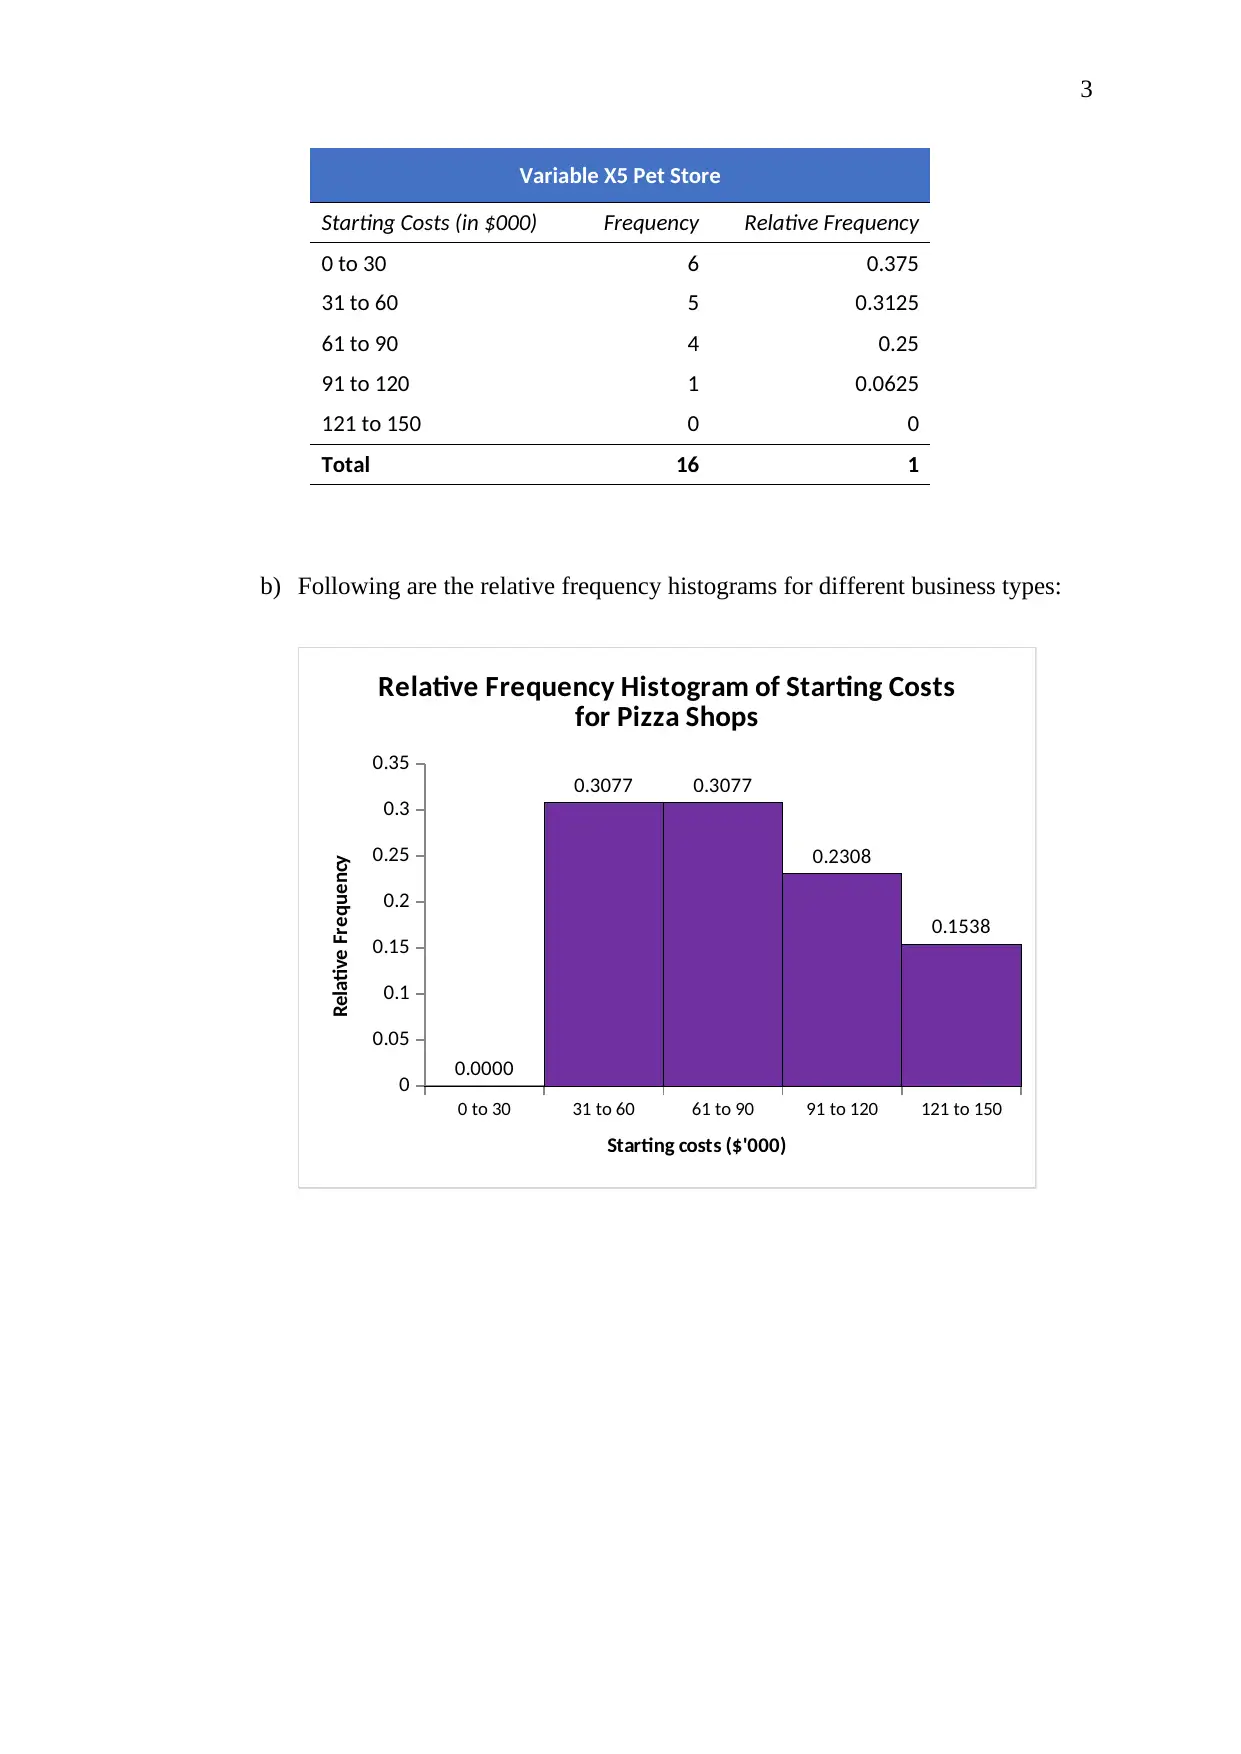
Variable X5 Pet Store
Starting Costs (in $000) Frequency Relative Frequency
0 to 30 6 0.375
31 to 60 5 0.3125
61 to 90 4 0.25
91 to 120 1 0.0625
121 to 150 0 0
Total 16 1
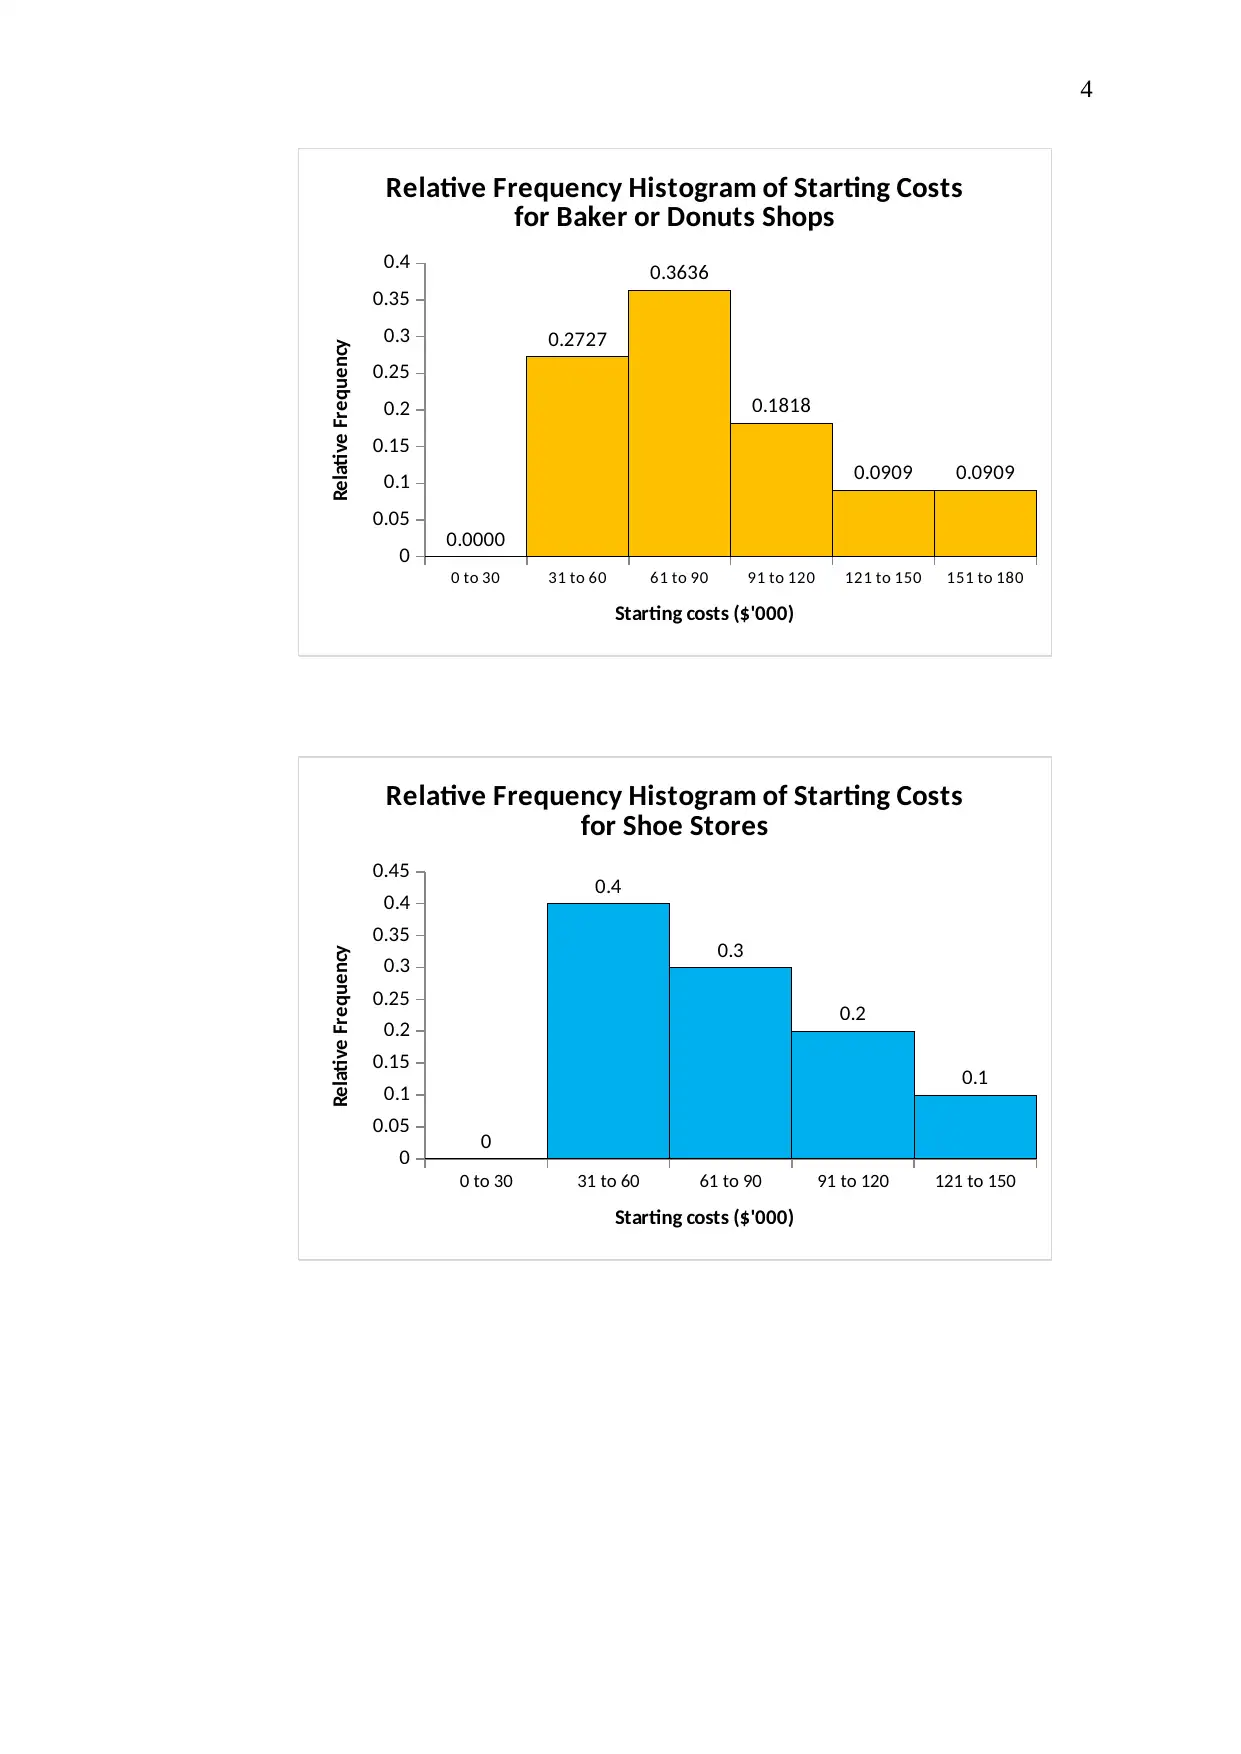
b) Following are the relative frequency histograms for different business types:
0 to 30 31 to 60 61 to 90 91 to 120 121 to 150
0
0.05
0.1
0.15
0.2
0.25
0.3
0.35
0.0000
0.3077 0.3077
0.2308
0.1538
Relative Frequency Histogram of Starting Costs
for Pizza Shops
Starting costs ($'000)
Relative Frequency
Variable X5 Pet Store
Starting Costs (in $000) Frequency Relative Frequency
0 to 30 6 0.375
31 to 60 5 0.3125
61 to 90 4 0.25
91 to 120 1 0.0625
121 to 150 0 0
Total 16 1
b) Following are the relative frequency histograms for different business types:
0 to 30 31 to 60 61 to 90 91 to 120 121 to 150
0
0.05
0.1
0.15
0.2
0.25
0.3
0.35
0.0000
0.3077 0.3077
0.2308
0.1538
Relative Frequency Histogram of Starting Costs
for Pizza Shops
Starting costs ($'000)
Relative Frequency
Secure Best Marks with AI Grader
Need help grading? Try our AI Grader for instant feedback on your assignments.
4
0 to 30 31 to 60 61 to 90 91 to 120 121 to 150 151 to 180
0
0.05
0.1
0.15
0.2
0.25
0.3
0.35
0.4
0.0000
0.2727
0.3636
0.1818
0.0909 0.0909
Relative Frequency Histogram of Starting Costs
for Baker or Donuts Shops
Starting costs ($'000)
Relative Frequency
0 to 30 31 to 60 61 to 90 91 to 120 121 to 150
0
0.05
0.1
0.15
0.2
0.25
0.3
0.35
0.4
0.45
0
0.4
0.3
0.2
0.1
Relative Frequency Histogram of Starting Costs
for Shoe Stores
Starting costs ($'000)
Relative Frequency
5
0 to 30 31 to 60 61 to 90 91 to 120 121 to 150
0
0.1
0.2
0.3
0.4
0.5
0.6
0
0.3
0.1
0.5
0.1
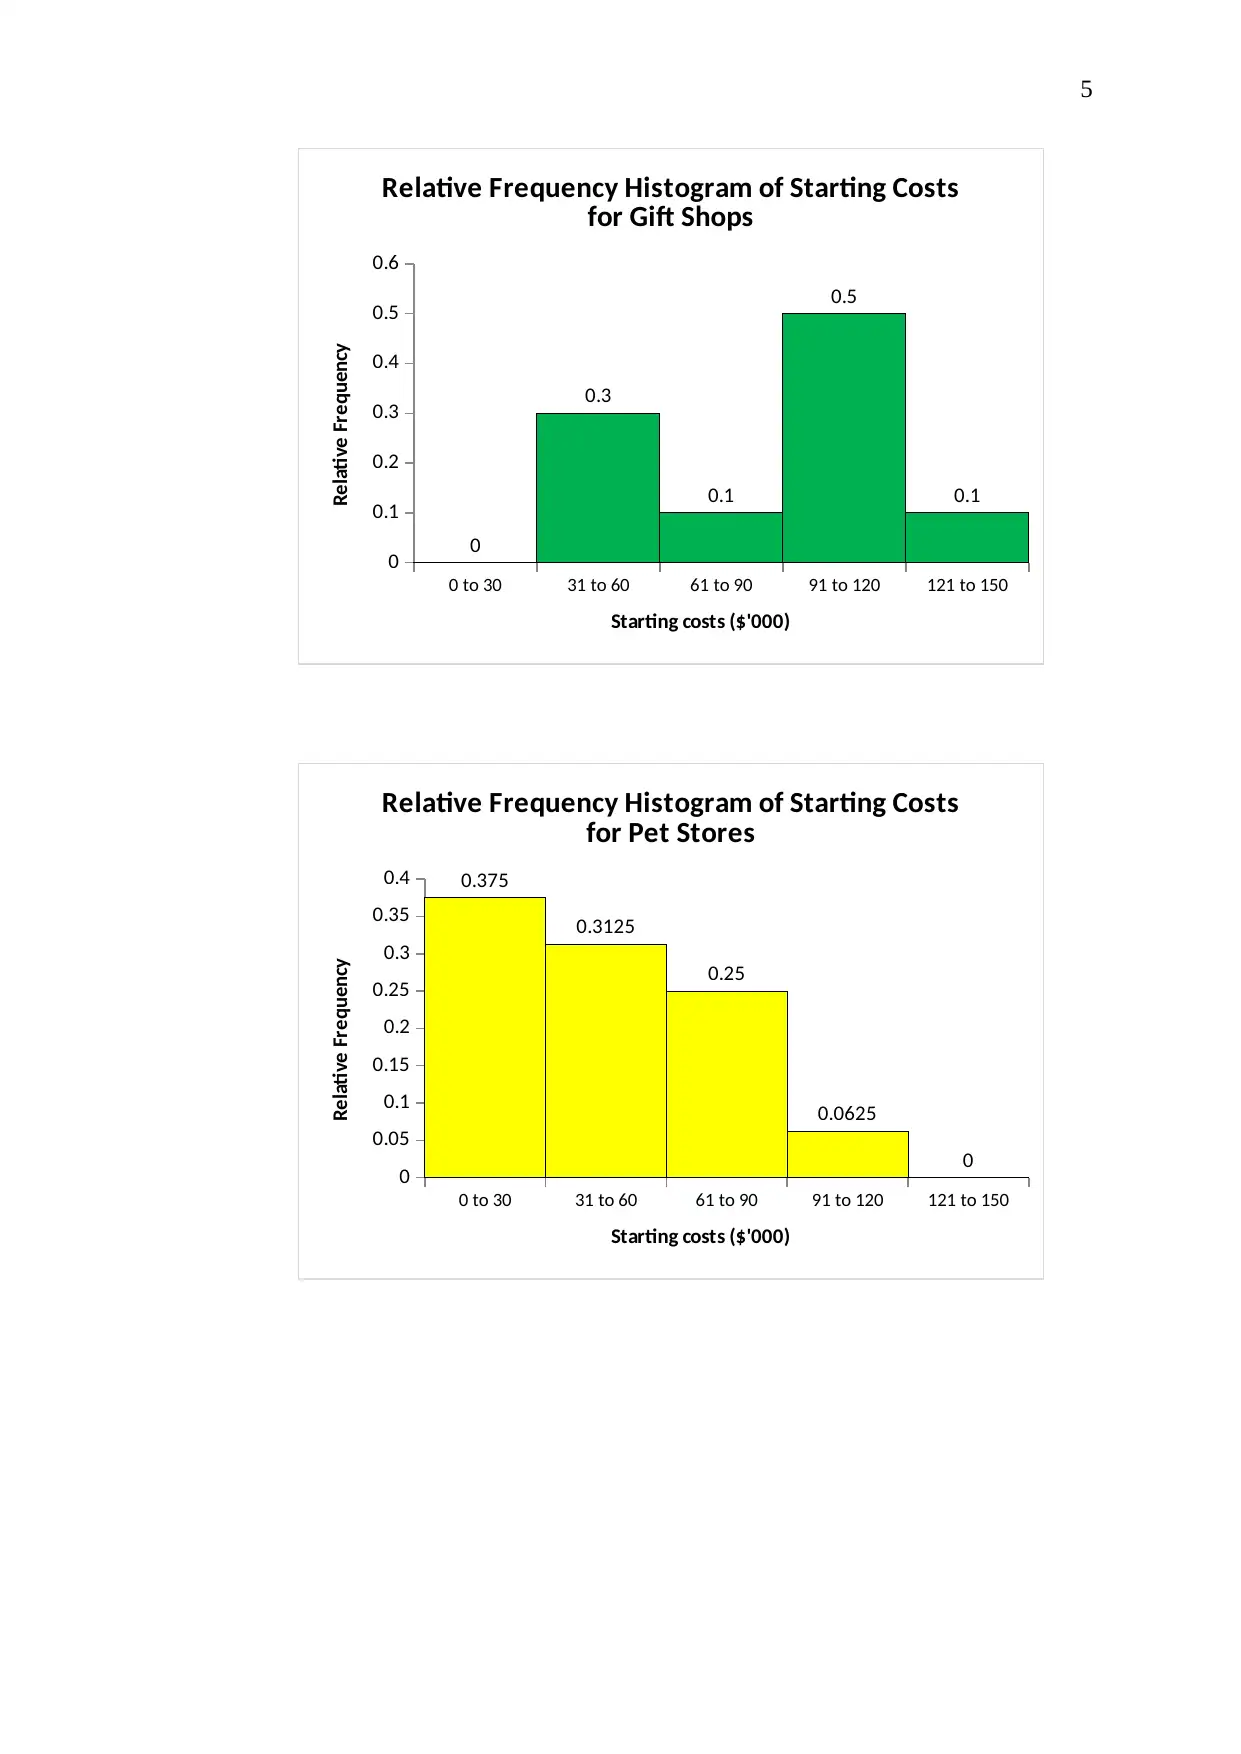
Relative Frequency Histogram of Starting Costs
for Gift Shops
Starting costs ($'000)
Relative Frequency
0 to 30 31 to 60 61 to 90 91 to 120 121 to 150
0
0.05
0.1
0.15
0.2
0.25
0.3
0.35
0.4 0.375
0.3125
0.25
0.0625
0
Relative Frequency Histogram of Starting Costs
for Pet Stores
Starting costs ($'000)
Relative Frequency
0 to 30 31 to 60 61 to 90 91 to 120 121 to 150
0
0.1
0.2
0.3
0.4
0.5
0.6
0
0.3
0.1
0.5
0.1
Relative Frequency Histogram of Starting Costs
for Gift Shops
Starting costs ($'000)
Relative Frequency
0 to 30 31 to 60 61 to 90 91 to 120 121 to 150
0
0.05
0.1
0.15
0.2
0.25
0.3
0.35
0.4 0.375
0.3125
0.25
0.0625
0
Relative Frequency Histogram of Starting Costs
for Pet Stores
Starting costs ($'000)
Relative Frequency
6
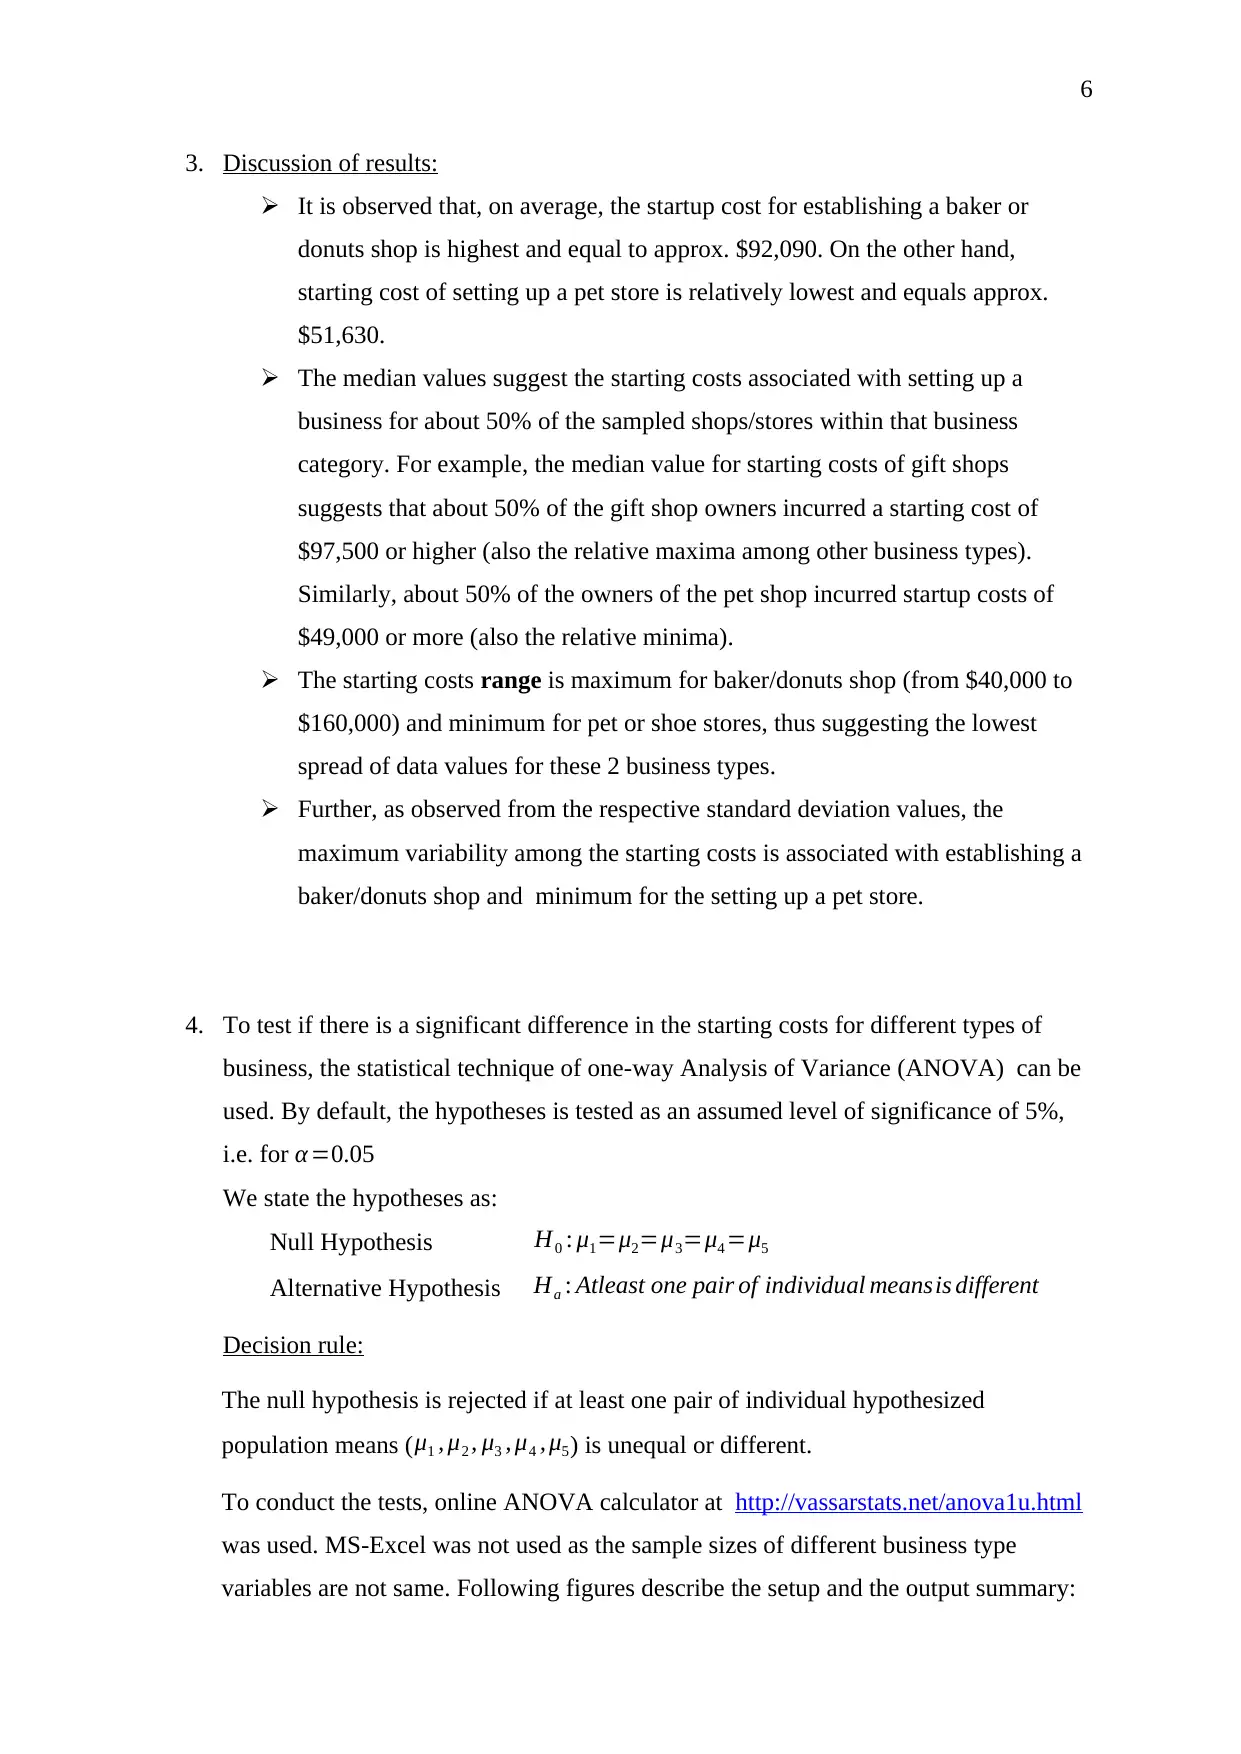
3. Discussion of results:
It is observed that, on average, the startup cost for establishing a baker or
donuts shop is highest and equal to approx. $92,090. On the other hand,
starting cost of setting up a pet store is relatively lowest and equals approx.
$51,630.
The median values suggest the starting costs associated with setting up a
business for about 50% of the sampled shops/stores within that business
category. For example, the median value for starting costs of gift shops
suggests that about 50% of the gift shop owners incurred a starting cost of
$97,500 or higher (also the relative maxima among other business types).
Similarly, about 50% of the owners of the pet shop incurred startup costs of
$49,000 or more (also the relative minima).
The starting costs range is maximum for baker/donuts shop (from $40,000 to
$160,000) and minimum for pet or shoe stores, thus suggesting the lowest
spread of data values for these 2 business types.
Further, as observed from the respective standard deviation values, the
maximum variability among the starting costs is associated with establishing a
baker/donuts shop and minimum for the setting up a pet store.
4. To test if there is a significant difference in the starting costs for different types of
business, the statistical technique of one-way Analysis of Variance (ANOVA) can be
used. By default, the hypotheses is tested as an assumed level of significance of 5%,
i.e. for α =0.05
We state the hypotheses as:
Null Hypothesis H0 : μ1=μ2=μ3=μ4 =μ5
Alternative Hypothesis Ha : Atleast one pair of individual meansis different
Decision rule:
The null hypothesis is rejected if at least one pair of individual hypothesized
population means (μ1 , μ2 , μ3 , μ4 , μ5) is unequal or different.
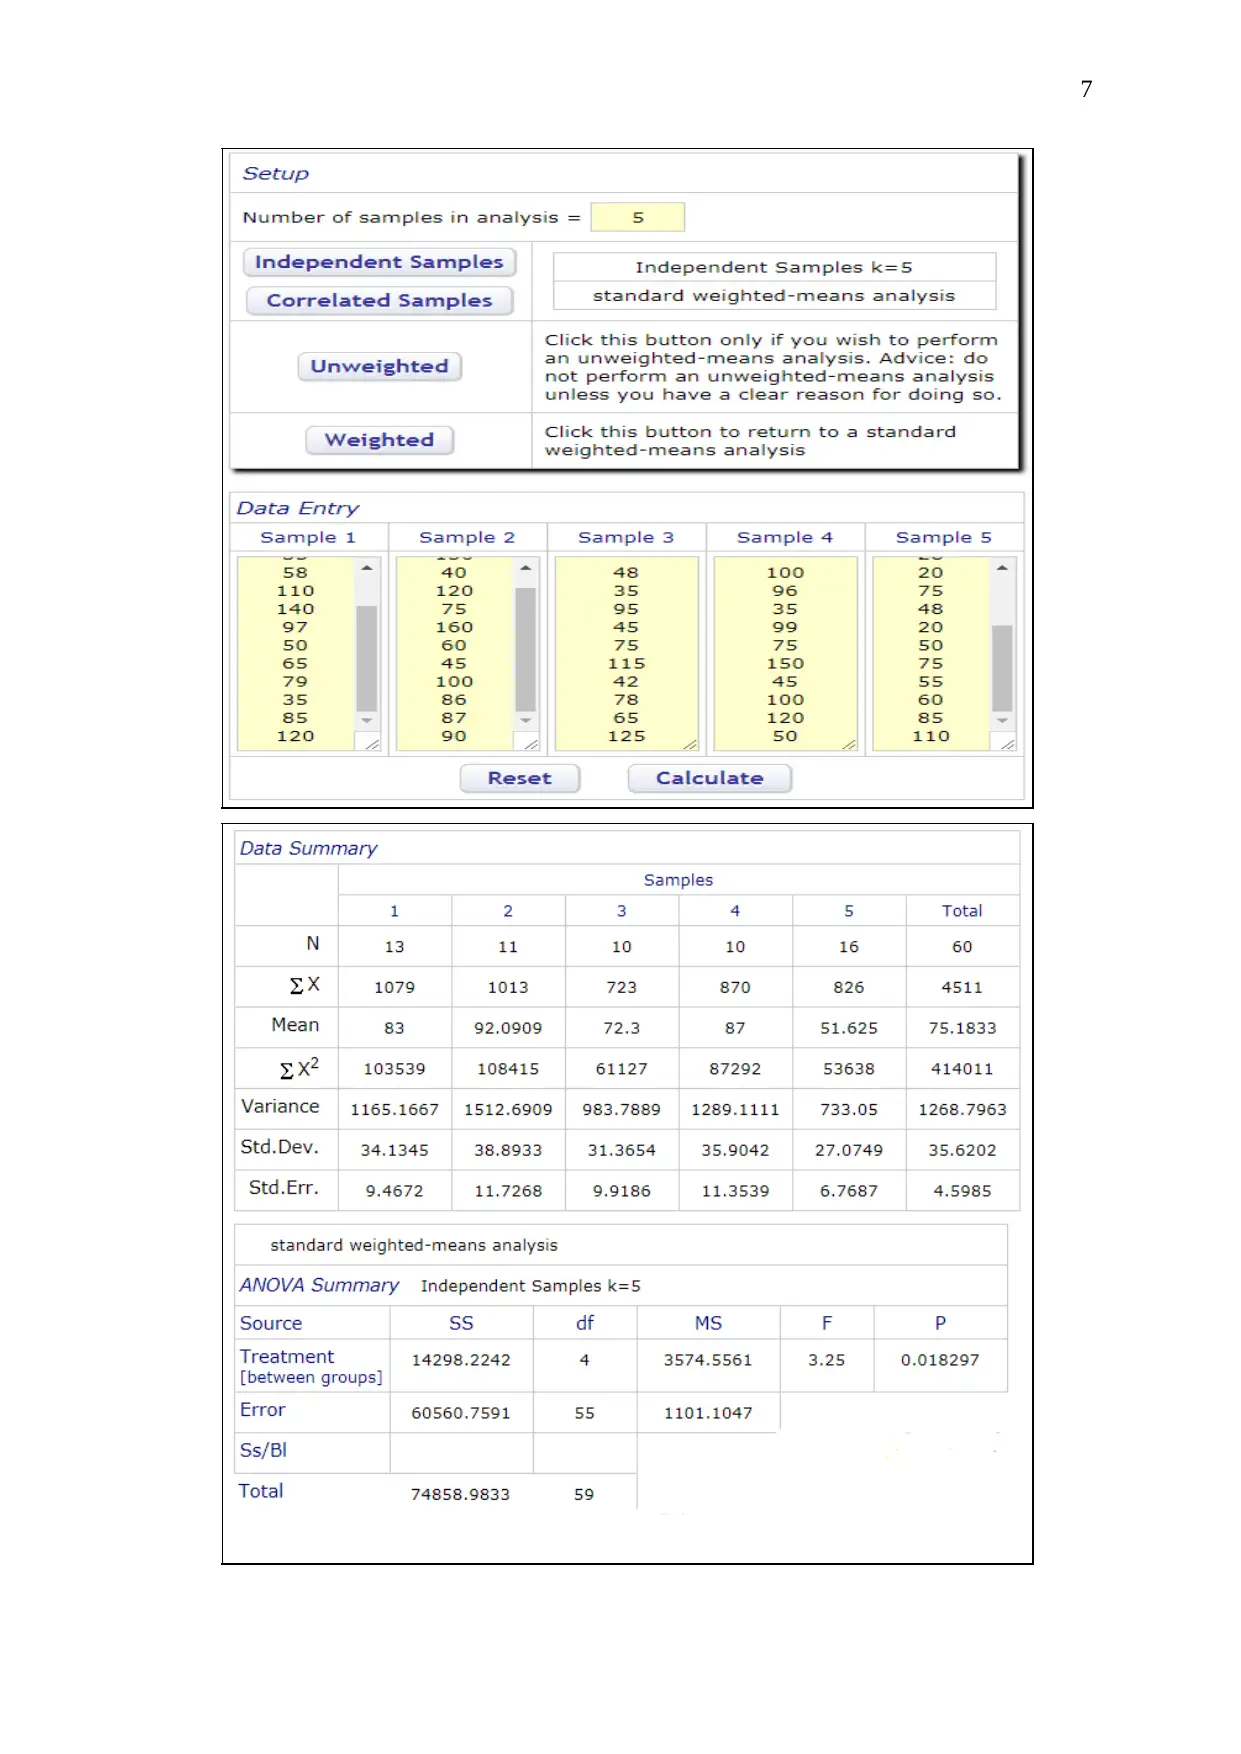
To conduct the tests, online ANOVA calculator at http://vassarstats.net/anova1u.html
was used. MS-Excel was not used as the sample sizes of different business type
variables are not same. Following figures describe the setup and the output summary:
3. Discussion of results:
It is observed that, on average, the startup cost for establishing a baker or
donuts shop is highest and equal to approx. $92,090. On the other hand,
starting cost of setting up a pet store is relatively lowest and equals approx.
$51,630.
The median values suggest the starting costs associated with setting up a
business for about 50% of the sampled shops/stores within that business
category. For example, the median value for starting costs of gift shops
suggests that about 50% of the gift shop owners incurred a starting cost of
$97,500 or higher (also the relative maxima among other business types).
Similarly, about 50% of the owners of the pet shop incurred startup costs of
$49,000 or more (also the relative minima).
The starting costs range is maximum for baker/donuts shop (from $40,000 to
$160,000) and minimum for pet or shoe stores, thus suggesting the lowest
spread of data values for these 2 business types.
Further, as observed from the respective standard deviation values, the
maximum variability among the starting costs is associated with establishing a
baker/donuts shop and minimum for the setting up a pet store.
4. To test if there is a significant difference in the starting costs for different types of
business, the statistical technique of one-way Analysis of Variance (ANOVA) can be
used. By default, the hypotheses is tested as an assumed level of significance of 5%,
i.e. for α =0.05
We state the hypotheses as:
Null Hypothesis H0 : μ1=μ2=μ3=μ4 =μ5
Alternative Hypothesis Ha : Atleast one pair of individual meansis different
Decision rule:
The null hypothesis is rejected if at least one pair of individual hypothesized
population means (μ1 , μ2 , μ3 , μ4 , μ5) is unequal or different.
To conduct the tests, online ANOVA calculator at http://vassarstats.net/anova1u.html
was used. MS-Excel was not used as the sample sizes of different business type
variables are not same. Following figures describe the setup and the output summary:
Paraphrase This Document
Need a fresh take? Get an instant paraphrase of this document with our AI Paraphraser
7
8
Comment:
As observed, the obtained p-value ¿ 0.0182.
This p-value value is less than the assumed significance level of 0.05, and therefore,
we reject the null hypothesis; concluding that at least one pair of individual means is
statistically different at α=0.05. In other words, it can be said that, on average, the
starting costs associated with different types of business are not equal.
Note: To determine which of the individual means pair is different or has unequal
means, additional tests will be required. However, that is not relevant to this question.
Task 2
1. Excel Output:
SUMMARY OUTPUT
Regression Statistics
Multiple R 0.9966
R Square 0.9932
Adjusted R Square 0.9916
Standard Error 17.65
Observations 27
ANOVA
df SS MS F Significance F
Regression 5 952538.9 190507.8 611.590 0.0000
Residual 21 6541.4 311.5
Total 26 959080.4
Coefficients Standard Error t Stat P-value Lower 95% Upper 95%
Intercept -18.86 30.15 -0.626 0.5384 -81.56 43.84
X2 16.20 3.54 4.571 0.0002 8.83 23.57
X3 0.17 0.06 3.032 0.0063 0.05 0.29
X4 11.53 2.53 4.552 0.0002 6.26 16.79
X5 13.58 1.77 7.671 0.0000 9.90 17.26
X6 -5.31 1.71 -3.114 0.0052 -8.86 -1.76
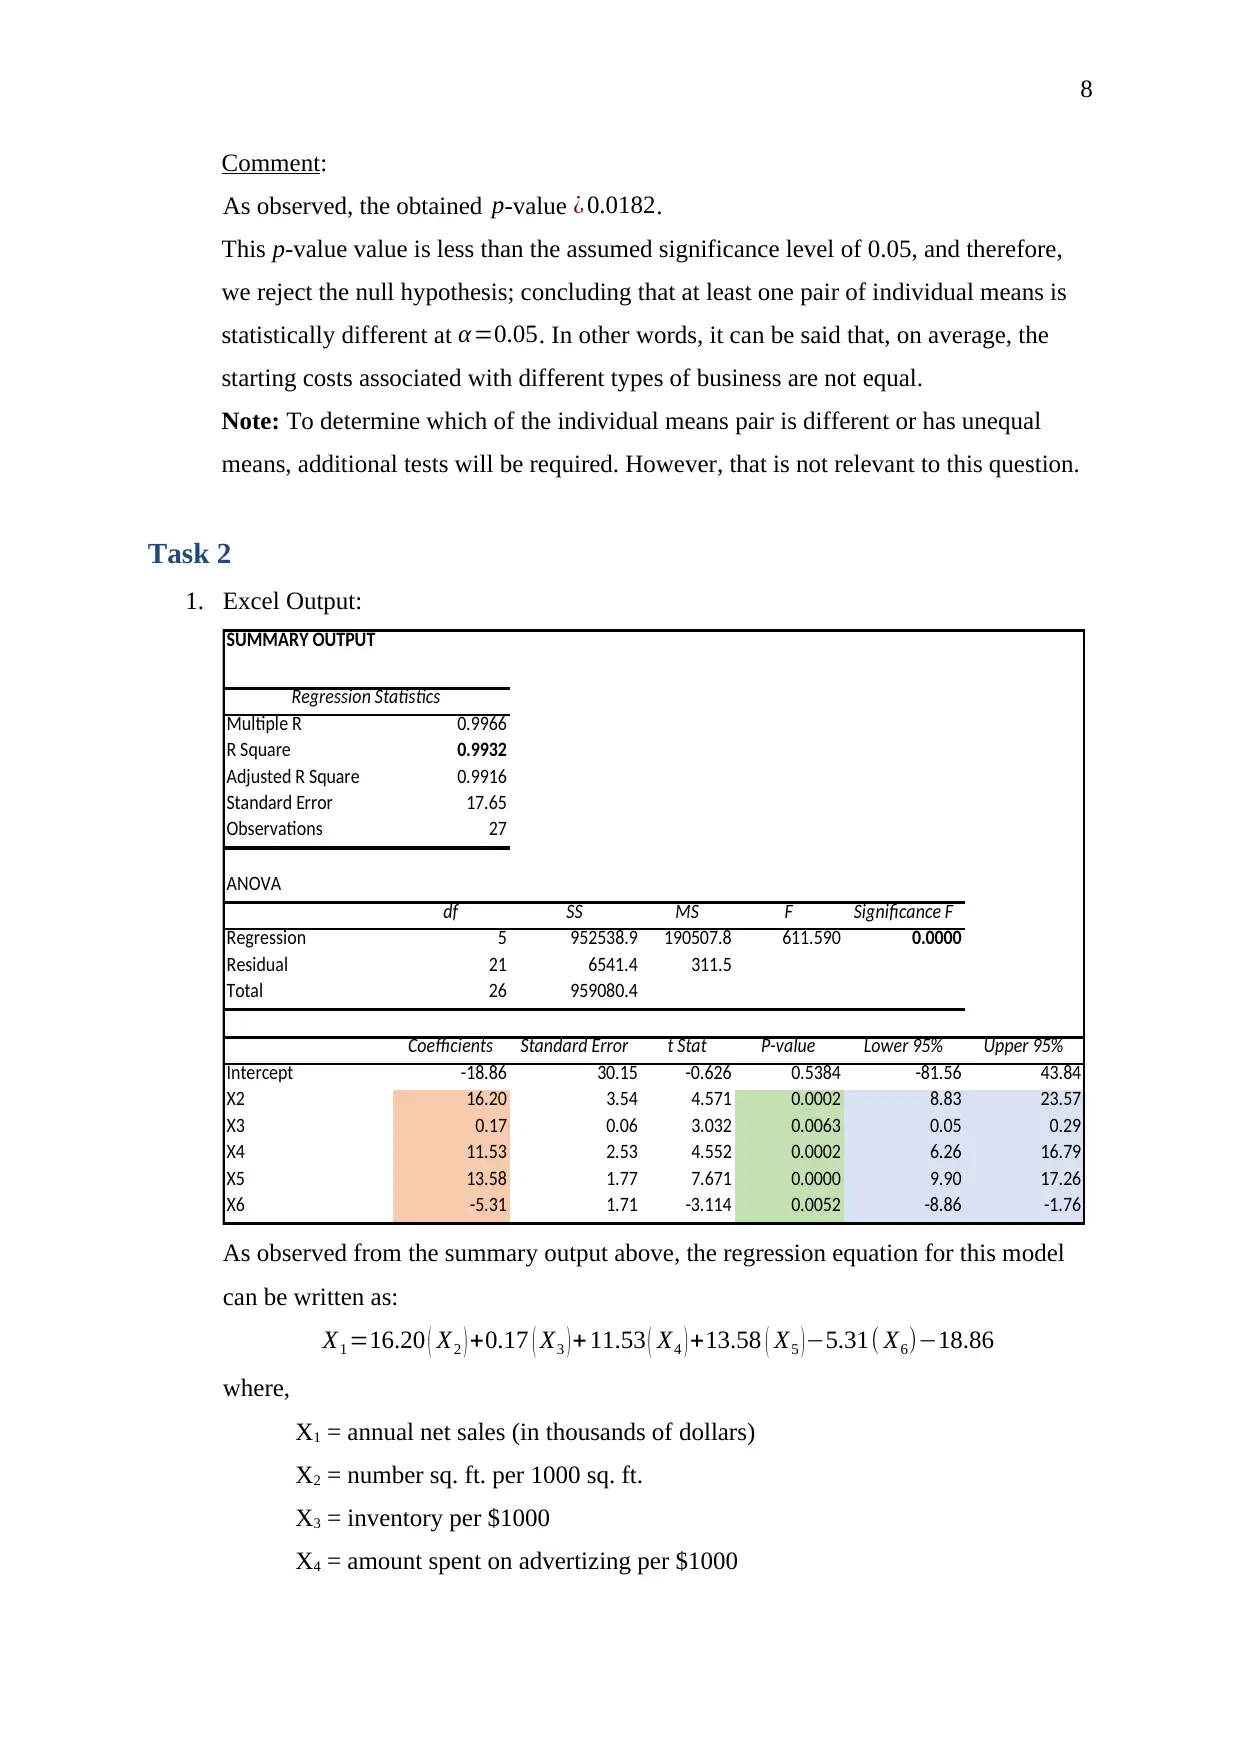
As observed from the summary output above, the regression equation for this model
can be written as:
X1 =16.20 ( X2 ) +0.17 ( X3 ) + 11.53 ( X4 ) +13.58 ( X5 )−5.31( X6)−18.86
where,
X1 = annual net sales (in thousands of dollars)
X2 = number sq. ft. per 1000 sq. ft.
X3 = inventory per $1000
X4 = amount spent on advertizing per $1000
Comment:
As observed, the obtained p-value ¿ 0.0182.
This p-value value is less than the assumed significance level of 0.05, and therefore,
we reject the null hypothesis; concluding that at least one pair of individual means is
statistically different at α=0.05. In other words, it can be said that, on average, the
starting costs associated with different types of business are not equal.
Note: To determine which of the individual means pair is different or has unequal
means, additional tests will be required. However, that is not relevant to this question.
Task 2
1. Excel Output:
SUMMARY OUTPUT
Regression Statistics
Multiple R 0.9966
R Square 0.9932
Adjusted R Square 0.9916
Standard Error 17.65
Observations 27
ANOVA
df SS MS F Significance F
Regression 5 952538.9 190507.8 611.590 0.0000
Residual 21 6541.4 311.5
Total 26 959080.4
Coefficients Standard Error t Stat P-value Lower 95% Upper 95%
Intercept -18.86 30.15 -0.626 0.5384 -81.56 43.84
X2 16.20 3.54 4.571 0.0002 8.83 23.57
X3 0.17 0.06 3.032 0.0063 0.05 0.29
X4 11.53 2.53 4.552 0.0002 6.26 16.79
X5 13.58 1.77 7.671 0.0000 9.90 17.26
X6 -5.31 1.71 -3.114 0.0052 -8.86 -1.76
As observed from the summary output above, the regression equation for this model
can be written as:
X1 =16.20 ( X2 ) +0.17 ( X3 ) + 11.53 ( X4 ) +13.58 ( X5 )−5.31( X6)−18.86
where,
X1 = annual net sales (in thousands of dollars)
X2 = number sq. ft. per 1000 sq. ft.
X3 = inventory per $1000
X4 = amount spent on advertizing per $1000
9
X5 = size of sales district per 1000 families
X6 = number of competing stores in the district
2. The coefficient of determination R2 value of 0.9932 suggests that about 99.32% of the
variation in the dependent variable X1 (annual net sales) can be explained by the above
regression model. Therefore, overall, the model is an ‘excellent’ fit and can be used to
appropriately predict the annual net sales (computed in thousands of dollars).
3. To test if there is ‘no’ significant relationship between the dependent and any of the
independent variables, a Fisher’s F-test was performed at an assumed significance
level of 5%, i.e. for α=0.05
The hypotheses are stated as:
Null Hypothesis H0 :The regression model is insignificant
Alternative Hypothesis Ha : The regression model is significant
Comment:
As observed form the summary output above, the computed Sig. F or the p-value is
equal to 0.000, which is less than the assumed significance level of 0.05. Therefore,
we reject the null hypothesis, thus concluding that the obtained regression model is
statistically significant at α =0.05. In other words, it can be said that there is a
significant relationship between the dependent variable X1 and other independent
variables.
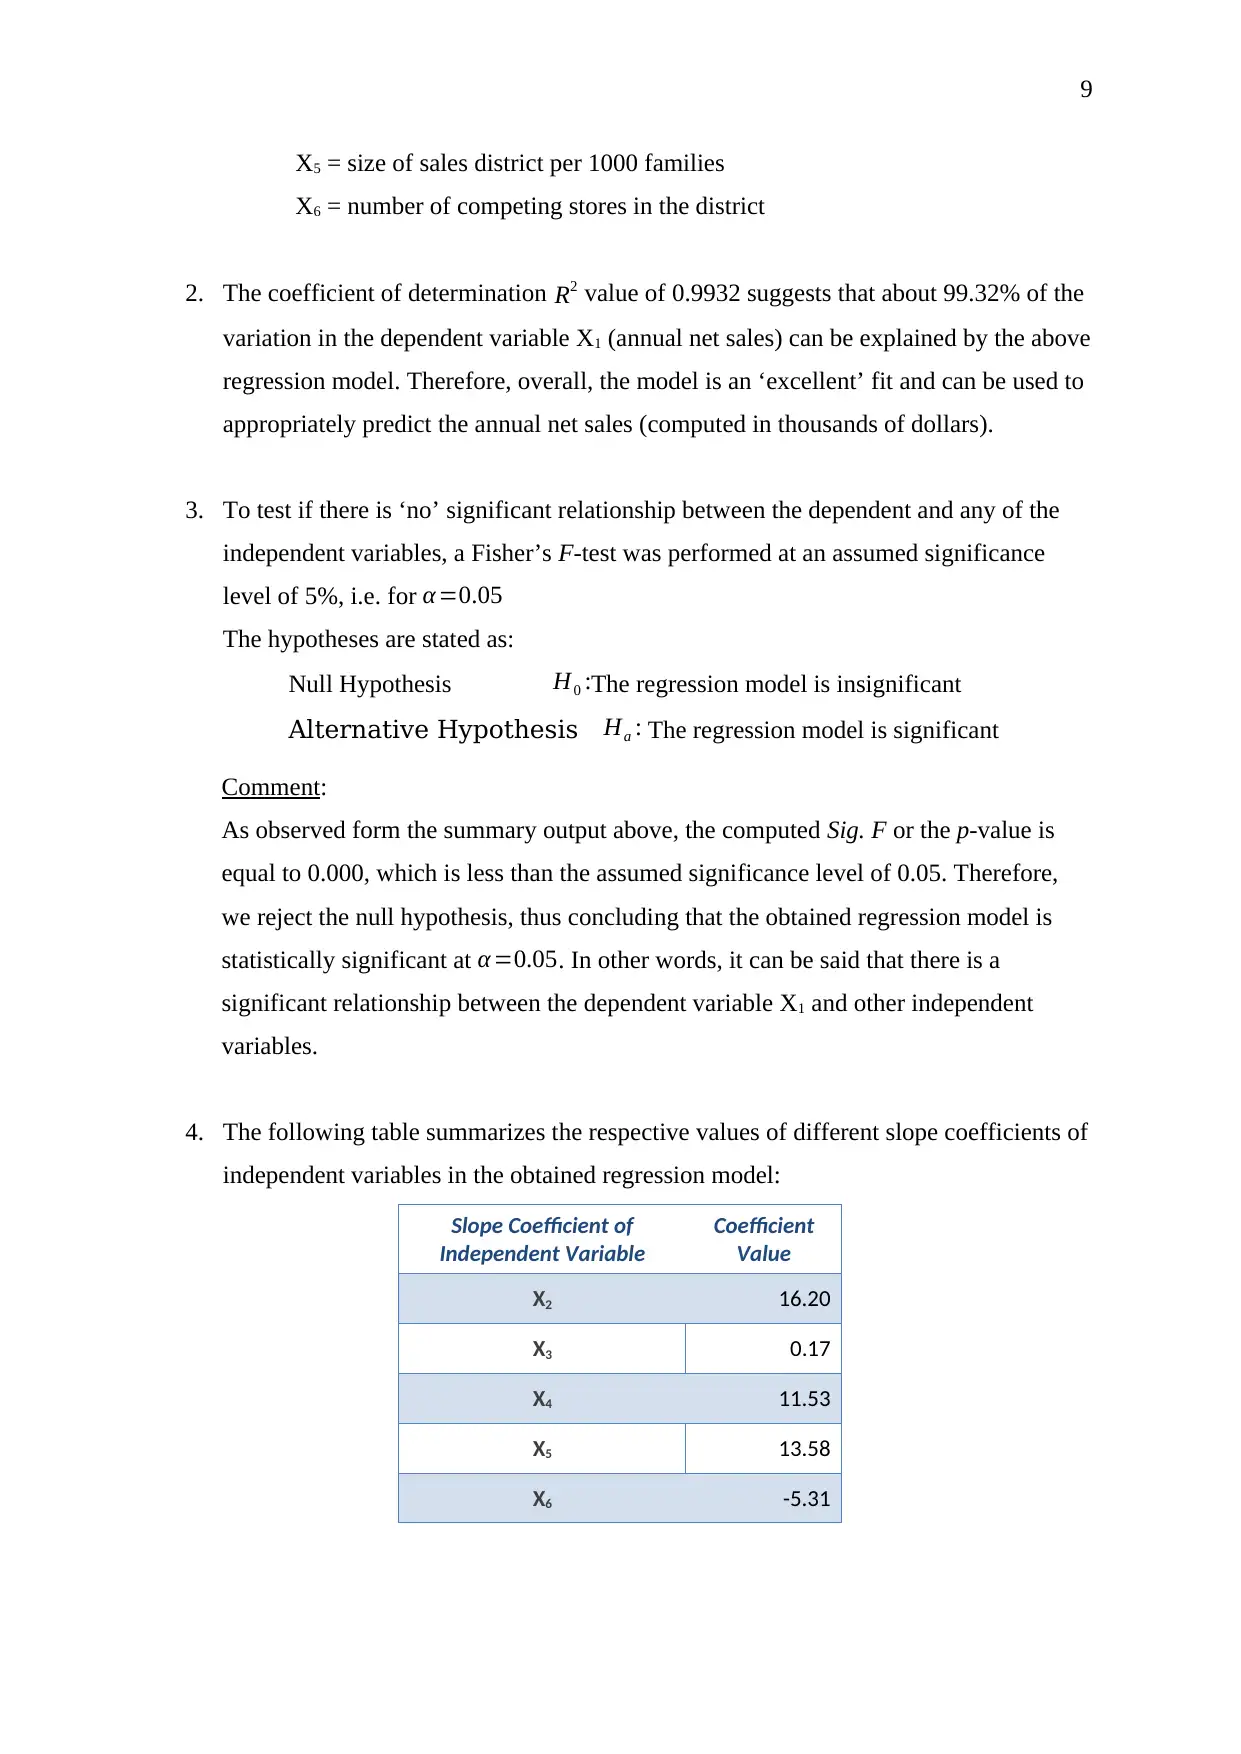
4. The following table summarizes the respective values of different slope coefficients of
independent variables in the obtained regression model:
Slope Coefficient of
Independent Variable
Coefficient
Value
X2 16.20
X3 0.17
X4 11.53
X5 13.58
X6 -5.31
X5 = size of sales district per 1000 families
X6 = number of competing stores in the district
2. The coefficient of determination R2 value of 0.9932 suggests that about 99.32% of the
variation in the dependent variable X1 (annual net sales) can be explained by the above
regression model. Therefore, overall, the model is an ‘excellent’ fit and can be used to
appropriately predict the annual net sales (computed in thousands of dollars).
3. To test if there is ‘no’ significant relationship between the dependent and any of the
independent variables, a Fisher’s F-test was performed at an assumed significance
level of 5%, i.e. for α=0.05
The hypotheses are stated as:
Null Hypothesis H0 :The regression model is insignificant
Alternative Hypothesis Ha : The regression model is significant
Comment:
As observed form the summary output above, the computed Sig. F or the p-value is
equal to 0.000, which is less than the assumed significance level of 0.05. Therefore,
we reject the null hypothesis, thus concluding that the obtained regression model is
statistically significant at α =0.05. In other words, it can be said that there is a
significant relationship between the dependent variable X1 and other independent
variables.
4. The following table summarizes the respective values of different slope coefficients of
independent variables in the obtained regression model:
Slope Coefficient of
Independent Variable
Coefficient
Value
X2 16.20
X3 0.17
X4 11.53
X5 13.58
X6 -5.31
Secure Best Marks with AI Grader
Need help grading? Try our AI Grader for instant feedback on your assignments.
10
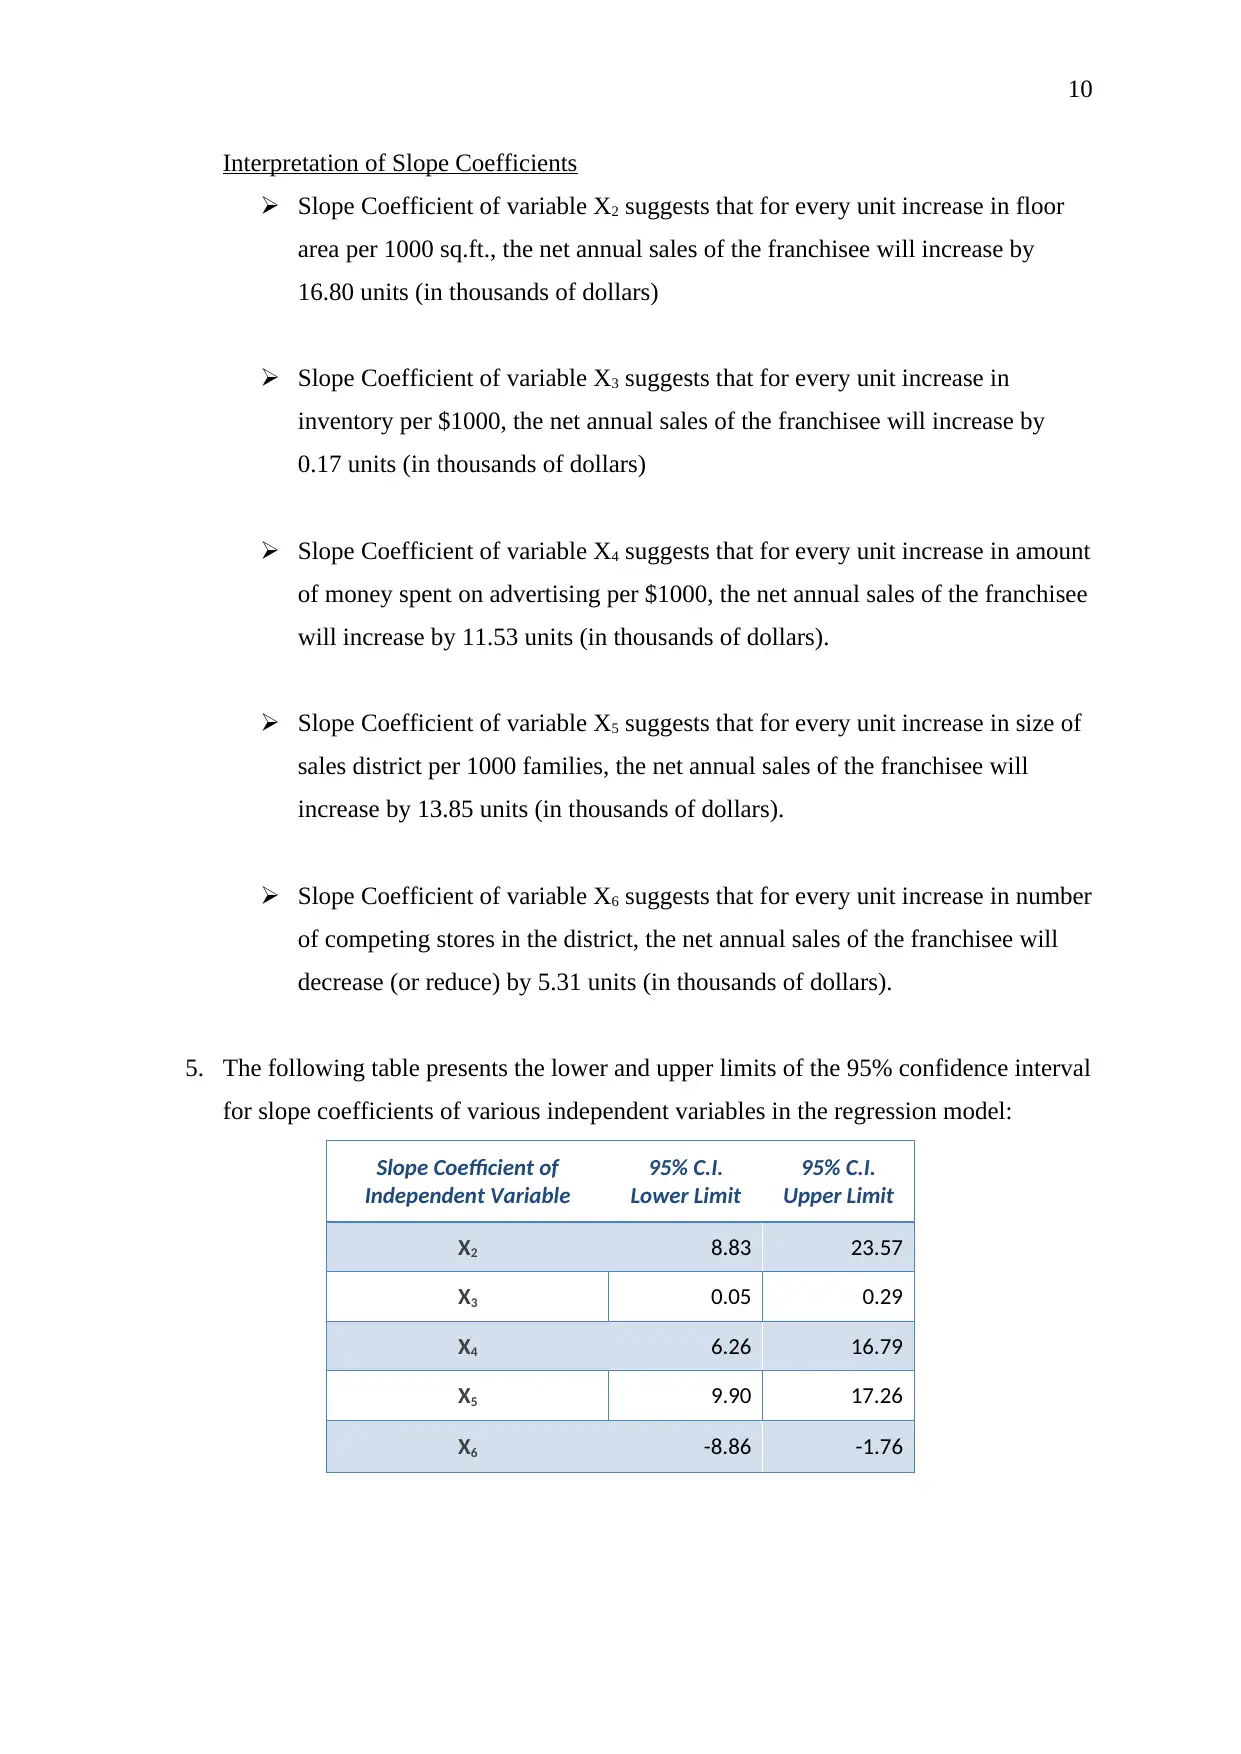
Interpretation of Slope Coefficients
Slope Coefficient of variable X2 suggests that for every unit increase in floor
area per 1000 sq.ft., the net annual sales of the franchisee will increase by
16.80 units (in thousands of dollars)
Slope Coefficient of variable X3 suggests that for every unit increase in
inventory per $1000, the net annual sales of the franchisee will increase by
0.17 units (in thousands of dollars)
Slope Coefficient of variable X4 suggests that for every unit increase in amount
of money spent on advertising per $1000, the net annual sales of the franchisee
will increase by 11.53 units (in thousands of dollars).
Slope Coefficient of variable X5 suggests that for every unit increase in size of
sales district per 1000 families, the net annual sales of the franchisee will
increase by 13.85 units (in thousands of dollars).
Slope Coefficient of variable X6 suggests that for every unit increase in number
of competing stores in the district, the net annual sales of the franchisee will
decrease (or reduce) by 5.31 units (in thousands of dollars).
5. The following table presents the lower and upper limits of the 95% confidence interval
for slope coefficients of various independent variables in the regression model:
Slope Coefficient of
Independent Variable
95% C.I.
Lower Limit
95% C.I.
Upper Limit
X2 8.83 23.57
X3 0.05 0.29
X4 6.26 16.79
X5 9.90 17.26
X6 -8.86 -1.76
11
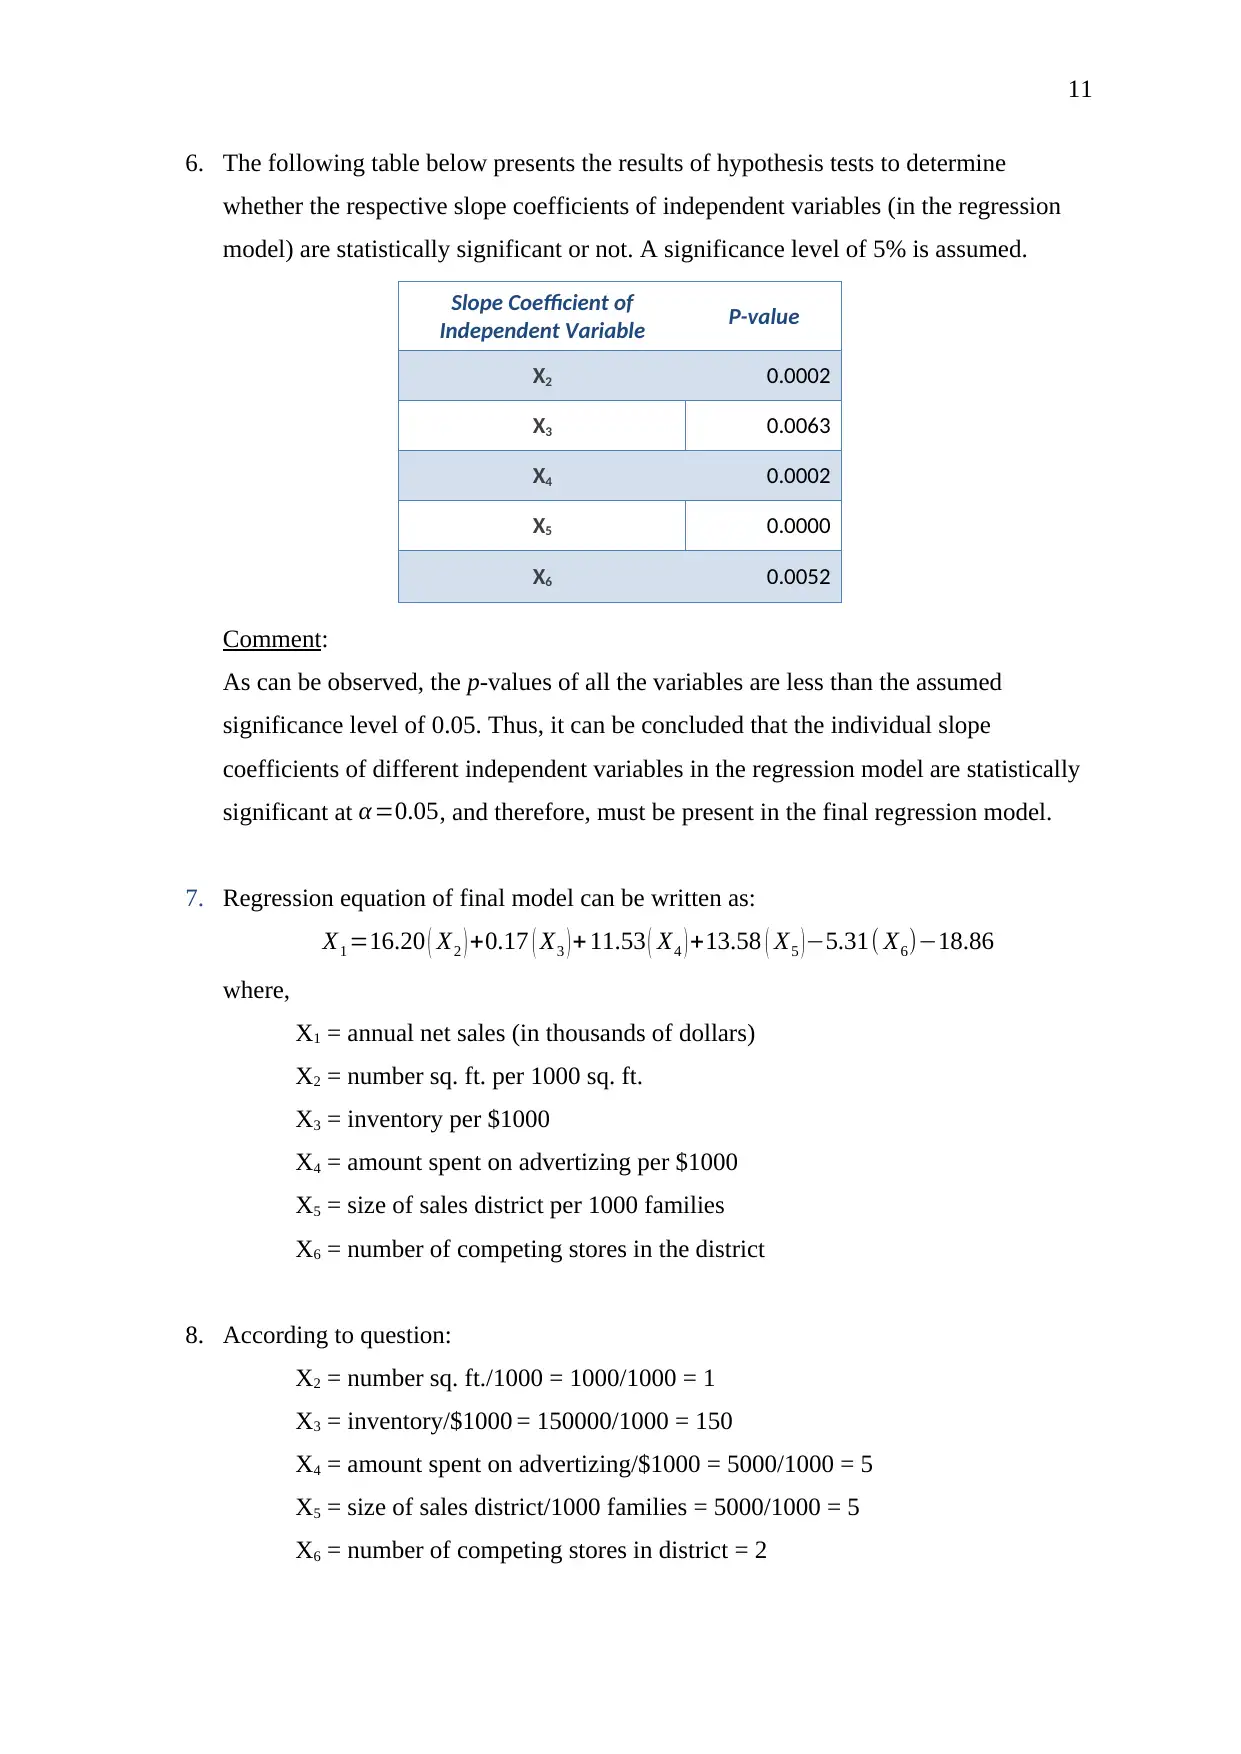
6. The following table below presents the results of hypothesis tests to determine
whether the respective slope coefficients of independent variables (in the regression
model) are statistically significant or not. A significance level of 5% is assumed.
Slope Coefficient of
Independent Variable P-value
X2 0.0002
X3 0.0063
X4 0.0002
X5 0.0000
X6 0.0052
Comment:
As can be observed, the p-values of all the variables are less than the assumed
significance level of 0.05. Thus, it can be concluded that the individual slope
coefficients of different independent variables in the regression model are statistically
significant at α=0.05, and therefore, must be present in the final regression model.
7. Regression equation of final model can be written as:
X1 =16.20 ( X2 ) +0.17 ( X3 ) + 11.53 ( X4 ) +13.58 ( X5 )−5.31( X6)−18.86
where,
X1 = annual net sales (in thousands of dollars)
X2 = number sq. ft. per 1000 sq. ft.
X3 = inventory per $1000
X4 = amount spent on advertizing per $1000
X5 = size of sales district per 1000 families
X6 = number of competing stores in the district
8. According to question:
X2 = number sq. ft./1000 = 1000/1000 = 1
X3 = inventory/$1000 = 150000/1000 = 150
X4 = amount spent on advertizing/$1000 = 5000/1000 = 5
X5 = size of sales district/1000 families = 5000/1000 = 5
X6 = number of competing stores in district = 2
12
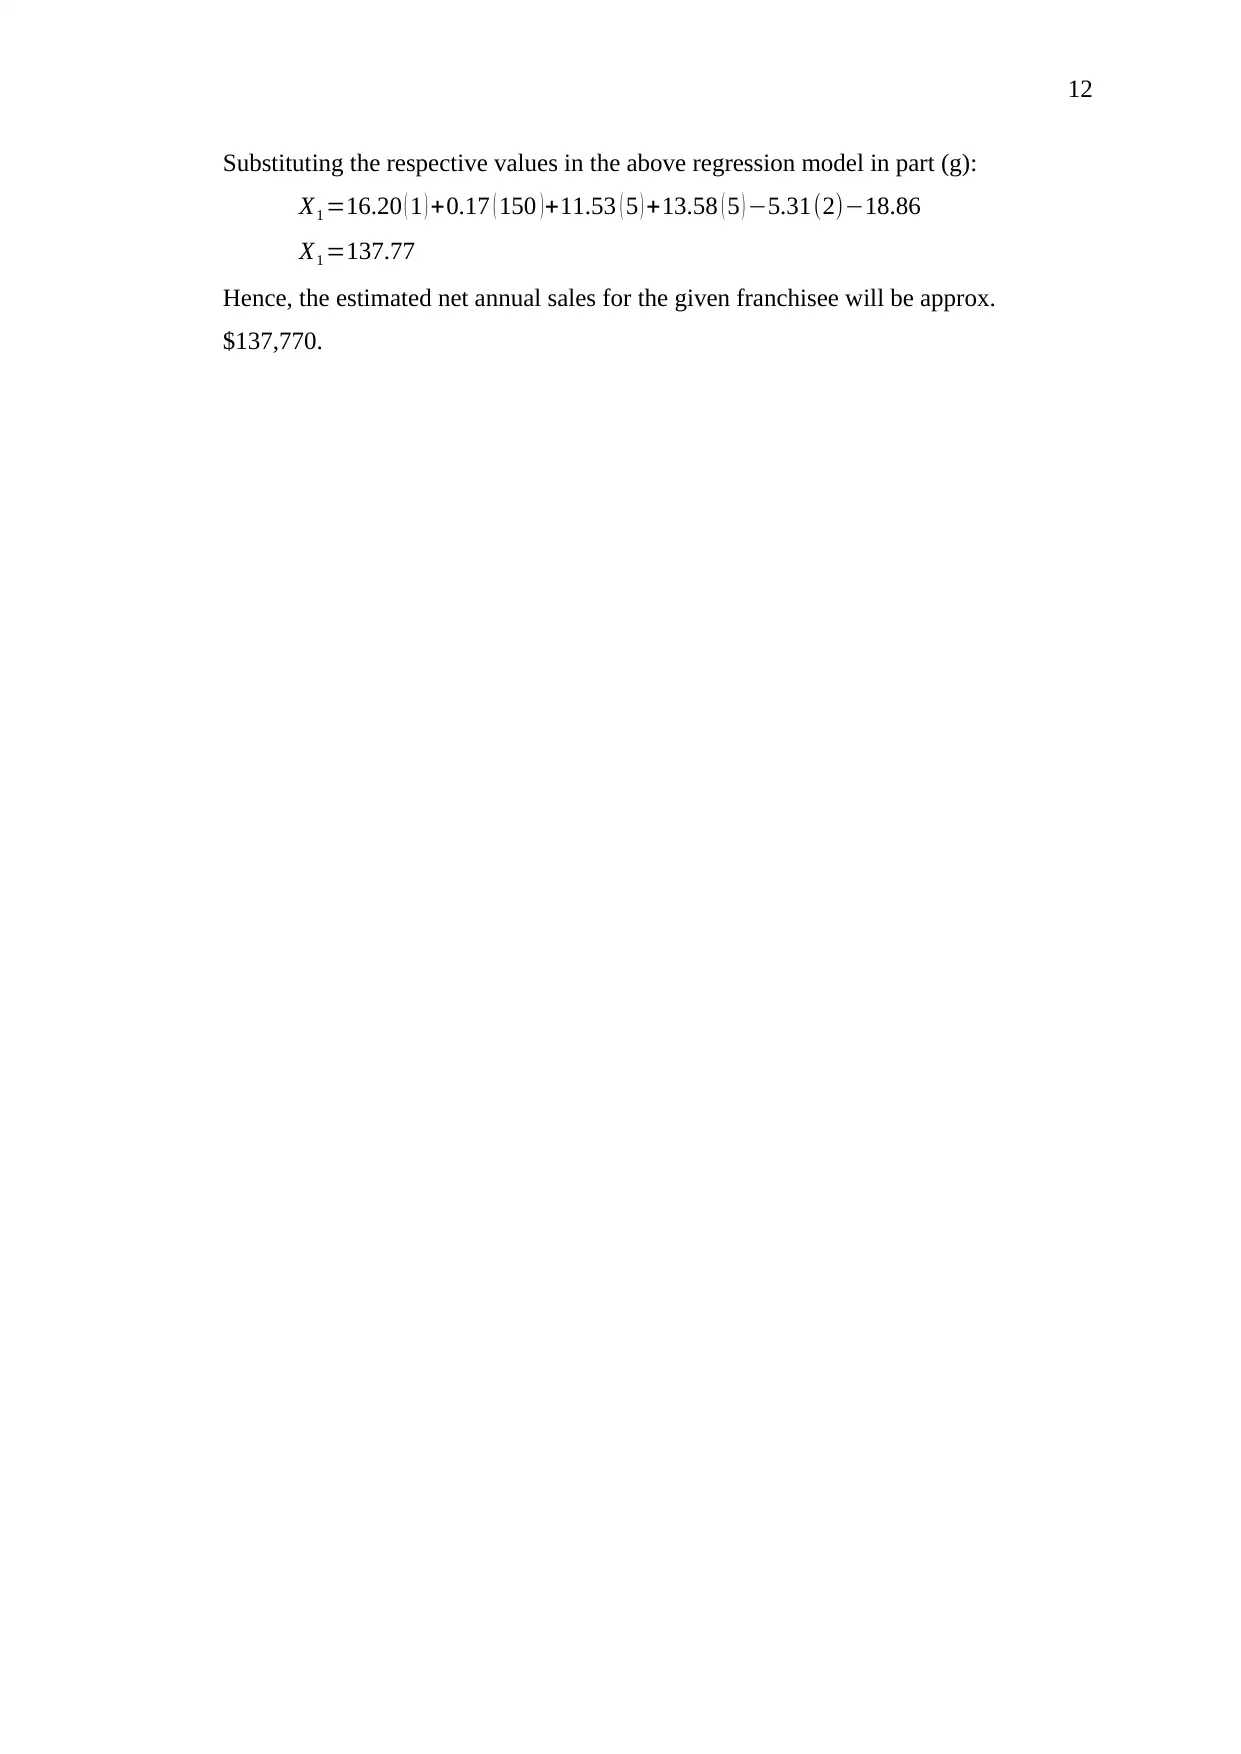
Substituting the respective values in the above regression model in part (g):
X1 =16.20 ( 1 ) +0.17 ( 150 )+11.53 ( 5 ) +13.58 ( 5 ) −5.31(2)−18.86
X1 =137.77
Hence, the estimated net annual sales for the given franchisee will be approx.
$137,770.
Substituting the respective values in the above regression model in part (g):
X1 =16.20 ( 1 ) +0.17 ( 150 )+11.53 ( 5 ) +13.58 ( 5 ) −5.31(2)−18.86
X1 =137.77
Hence, the estimated net annual sales for the given franchisee will be approx.
$137,770.
1 out of 13
Related Documents


Your All-in-One AI-Powered Toolkit for Academic Success.
+13062052269
info@desklib.com
Available 24*7 on WhatsApp / Email
![[object Object]](/_next/static/media/star-bottom.7253800d.svg)
Unlock your academic potential
© 2024 | Zucol Services PVT LTD | All rights reserved.