Student Housing Costs and Bond Amount Relationship
VerifiedAdded on 2020/03/16
|8
|1719
|43
AI Summary
This assignment examines the expenses associated with student housing in Sydney. It compares average weekly rent across different locations, highlighting the most expensive city. The analysis further investigates the relationship between bond amount and weekly rent, revealing a strong positive correlation using a correlation matrix.
Contribute Materials
Your contribution can guide someone’s learning journey. Share your
documents today.
Name
Student ID
Section 1: Introduction
On-campus living has been part and parcel of higher education in Australia ever since time immemorial
(Thelin, 2011). However, there as the saying goes “No road lacks a turning point”, things have taken a U-
turn beginning of the twentieth century. Much focus has been on offering academic services and not
accommodation. This has subsequently resulted to increase in cost of accessing education since
accommodation is part of acquiring education. It has therefore been a great concern of many students
seeking education in Australia to know the cost of accommodation in the surrounding area where the
university is located. This study therefore sought to analyze and compare the accommodation costs paid
by international students in four suburbs of Australia. We will utilize two datasets (dataset1 and datset2).
Dataset 1:
The dataset is a primary data that was collected among the international student living in four suburbs of
Australia. From each suburb, 24 respondents from each of the four suburbs (Sydney, Auburn, Randwick
and Parramatta) were interviewed. The respondents were chosen randomly from a registry of students that
was provided to the researcher by the registrar upon explaining to the registrar the reasons for the study.
Participants were asked three questions. The questions were; amount of rent the respondent paid, suburb
where they live and their gender.
Dataset 2:
Unlike dataset 1, dataset 2 is a secondary data that had been collected sometime back and stored for
purposes of analysis. The dataset has a total of 500 observations with six variables. There are 6 variables
in the dataset (four of the variables are numerical variables while two are categorical variables). The two
categorical variables are dwelling type and suburb. Bond amount, Weekly rent, number of bedrooms and
postcode are all numerical variables.
The first five cases of the dataset is shown in table 1 below;
Table 1: First five cases of dataset 2
BondAmoun
t
WeeklyRen
t
DwellingTyp
e
NumberBedroom
s
Postcod
e Suburb
2200.00 550.00 House 4 2144 AUBURN
1960.00 490.00 House 2 2144 AUBURN
2080.00 520.00 Flat 2 2144 AUBURN
2400.00 600.00 House 4 2144 AUBURN
1600.00 400.00 Flat 2 2144 AUBURN
Section 2: International Students’ Weekly Rent
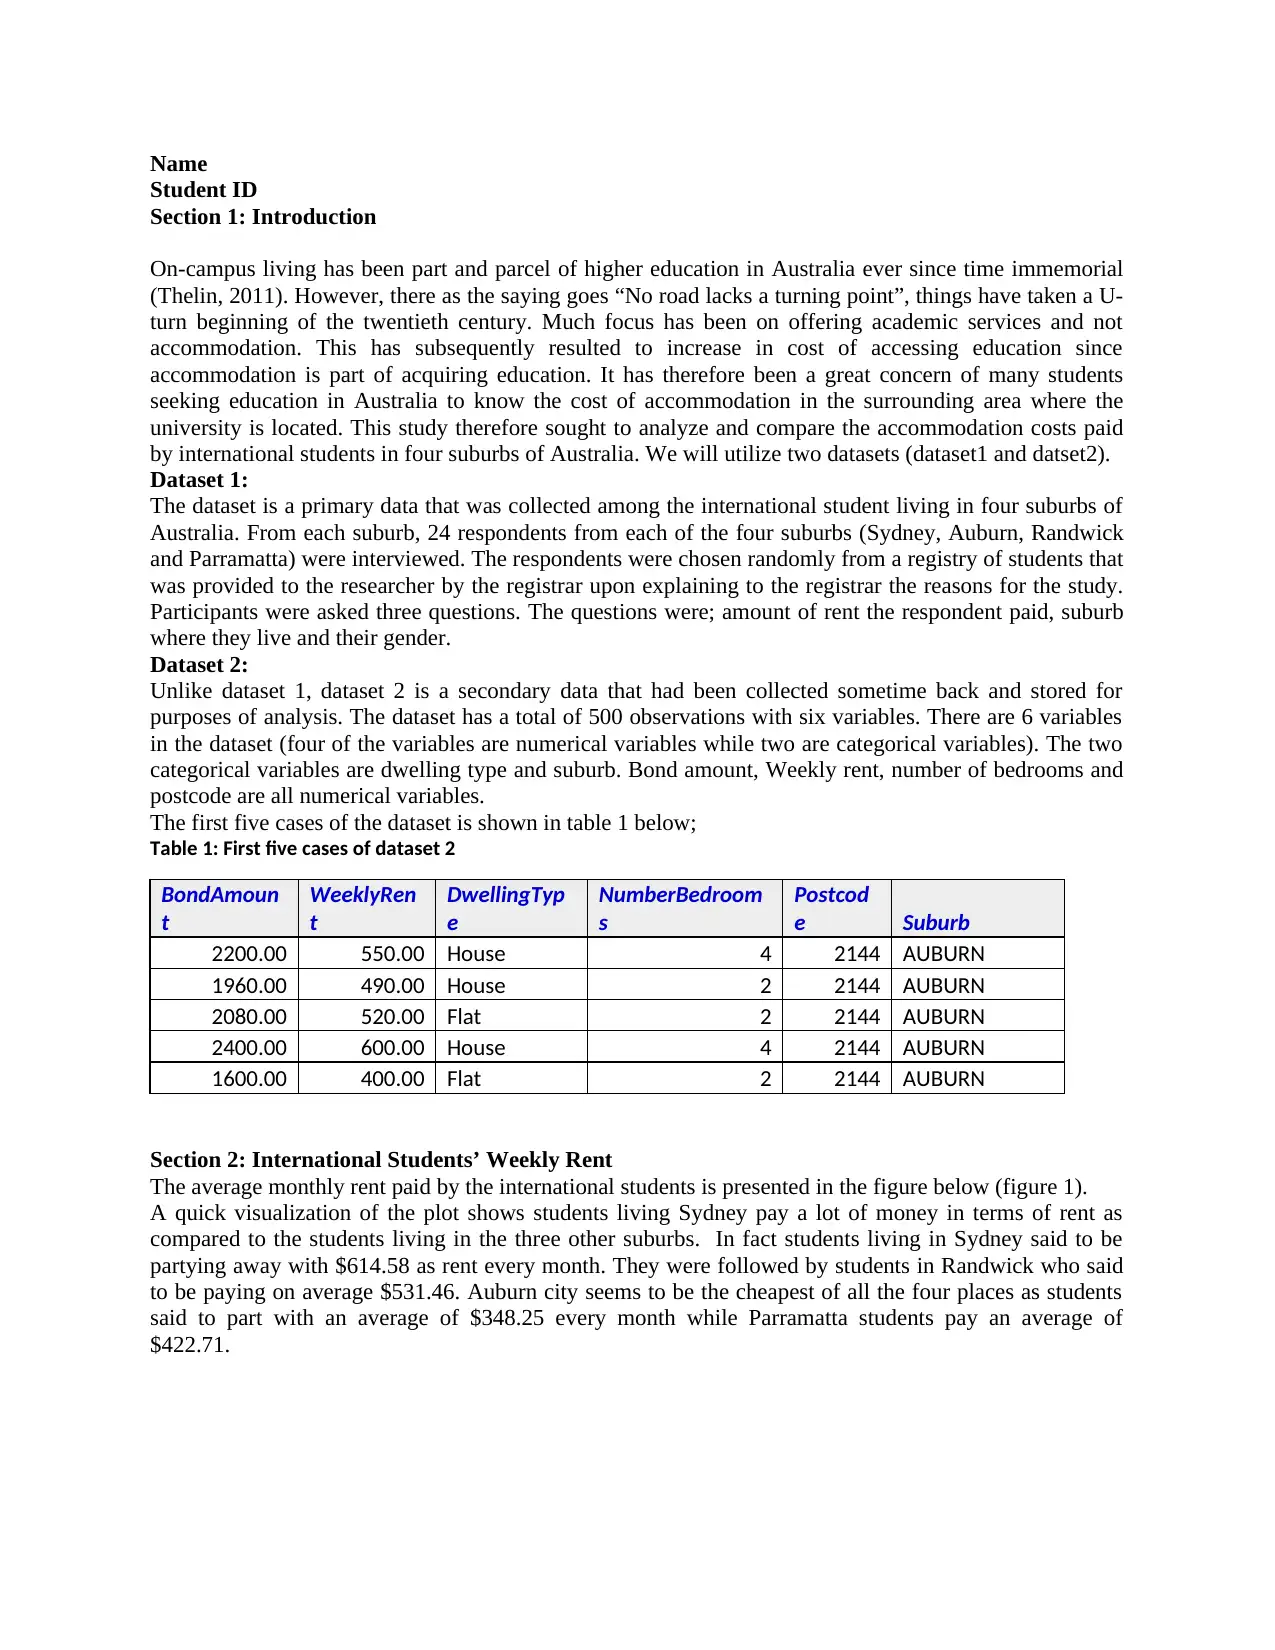
The average monthly rent paid by the international students is presented in the figure below (figure 1).
A quick visualization of the plot shows students living Sydney pay a lot of money in terms of rent as
compared to the students living in the three other suburbs. In fact students living in Sydney said to be
partying away with $614.58 as rent every month. They were followed by students in Randwick who said
to be paying on average $531.46. Auburn city seems to be the cheapest of all the four places as students
said to part with an average of $348.25 every month while Parramatta students pay an average of
$422.71.
Student ID
Section 1: Introduction
On-campus living has been part and parcel of higher education in Australia ever since time immemorial
(Thelin, 2011). However, there as the saying goes “No road lacks a turning point”, things have taken a U-
turn beginning of the twentieth century. Much focus has been on offering academic services and not
accommodation. This has subsequently resulted to increase in cost of accessing education since
accommodation is part of acquiring education. It has therefore been a great concern of many students
seeking education in Australia to know the cost of accommodation in the surrounding area where the
university is located. This study therefore sought to analyze and compare the accommodation costs paid
by international students in four suburbs of Australia. We will utilize two datasets (dataset1 and datset2).
Dataset 1:
The dataset is a primary data that was collected among the international student living in four suburbs of
Australia. From each suburb, 24 respondents from each of the four suburbs (Sydney, Auburn, Randwick
and Parramatta) were interviewed. The respondents were chosen randomly from a registry of students that
was provided to the researcher by the registrar upon explaining to the registrar the reasons for the study.
Participants were asked three questions. The questions were; amount of rent the respondent paid, suburb
where they live and their gender.
Dataset 2:
Unlike dataset 1, dataset 2 is a secondary data that had been collected sometime back and stored for
purposes of analysis. The dataset has a total of 500 observations with six variables. There are 6 variables
in the dataset (four of the variables are numerical variables while two are categorical variables). The two
categorical variables are dwelling type and suburb. Bond amount, Weekly rent, number of bedrooms and
postcode are all numerical variables.
The first five cases of the dataset is shown in table 1 below;
Table 1: First five cases of dataset 2
BondAmoun
t
WeeklyRen
t
DwellingTyp
e
NumberBedroom
s
Postcod
e Suburb
2200.00 550.00 House 4 2144 AUBURN
1960.00 490.00 House 2 2144 AUBURN
2080.00 520.00 Flat 2 2144 AUBURN
2400.00 600.00 House 4 2144 AUBURN
1600.00 400.00 Flat 2 2144 AUBURN
Section 2: International Students’ Weekly Rent
The average monthly rent paid by the international students is presented in the figure below (figure 1).
A quick visualization of the plot shows students living Sydney pay a lot of money in terms of rent as
compared to the students living in the three other suburbs. In fact students living in Sydney said to be
partying away with $614.58 as rent every month. They were followed by students in Randwick who said
to be paying on average $531.46. Auburn city seems to be the cheapest of all the four places as students
said to part with an average of $348.25 every month while Parramatta students pay an average of
$422.71.
Secure Best Marks with AI Grader
Need help grading? Try our AI Grader for instant feedback on your assignments.
Auburn
Parramatta
Randwick
Sydney
0.00 100.00 200.00 300.00 400.00 500.00 600.00 700.00
348.25
422.71
531.46
614.58
Average monthly rent paid
Figure 1: Average weekly rent paid by international students
Table 2: Descriptive Statistics
Auburn Parramatta Randwick Sydney
Mean 348.25 422.71 531.46 614.58
Standard
Error
5.64 5.43 8.23 8.26
Median 352.00 422.50 527.50 620.00
Mode 367.00 455.00 580.00 580.00
Standard
Deviation
27.63 26.62 40.34 40.46
Sample
Variance
763.59 708.65 1627.13 1636.78
Kurtosis -0.77 -0.95 -0.45 -0.55
Skewness -0.06 0.02 0.11 -0.44
Range 95.00 95.00 150.00 150.00
Minimum 302.00 375.00 460.00 520.00
Maximum 397.00 470.00 610.00 670.00
Sum 8358.00 10145.00 12755.00 14750.00
Count 24 24 24 24
As can be seen from the above table (table 2), the average monthly rent is highest in Sydney ($614.58),
followed by Randwick ($531.46), third was Parramatta ($422.71) while in Auburn was the cheapest
($348.25).
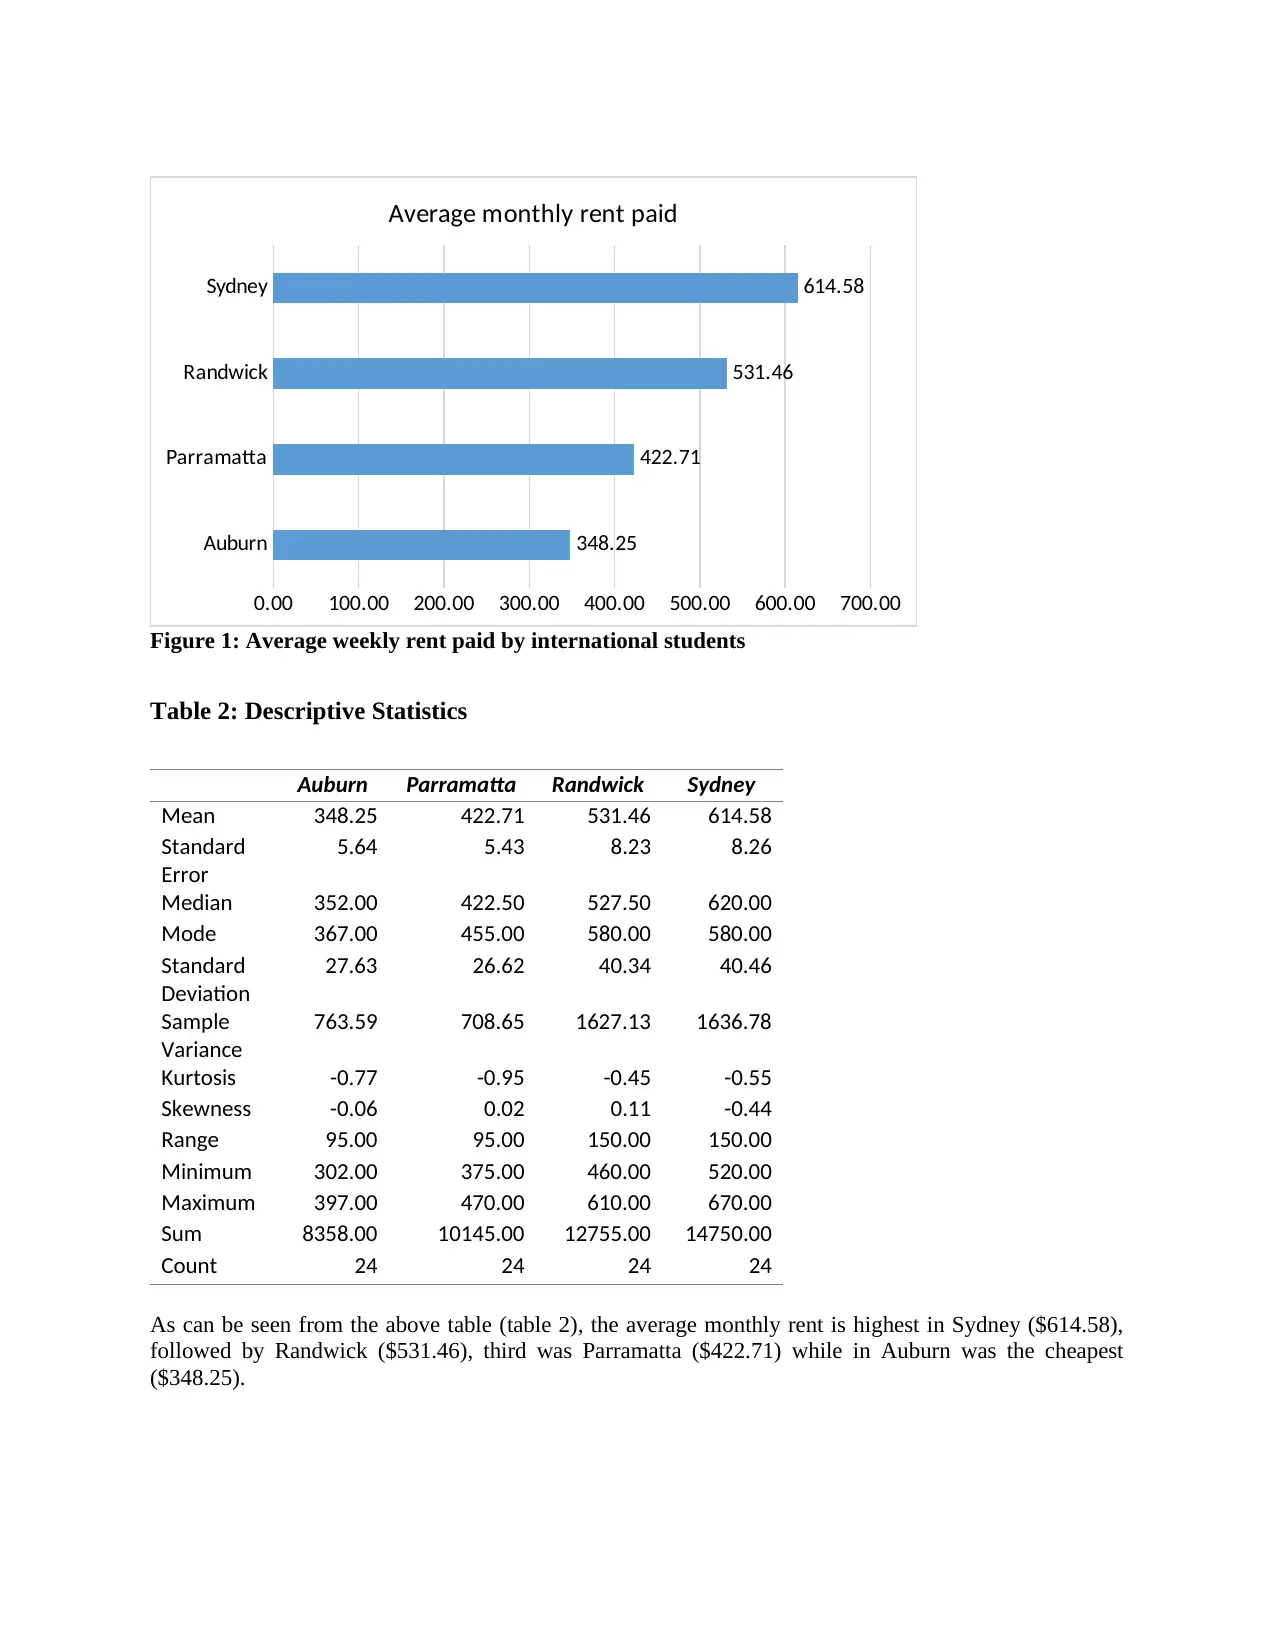
Section 3: Rental Bond Board Property Data – Dwelling Type
The figure shows that majority live in flats (n = 465) only a few live in houses (n = 35).
Figure 2: Dwelling Types
There was a great concern to check whether there enough evidence that the proportion of House dwelling
type is less than 10%. We performed a one-sample t-test in order to verify the claim. The results are in
table 3 below;
Table 3: t-Test: Two-Sample Assuming Equal Variances
Dwelling
Type
Sample
Mean 0.07 0.1
Variance 0.0652 0.0902
Observations 500 500
Pooled Variance 0.0777
Hypothesized Mean Difference 0
df 998
t Stat -1.70
P(T<=t) one-tail 0.0446
t Critical one-tail 1.6464
P(T<=t) two-tail 0.0891
t Critical two-tail 1.9623
From table 3 above, we can see that the p-value for the one-tail is 0.0446 (a value less than 5% level of
significance), we therefore reject the null hypothesis and conclude that there is enough evidence that the
proportion of House dwelling type is less than 10%.
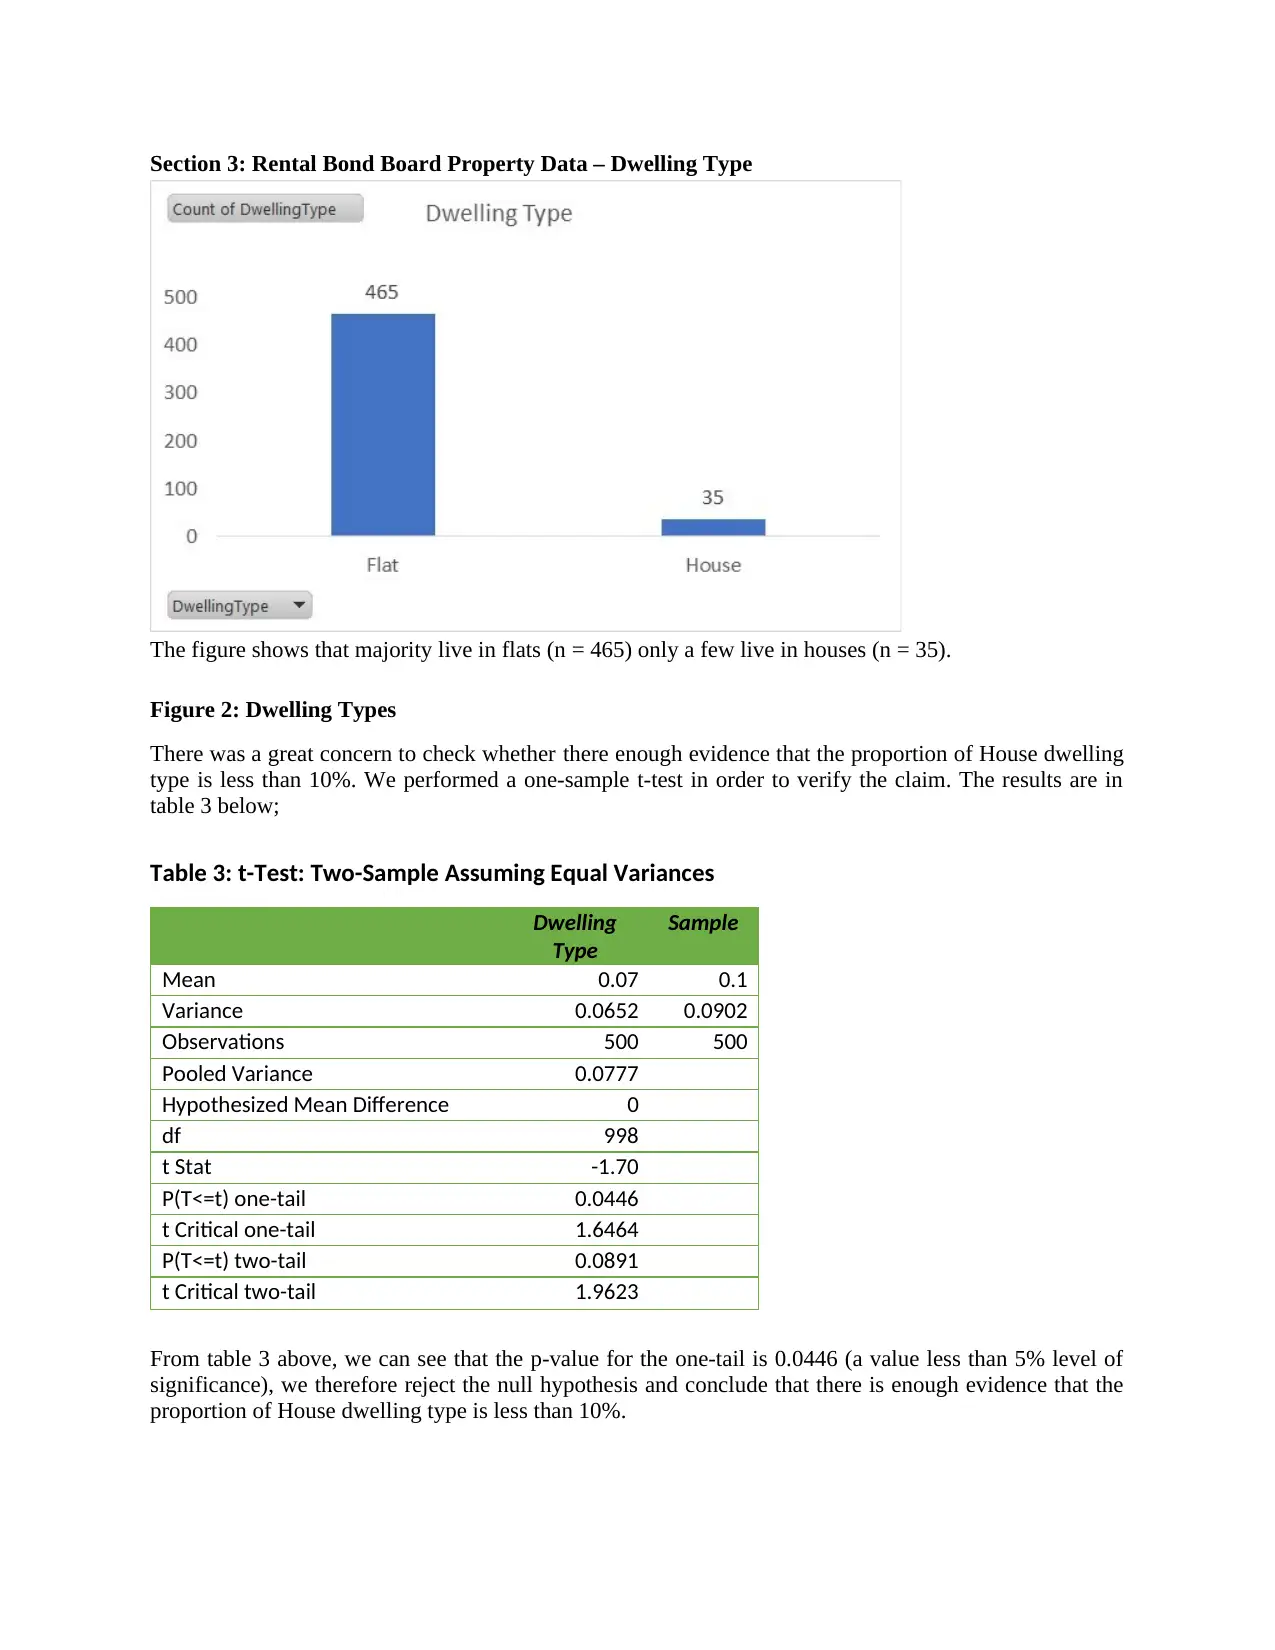
What can be seen from the above bar chart is that the proportion of flats is highest in Sydney and
Randwick but lowest in Auburn. However, when it comes to proportion of houses, it is highest in Auburn
and almost zero in Sydney.
A client who would want to like to have a house instead of a flat, would be advised to go to Auburn or
may Parramatta since those are the two suburbs that had a significant proportion of houses.
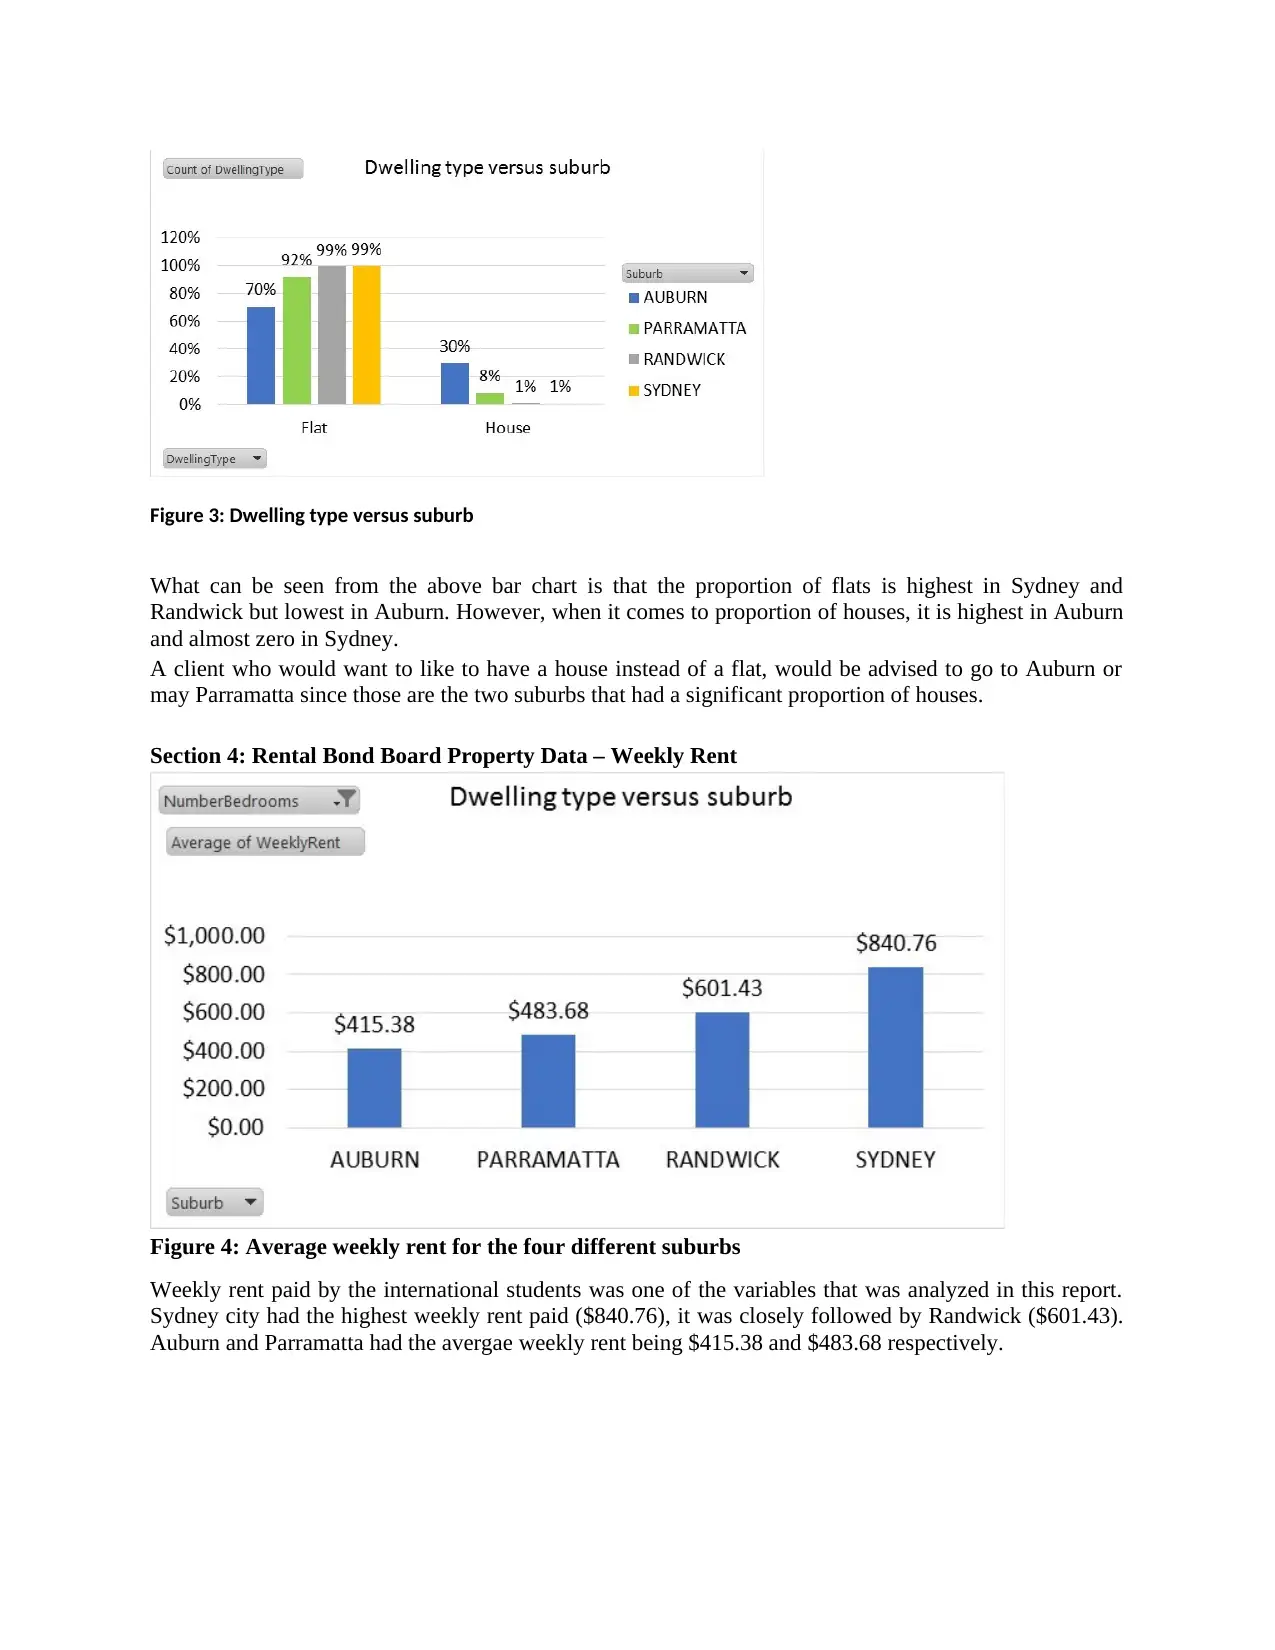
Section 4: Rental Bond Board Property Data – Weekly Rent
Figure 4: Average weekly rent for the four different suburbs
Weekly rent paid by the international students was one of the variables that was analyzed in this report.
Sydney city had the highest weekly rent paid ($840.76), it was closely followed by Randwick ($601.43).
Auburn and Parramatta had the avergae weekly rent being $415.38 and $483.68 respectively.
Figure 3: Dwelling type versus suburb
Randwick but lowest in Auburn. However, when it comes to proportion of houses, it is highest in Auburn
and almost zero in Sydney.
A client who would want to like to have a house instead of a flat, would be advised to go to Auburn or
may Parramatta since those are the two suburbs that had a significant proportion of houses.
Section 4: Rental Bond Board Property Data – Weekly Rent
Figure 4: Average weekly rent for the four different suburbs
Weekly rent paid by the international students was one of the variables that was analyzed in this report.
Sydney city had the highest weekly rent paid ($840.76), it was closely followed by Randwick ($601.43).
Auburn and Parramatta had the avergae weekly rent being $415.38 and $483.68 respectively.
Figure 3: Dwelling type versus suburb
Secure Best Marks with AI Grader
Need help grading? Try our AI Grader for instant feedback on your assignments.
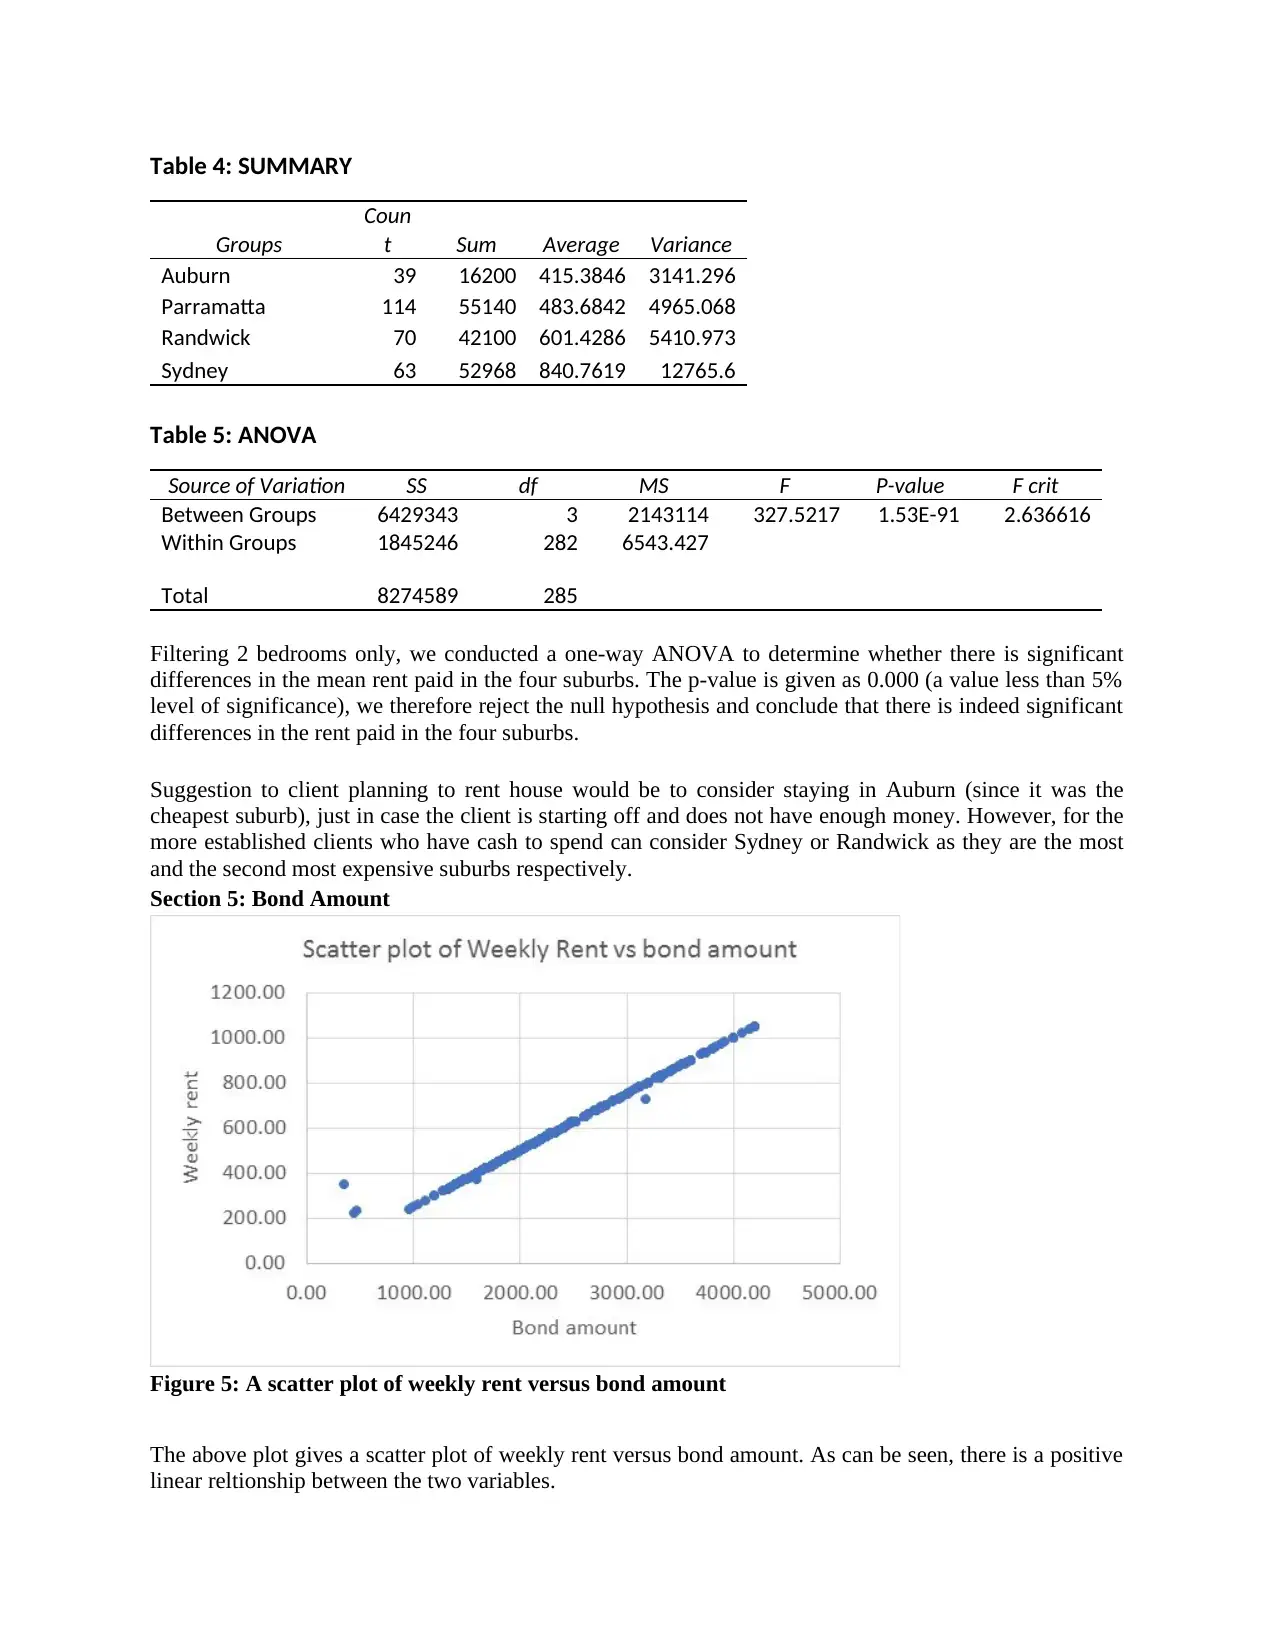
Table 4: SUMMARY
Groups
Coun
t Sum Average Variance
Auburn 39 16200 415.3846 3141.296
Parramatta 114 55140 483.6842 4965.068
Randwick 70 42100 601.4286 5410.973
Sydney 63 52968 840.7619 12765.6
Table 5: ANOVA
Source of Variation SS df MS F P-value F crit
Between Groups 6429343 3 2143114 327.5217 1.53E-91 2.636616
Within Groups 1845246 282 6543.427
Total 8274589 285
Filtering 2 bedrooms only, we conducted a one-way ANOVA to determine whether there is significant
differences in the mean rent paid in the four suburbs. The p-value is given as 0.000 (a value less than 5%
level of significance), we therefore reject the null hypothesis and conclude that there is indeed significant
differences in the rent paid in the four suburbs.
Suggestion to client planning to rent house would be to consider staying in Auburn (since it was the
cheapest suburb), just in case the client is starting off and does not have enough money. However, for the
more established clients who have cash to spend can consider Sydney or Randwick as they are the most
and the second most expensive suburbs respectively.
Section 5: Bond Amount
Figure 5: A scatter plot of weekly rent versus bond amount
The above plot gives a scatter plot of weekly rent versus bond amount. As can be seen, there is a positive
linear reltionship between the two variables.
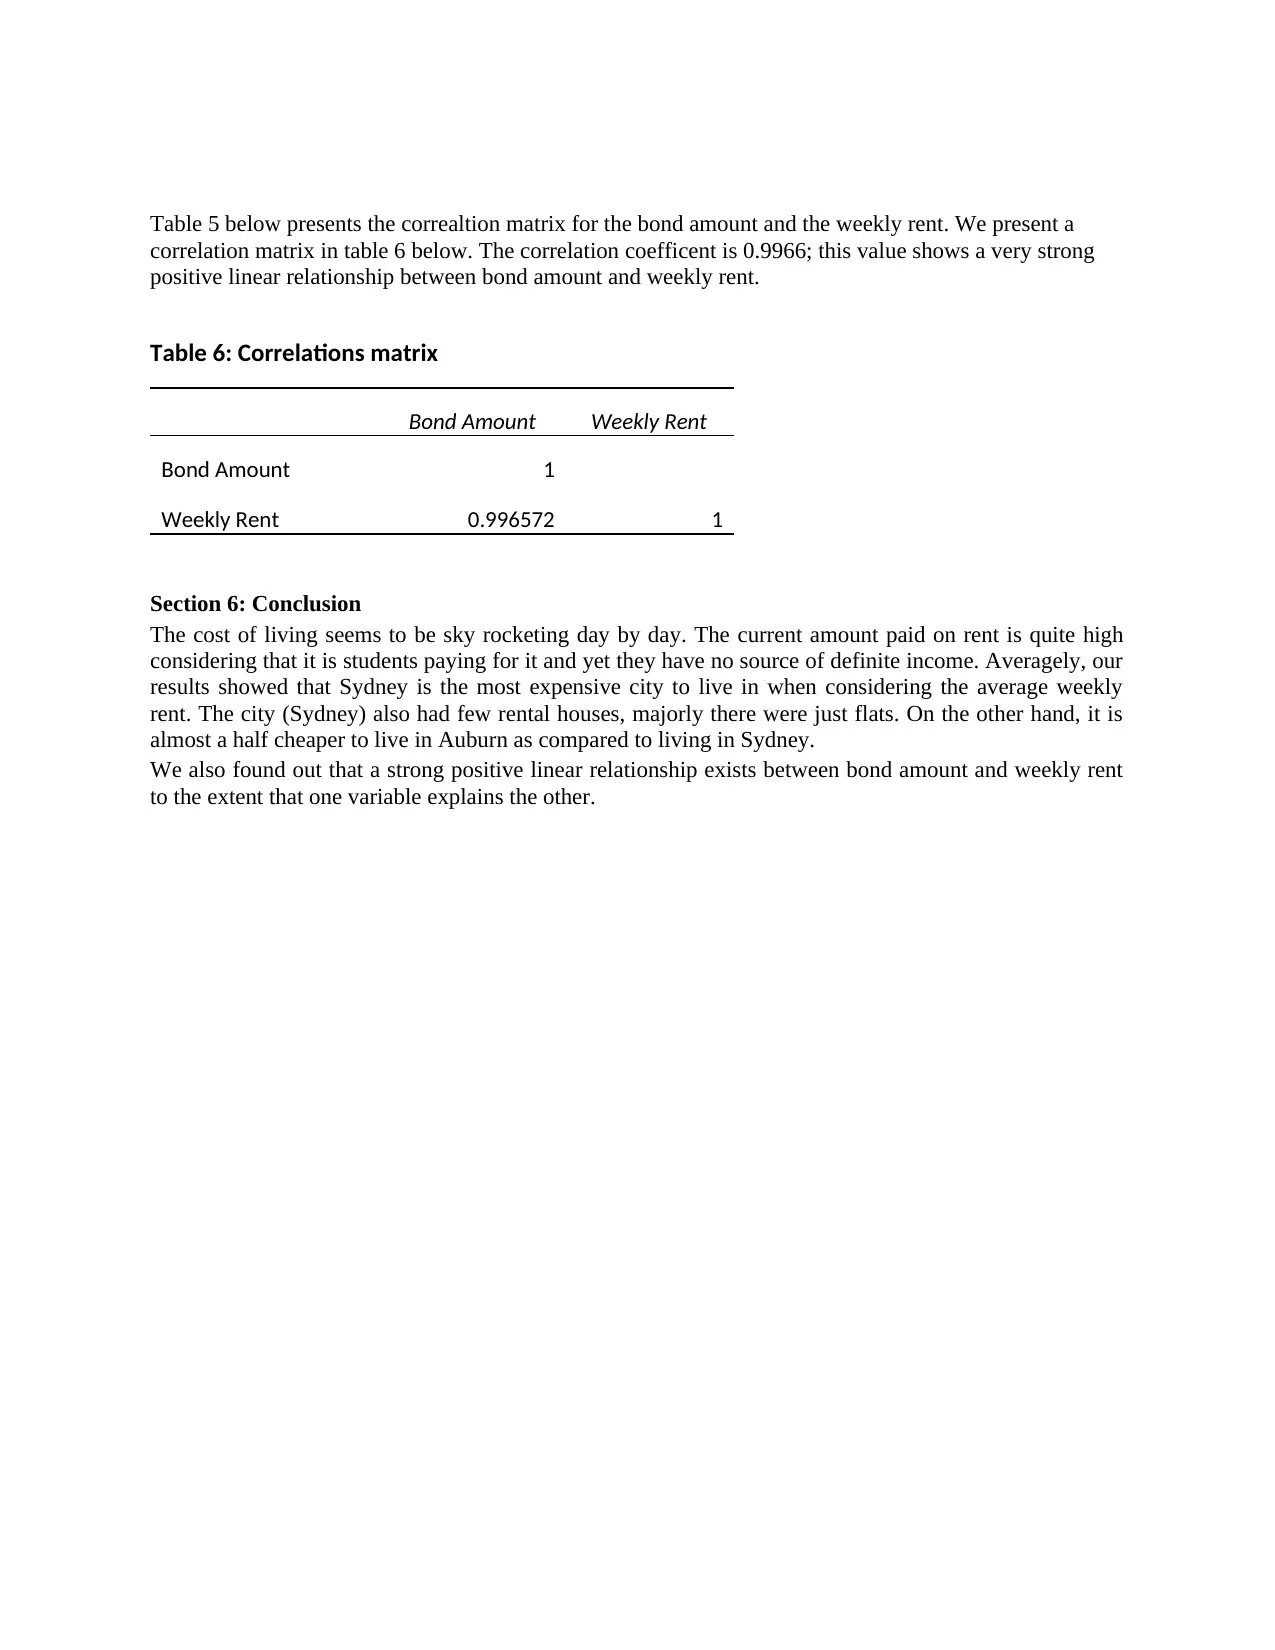
Table 5 below presents the correaltion matrix for the bond amount and the weekly rent. We present a
correlation matrix in table 6 below. The correlation coefficent is 0.9966; this value shows a very strong
positive linear relationship between bond amount and weekly rent.
Table 6: Correlations matrix
Bond Amount Weekly Rent
Bond Amount 1
Weekly Rent 0.996572 1
Section 6: Conclusion
The cost of living seems to be sky rocketing day by day. The current amount paid on rent is quite high
considering that it is students paying for it and yet they have no source of definite income. Averagely, our
results showed that Sydney is the most expensive city to live in when considering the average weekly
rent. The city (Sydney) also had few rental houses, majorly there were just flats. On the other hand, it is
almost a half cheaper to live in Auburn as compared to living in Sydney.
We also found out that a strong positive linear relationship exists between bond amount and weekly rent
to the extent that one variable explains the other.
References
Gordon, L., 2015. College students move off campus as room and board costs rise.
Kolstad, E., 2015. More students turn to off-campus housing.
La Roche, C. R., Flanigan, M. A. & Copeland , J. P., 2010. Student housing: Trends, preferences and
needs. Contemporary Issues in Education Research, 3(10), pp. 45-51.
Lopez-Paz , D., Hennig , P. & Schölkopf , B., 2013. The Randomized Dependence Coefficient. Conference
on Neural Information Processing Systems.
Nikolić, D., Muresan, R. C., Feng, W. & Singer, W., 2012. Scaled correlation analysis: a better way to
compute a cross-correlogram. European Journal of Neuroscience, p. 1–21.
Owens, J. T., 2010. The impact of university housing construction type on psychosocial development of
first-year students.
Pike, G. R., 2002. The differential effects of on- and off-campus living arrangements on students'
openness to diversity. Journal of Student Affairs Research and Practice, 39(4), pp. 283-299.
Székely, G., Rizzo, J. & Bakirov, N. K., 2010. Measuring and testing independence by correlation of
distances. Annals of Statistics, 35(6), p. 2769–2794.
Paraphrase This Document
Need a fresh take? Get an instant paraphrase of this document with our AI Paraphraser

1 out of 8
Related Documents


Your All-in-One AI-Powered Toolkit for Academic Success.
+13062052269
info@desklib.com
Available 24*7 on WhatsApp / Email
![[object Object]](/_next/static/media/star-bottom.7253800d.svg)
Unlock your academic potential
© 2024 | Zucol Services PVT LTD | All rights reserved.