Hypothesis Testing Assignment
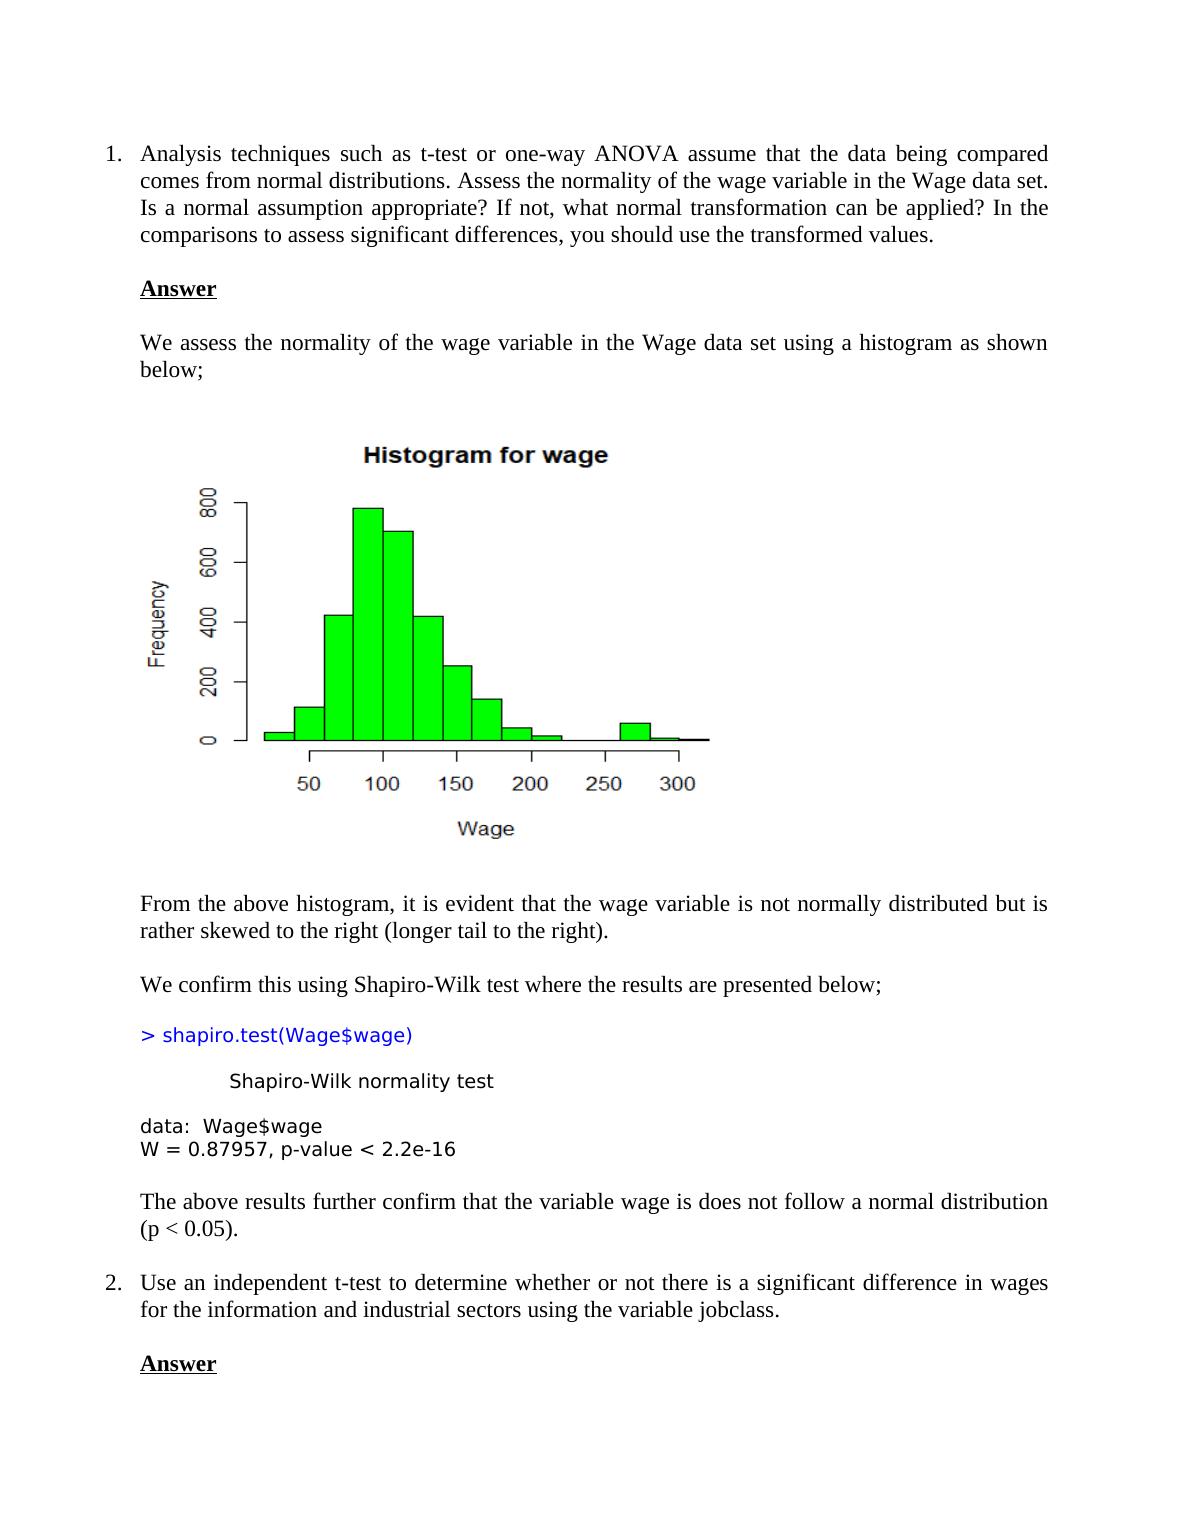
Perform hypothesis tests to identify significant differences in wages for different groups in the data set.
9 Pages2166 Words306 Views
Added on 2022-08-28
Hypothesis Testing Assignment
Perform hypothesis tests to identify significant differences in wages for different groups in the data set.
Added on 2022-08-28
ShareRelated Documents
End of preview
Want to access all the pages? Upload your documents or become a member.
Analysis of Film Thickness Variables
|9
|1545
|75
Statistics: ANOVA, Regression Analysis and Hypothesis Testing
|9
|832
|317
Statistical Tests - Assignment
|6
|985
|128
Statistics: ANOVA, Regression Analysis and Hypothesis Testing
|10
|1103
|376
Assignment On Statistics
|10
|481
|54
Assignment of Descriptive Statistics
|12
|1620
|76