Econometrics and Business Statistics: Analysis of Interest Rates and Stock Prices
Added on 2023-06-12
15 Pages1572 Words369 Views
Running head: ECONOMETRICS AND BUSINESS STATISTICS
ECON634: Econometrics and Business Statistics
Name of the Student:
Macquarie University
Take-home Test
ECON634: Econometrics and Business Statistics
Name of the Student:
Macquarie University
Take-home Test
2ECONOMETRICS AND BUSINESS STATISTICS
Table of Contents
Question 1........................................................................................................................................3
Part 1a).........................................................................................................................................3
Part 1b).........................................................................................................................................3
Part 1c).........................................................................................................................................3
Part 1d).........................................................................................................................................4
Part 1e).........................................................................................................................................4
Part 1f).........................................................................................................................................5
Question 2........................................................................................................................................6
Part 2a).........................................................................................................................................6
Part 2b).........................................................................................................................................6
Part 2c).........................................................................................................................................8
Part 2d).......................................................................................................................................10
Part 2e).......................................................................................................................................11
Part 2f).......................................................................................................................................11
Question 3......................................................................................................................................12
Part 3a).......................................................................................................................................12
Part 3b).......................................................................................................................................12
Part 3c).......................................................................................................................................12
Part 3d).......................................................................................................................................14
Part 3e).......................................................................................................................................15
Question 4......................................................................................................................................15
3ECONOMETRICS AND BUSINESS STATISTICS
Question 1
Part 1a)
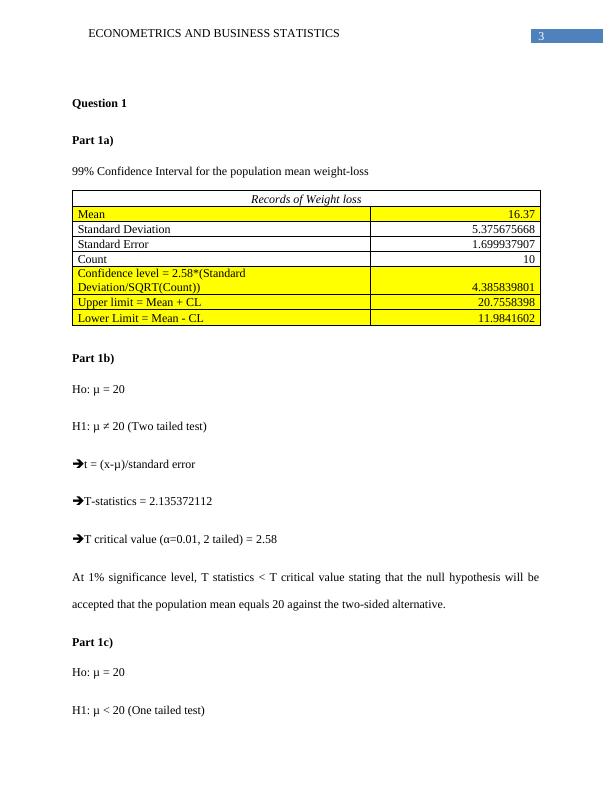
99% Confidence Interval for the population mean weight-loss
Records of Weight loss
Mean 16.37
Standard Deviation 5.375675668
Standard Error 1.699937907
Count 10
Confidence level = 2.58*(Standard
Deviation/SQRT(Count)) 4.385839801
Upper limit = Mean + CL 20.7558398
Lower Limit = Mean - CL 11.9841602
Part 1b)
Ho: μ = 20
H1: μ ≠ 20 (Two tailed test)
t = (x-μ)/standard error
T-statistics = 2.135372112
T critical value (α=0.01, 2 tailed) = 2.58
At 1% significance level, T statistics < T critical value stating that the null hypothesis will be
accepted that the population mean equals 20 against the two-sided alternative.
Part 1c)
Ho: μ = 20
H1: μ < 20 (One tailed test)
Question 1
Part 1a)
99% Confidence Interval for the population mean weight-loss
Records of Weight loss
Mean 16.37
Standard Deviation 5.375675668
Standard Error 1.699937907
Count 10
Confidence level = 2.58*(Standard
Deviation/SQRT(Count)) 4.385839801
Upper limit = Mean + CL 20.7558398
Lower Limit = Mean - CL 11.9841602
Part 1b)
Ho: μ = 20
H1: μ ≠ 20 (Two tailed test)
t = (x-μ)/standard error
T-statistics = 2.135372112
T critical value (α=0.01, 2 tailed) = 2.58
At 1% significance level, T statistics < T critical value stating that the null hypothesis will be
accepted that the population mean equals 20 against the two-sided alternative.
Part 1c)
Ho: μ = 20
H1: μ < 20 (One tailed test)
4ECONOMETRICS AND BUSINESS STATISTICS
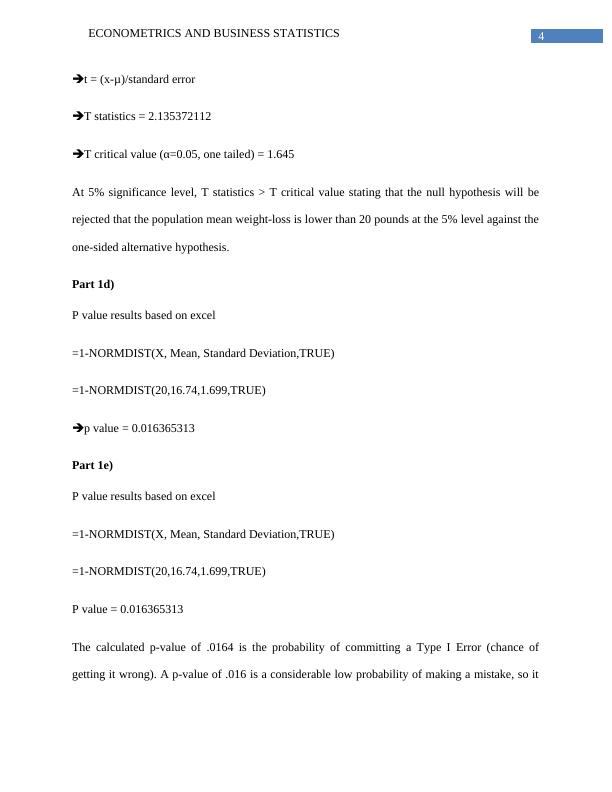
t = (x-μ)/standard error
T statistics = 2.135372112
T critical value (α=0.05, one tailed) = 1.645
At 5% significance level, T statistics > T critical value stating that the null hypothesis will be
rejected that the population mean weight-loss is lower than 20 pounds at the 5% level against the
one-sided alternative hypothesis.
Part 1d)
P value results based on excel
=1-NORMDIST(X, Mean, Standard Deviation,TRUE)
=1-NORMDIST(20,16.74,1.699,TRUE)
p value = 0.016365313
Part 1e)
P value results based on excel
=1-NORMDIST(X, Mean, Standard Deviation,TRUE)
=1-NORMDIST(20,16.74,1.699,TRUE)
P value = 0.016365313
The calculated p-value of .0164 is the probability of committing a Type I Error (chance of
getting it wrong). A p-value of .016 is a considerable low probability of making a mistake, so it
End of preview
Want to access all the pages? Upload your documents or become a member.
Related Documents
BUS7200 Statistic for Research Methodslg...
|4
|315
|353
Inferential Statistics 2018: Questions 1-4lg...
|4
|745
|257
Statistics: True/False, Multiple Choice, Fill in the Blanks, Hypothesis Testing, Regression Analysis, Chi-Square Testlg...
|16
|1819
|323
Hypothesis Testing and Standard Normal Distributionlg...
|5
|550
|259
Statistics - Hypothesis Testing, Percentile, Central Limit Theorem, Correlation Coefficient, Chi Square Testlg...
|13
|1282
|227
Statistics and Probability Questions 2022lg...
|11
|1101
|23