Statistics and Probability Assignment: Hypothesis Testing Analysis
VerifiedAdded on 2022/09/16
|11
|1101
|23
Homework Assignment
AI Summary
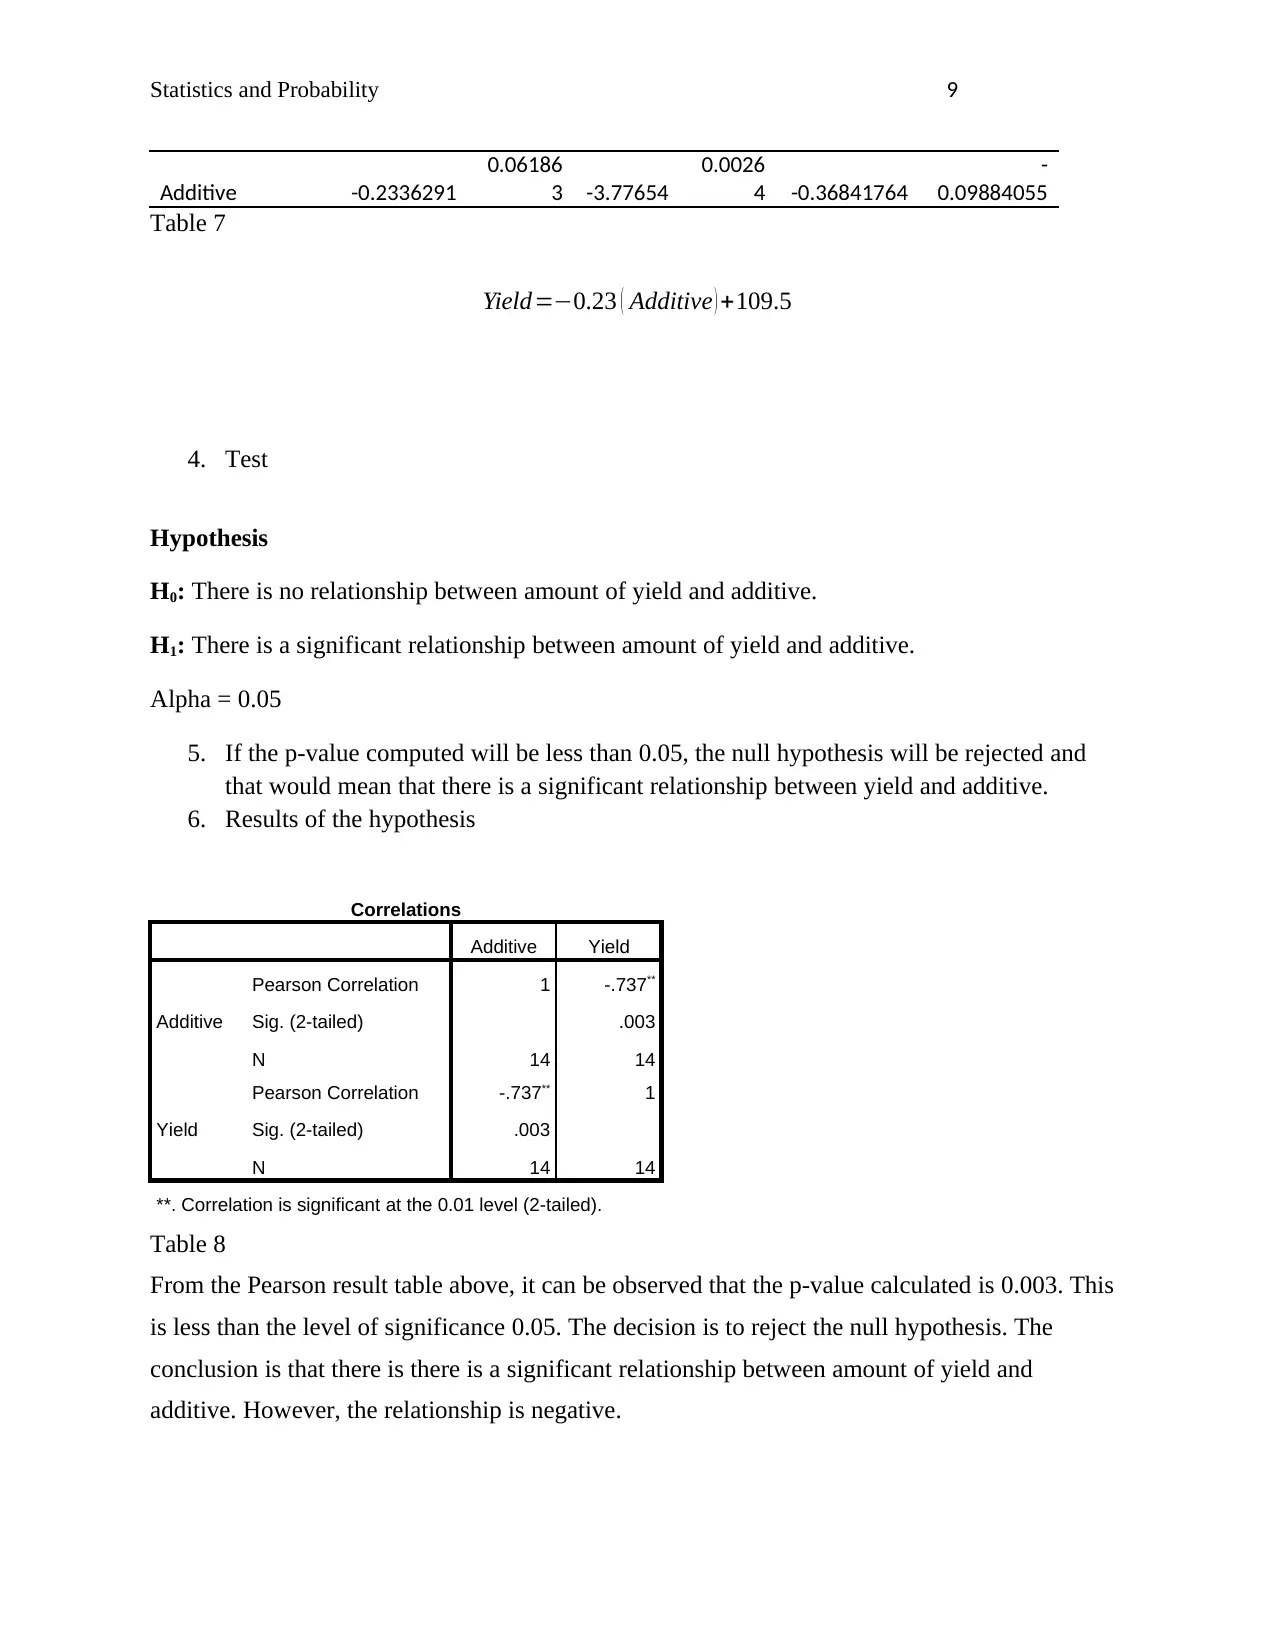
This assignment provides a comprehensive analysis of statistical concepts, focusing on hypothesis testing. The solution includes calculations of sample frequency, mean, standard deviation, and the use of frequency polygons, histograms, and cumulative frequency polygons. It addresses several hypothesis tests, including t-tests (both one-sample and independent samples with equal and unequal variances), and chi-square tests, and correlation analysis. The assignment covers various scenarios involving the testing of means, variances, and relationships between variables, with detailed explanations of hypotheses, p-values, and conclusions. The solution also includes regression analysis and interpretation of results, demonstrating a strong understanding of statistical methods and their applications.

1 out of 11
Related Documents


Your All-in-One AI-Powered Toolkit for Academic Success.
+13062052269
info@desklib.com
Available 24*7 on WhatsApp / Email
![[object Object]](/_next/static/media/star-bottom.7253800d.svg)
Copyright © 2020–2026 A2Z Services. All Rights Reserved. Developed and managed by ZUCOL.