Exploring Life Expectancy Variations: Factors, Gender Disparities, and Global Perspectives

Verified

Added on  2023/04/25

|9
|1590
|303
AI Summary
In this document we will discuss about Exploring Life Expectancy Variations and below are the summary points of this document:- 
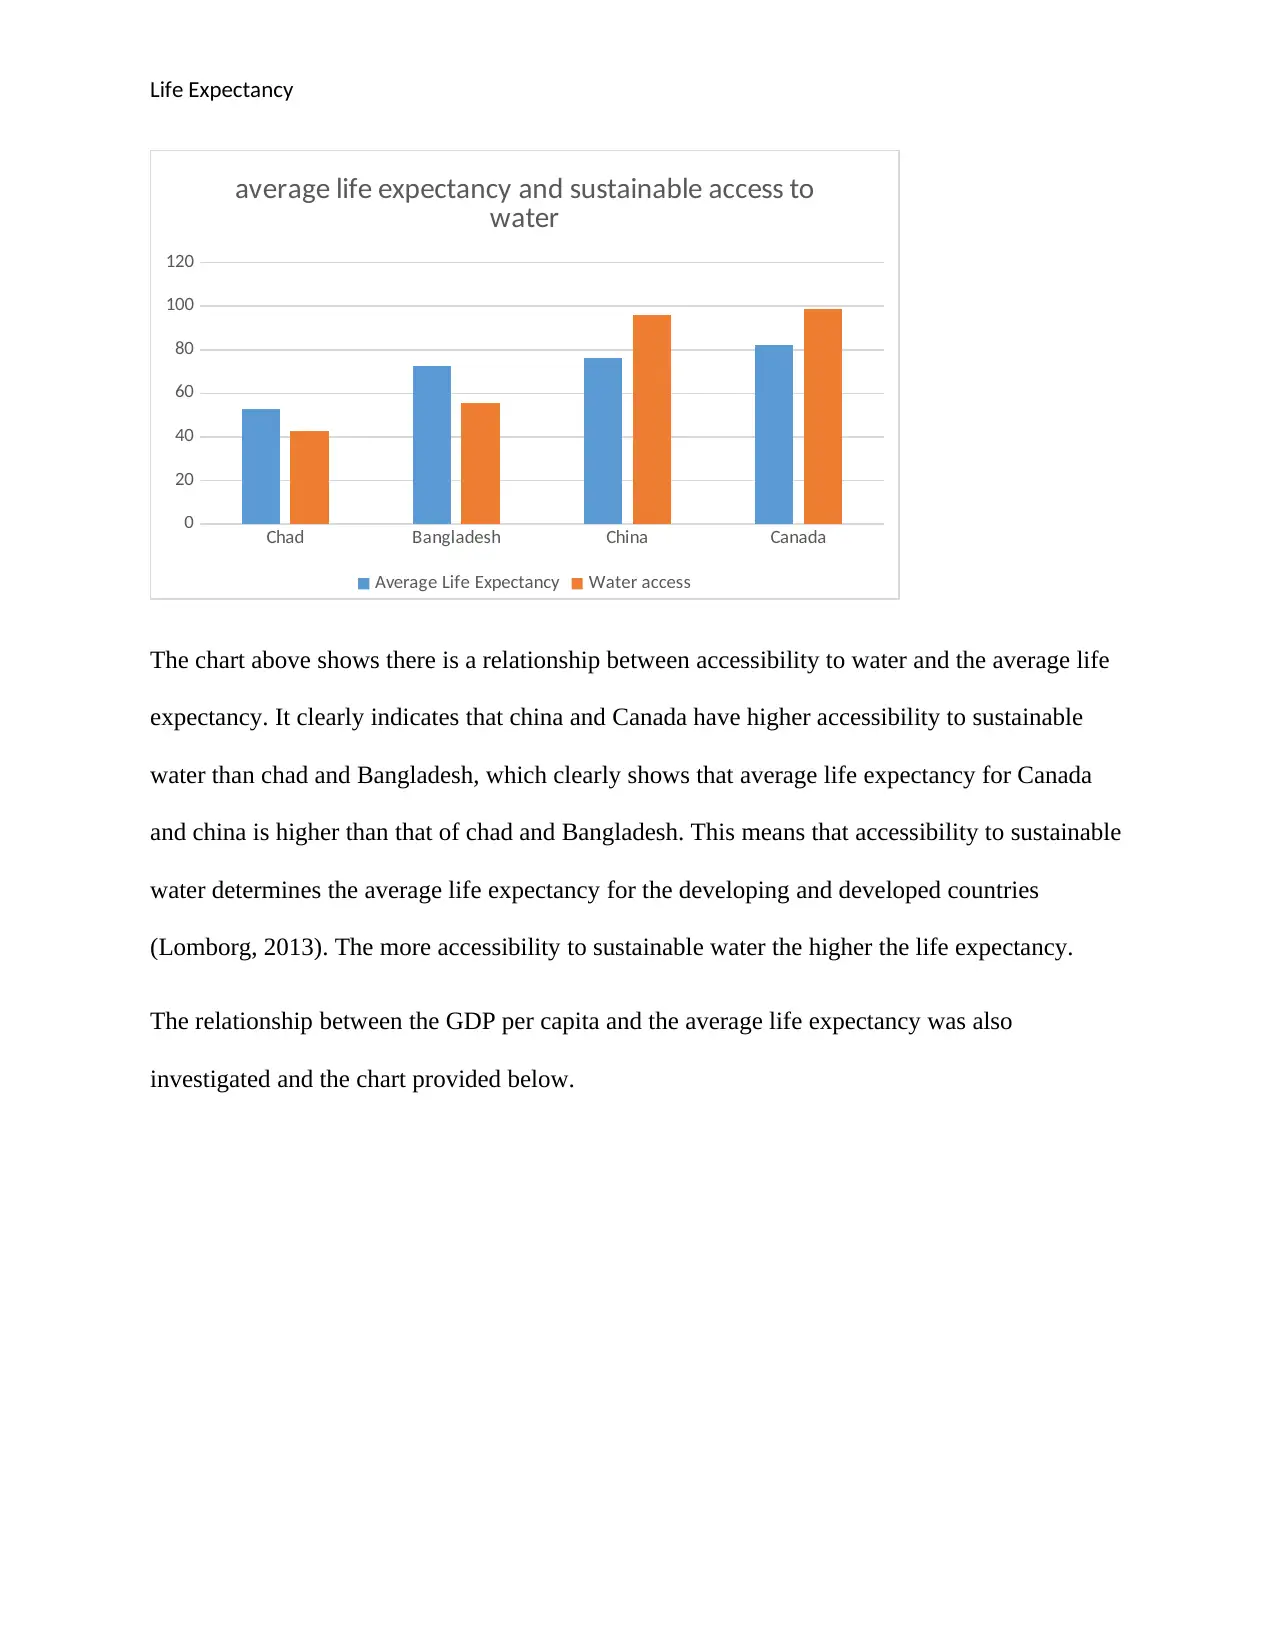
Life expectancy varies among countries and regions based on factors such as gender, demographics, and socioeconomic conditions. Females generally have a higher life expectancy than males, and developed countries tend to have higher life expectancies compared to developing countries. 
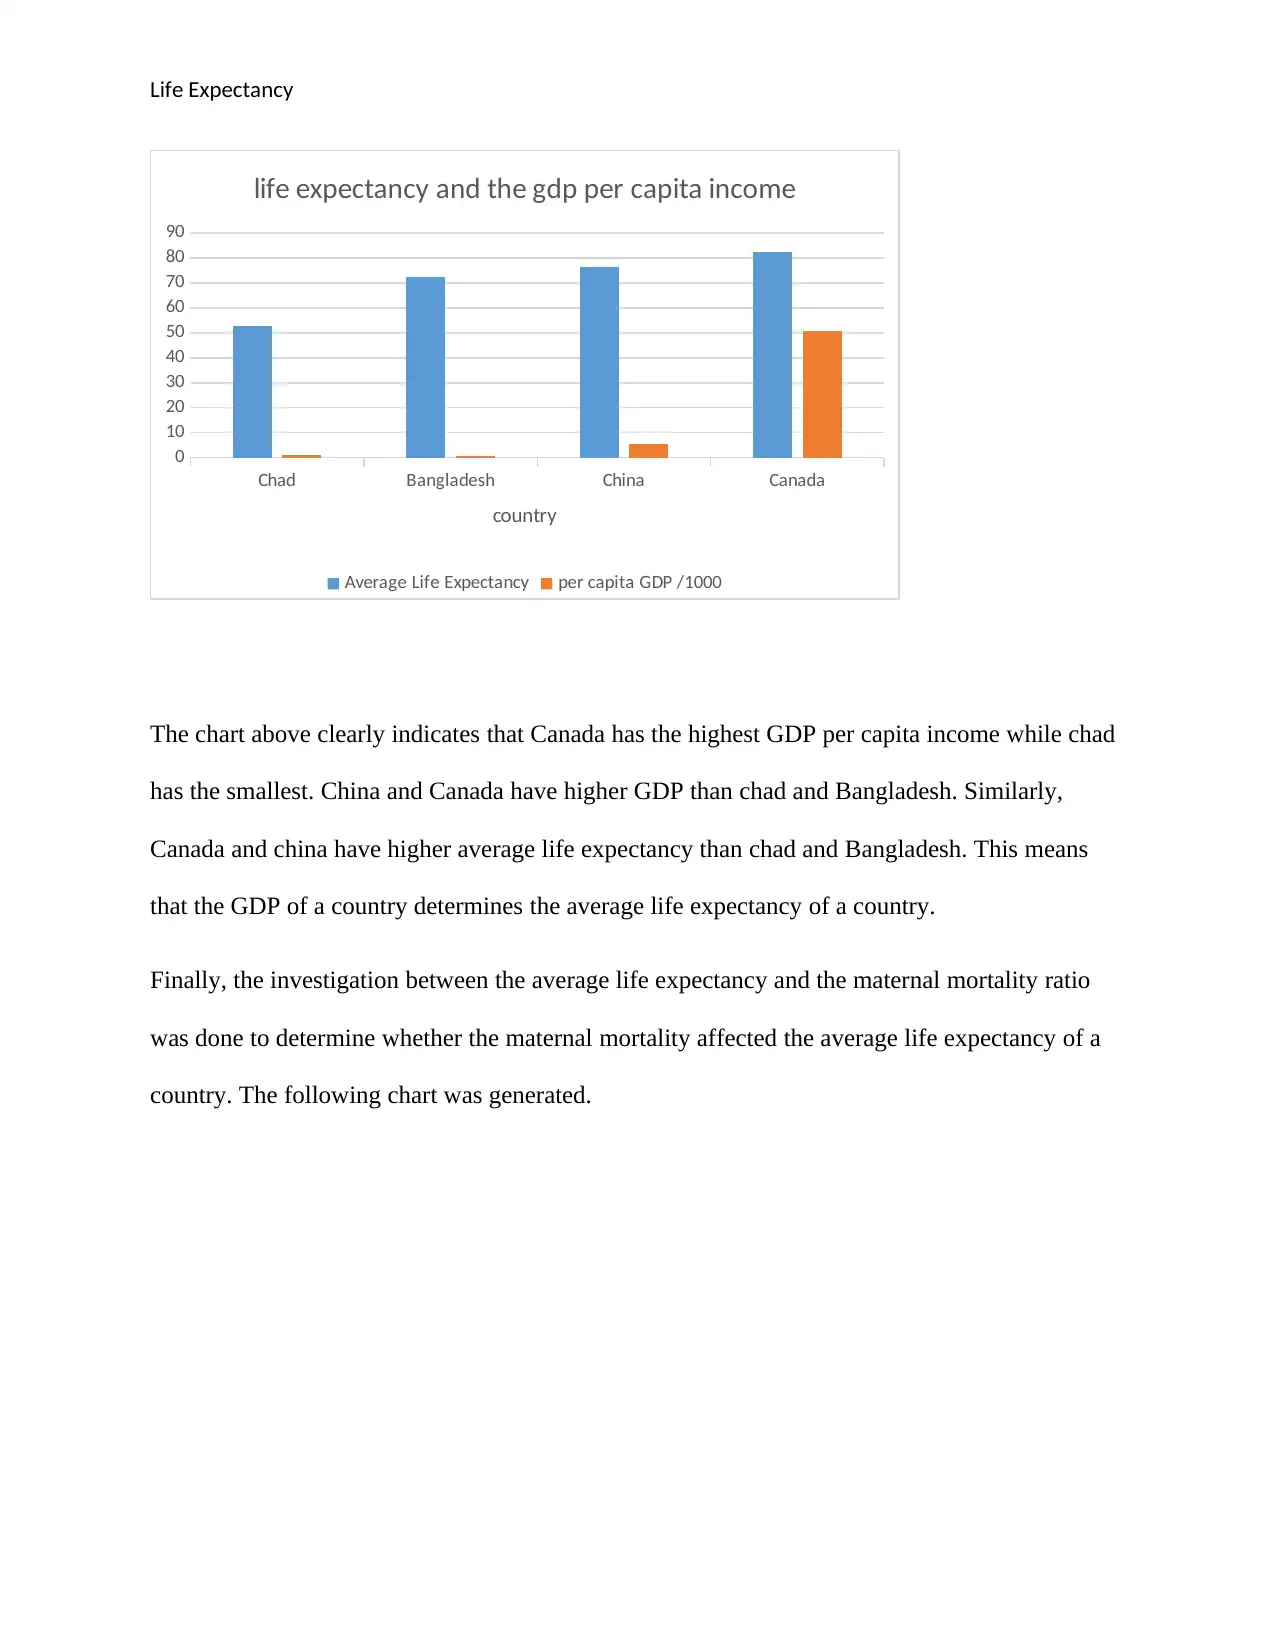
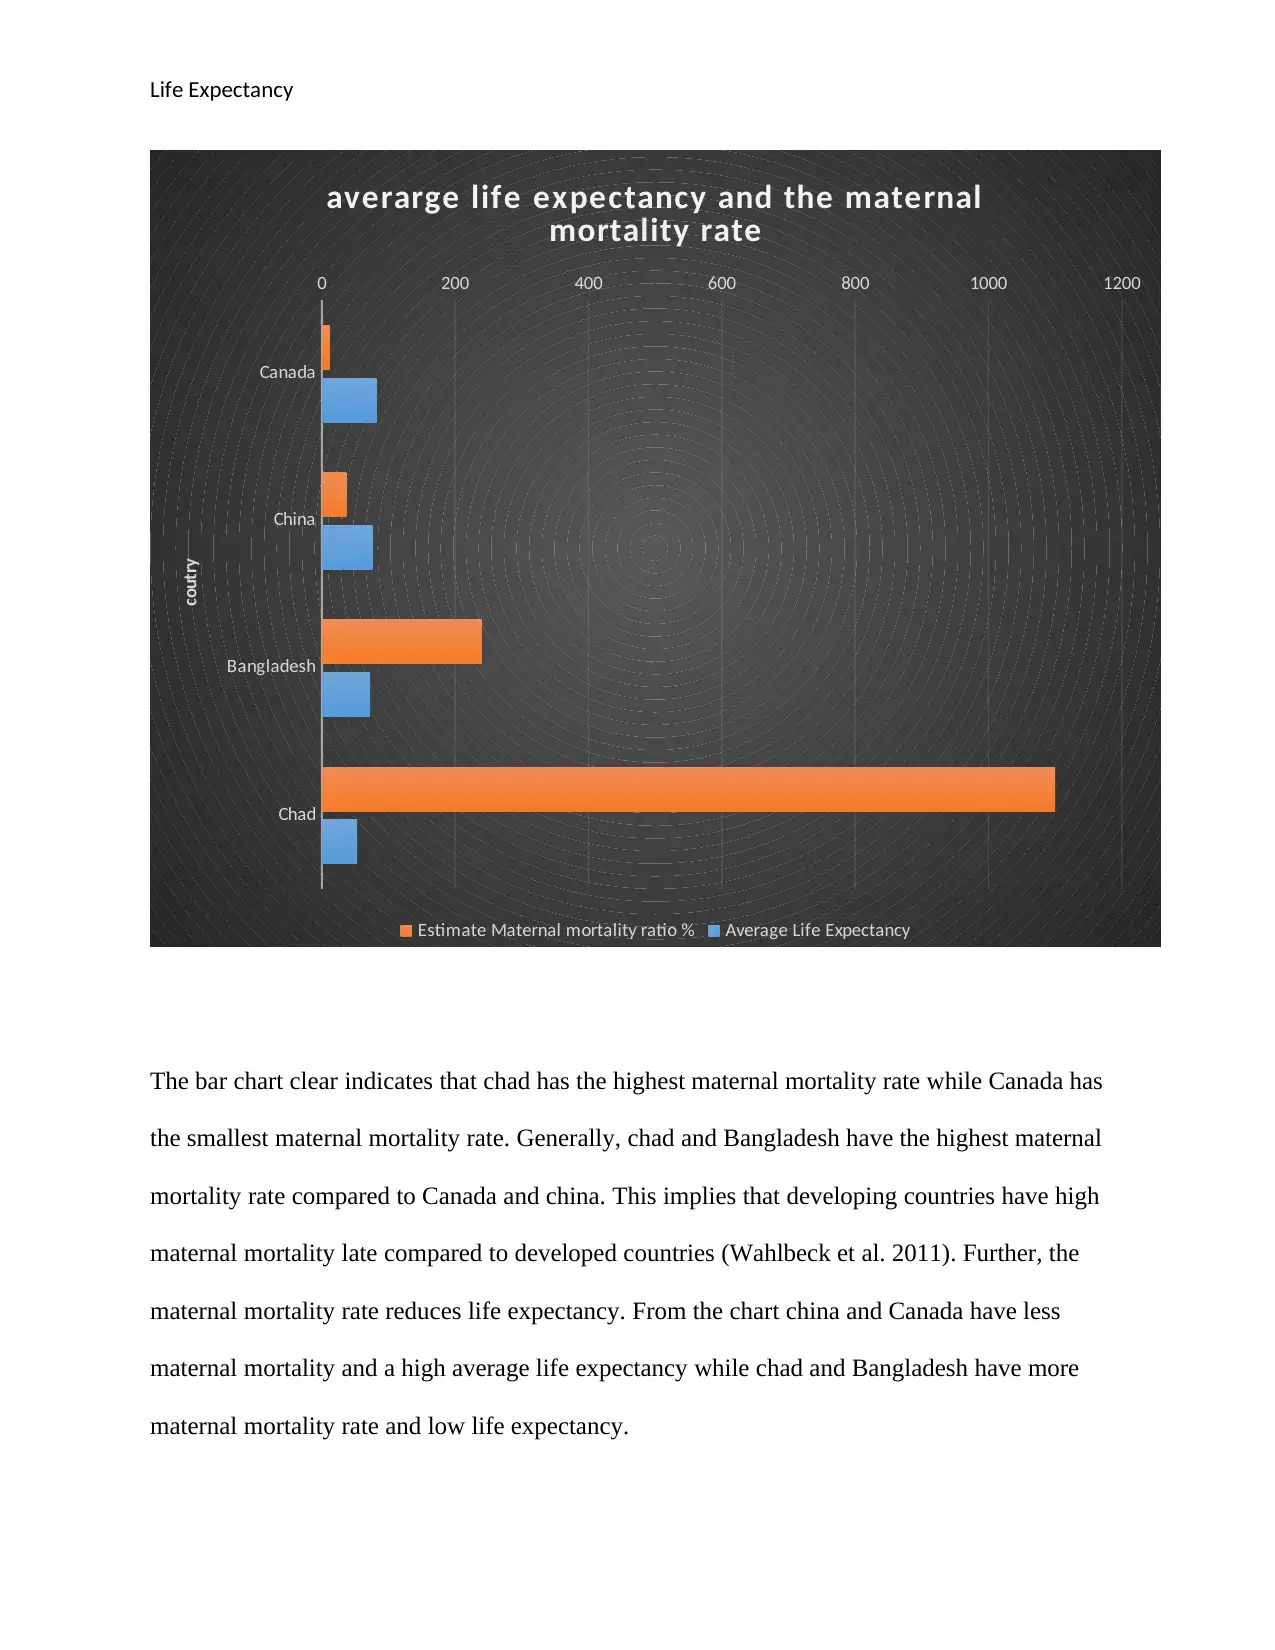
Factors such as access to clean water, GDP per capita income, and education enrollment also influence average life expectancy.
tabler-icon-diamond-filled.svg

Contribute Materials

Your contribution can guide someone’s learning journey. Share your documents today.
Document Page
Life Expectancy
Name:
Registration no:
Lecturer’s name:
Date of submission:
tabler-icon-diamond-filled.svg

Secure Best Marks with AI Grader

Need help grading? Try our AI Grader for instant feedback on your assignments.
Document Page
Life Expectancy
Life Expectancy in the World
Life expectancy is the average time human beings are expected to live given based on their year
of birth, current demographic conditions, their gender, and the past information of those who
have lived previously (Organization, 2009. ). Currently, in the world, the life expectancy of
individuals varies from country to country and content to content. As a policymakers, it was a
concern on how the rate at which life expectancy vary too much among some of the countries.
The research was conducted based on the following null hypothesis. The first hypothesis was
that there is no difference in life expectancy of developed countries and developing countries.
The second hypothesis was that there is no relationship between life expectancy and the factors
like water access and the GDP per capita income.
The data for the research was obtained from the United Nations website. Through its high
commission secretary provides data for the countries in the world. The data obtained contains
information about life expectancy at birth and life expectancy after the age of sixty for both male
and females in different countries of the world (Mukherjee, 2013). A random sample was
generated from the data that was used for analysis in order to draw conclusion about the data.
The analysis was used to draw conclusion about the hypothesis stated earlier. Two developed
countries were considered and two developing countries. The developed countries under
consideration were china and Canada while the developing countries under consideration were
chad and Bangladesh.
Document Page
Life Expectancy
The analysis of the sample data was done using Microsoft Excel. The analysis began by plotting
the data for the life expectancy in developed countries and developing countries. The following
bar graph was generated.
Chad Bangladesh China Canada
0
10
20
30
40
50
60
70
80
90
life expectancy
life expectancy at birth male life expectancy at birth female
country
age in years
From the chart it was found out that life expectancy for females was greater than that of male in
both developed and developing countries. Further, the life expectancy for both male and female
is less in chad and Bangladesh which are developing countries than life expectancy for male and
female in developed countries. This is because females have a biological advantage that allows
mutation of more cells than males. Women are involved in jobs and activities that require less of
their muscular energy this makes them stay young and healthy, and also female take more care of
their bodies than males (EXPECTANCY, 2010.). Further males are affected by their lifestyles
such as cigarettes smoking and excessive consumption of alcohol which exposes them to health
problems such as cancer and heart attack.
The various factors that affect average life expectancy in both developed and developing
countries were also analyzed to find out how they make the average life expectancy to vary into
Document Page
Life Expectancy
the two groups of countries. The factors included maternal mortality, sustainable access to water
and, the gross domestic product per capita income (Krewski, 2009). The following chart
represents the average life expectancy and the GDP per capita in the four countries and the
education enrolment of boys and girls.
Chad Bangladesh China Canada
0
20
40
60
80
100
120
Average Life Expectancy and Education
Enrolment between boys and girl in developed
and developing countries
Average life expectancy
Net enrolment ratio% in secondary education Girl
Net enrolment ratio% in secondary education Boy
The chart above clearly indicates that education enrolment for boys is higher in both developing
and developed countries than the enrolment of girls. The chart also indicates that education
enrolment is higher for developed countries than developing countries. The average life
expectancy for the developed countries is higher in countries with higher education enrolment
than the countries with less education enrolment. This implies that china and Canada has higher
average life expectancy than chad and Bangladesh. This means that education enrolment
determines the life expectancy.
A plot for the average life expectancy and access to sustainable water is provided below.
tabler-icon-diamond-filled.svg

Secure Best Marks with AI Grader

Need help grading? Try our AI Grader for instant feedback on your assignments.
Document Page
Life Expectancy
Chad Bangladesh China Canada
0
20
40
60
80
100
120
average life expectancy and sustainable access to
water
Average Life Expectancy Water access
The chart above shows there is a relationship between accessibility to water and the average life
expectancy. It clearly indicates that china and Canada have higher accessibility to sustainable
water than chad and Bangladesh, which clearly shows that average life expectancy for Canada
and china is higher than that of chad and Bangladesh. This means that accessibility to sustainable
water determines the average life expectancy for the developing and developed countries
(Lomborg, 2013). The more accessibility to sustainable water the higher the life expectancy.
The relationship between the GDP per capita and the average life expectancy was also
investigated and the chart provided below.
Document Page
Life Expectancy
Chad Bangladesh China Canada
0
10
20
30
40
50
60
70
80
90
life expectancy and the gdp per capita income
Average Life Expectancy per capita GDP /1000
country
The chart above clearly indicates that Canada has the highest GDP per capita income while chad
has the smallest. China and Canada have higher GDP than chad and Bangladesh. Similarly,
Canada and china have higher average life expectancy than chad and Bangladesh. This means
that the GDP of a country determines the average life expectancy of a country.
Finally, the investigation between the average life expectancy and the maternal mortality ratio
was done to determine whether the maternal mortality affected the average life expectancy of a
country. The following chart was generated.
Document Page
Life Expectancy
Chad
Bangladesh
China
Canada
0 200 400 600 800 1000 1200
averarge life expectancy and the maternal
mortality rate
Estimate Maternal mortality ratio % Average Life Expectancy
coutry
The bar chart clear indicates that chad has the highest maternal mortality rate while Canada has
the smallest maternal mortality rate. Generally, chad and Bangladesh have the highest maternal
mortality rate compared to Canada and china. This implies that developing countries have high
maternal mortality late compared to developed countries (Wahlbeck et al. 2011). Further, the
maternal mortality rate reduces life expectancy. From the chart china and Canada have less
maternal mortality and a high average life expectancy while chad and Bangladesh have more
maternal mortality rate and low life expectancy.
tabler-icon-diamond-filled.svg

Paraphrase This Document

Need a fresh take? Get an instant paraphrase of this document with our AI Paraphraser
Document Page
Life Expectancy
During the policy formulation, it will be ensure that the challenges have been considered and
addressed to so that the community can benefit from the policies and also achieve maximum life
expectancy for both males and females all over the world (Debas, 2015). The way policies are
going to be formulated is by ensuring the objective is achieved through; creating awareness
among those who use drugs so that they can reduce exposure to killer diseases, in developing
countries, the governments in developing countries should ensure that people have access to
sustainable water and also improve the health facilities so that the maternal mortality rate can be
reduced. The global societies should also consider giving aid to the developing countries to
enhance a rise in the GDP of those countries.
In conclusion, the policies are going to ensure that males can have an increased life
expectancy all over the world, and people in developing countries also have a chance to live
longer like those in the developed countries. It will also be ensured that developing countries
provide clean and sustainable water to its citizens. Additionally, it will also be ensured that
developing countries make health facilities more accessible to all to.
Document Page
Life Expectancy
References
Debas, H.T., Donkor, P., Gawande, A., Jamison, D.T., Kruk, M.E. and Mock, C.N. eds., 2015.
Disease control priorities, (Volume 1): essential surgery. The World Bank.
EXPECTANCY, L., 2010. Triple-class virologic failure in HIV-infected patients undergoing
antiretroviral therapy for up to 10 years. Arch Intern Med, 170(5), pp.410-419.
Krewski, D., 2009. Evaluating the effects of ambient air pollution on life expectancy. Available
from: www.cancer-environnement.fr/LinkClick.aspx?fileticket=YmJAtXamQG0%3D
Lomborg, B., 2013. The skeptical environmentalist:measuring the real state of the world.
Cambridge: Cambridge University Press.
Mukherjee, C., White, H. and Wuyts, M., 2013. Econometrics and data analysis for developing
countries.New York: Routledge.
World Health Organization, 2009. World health statistics 2009. World Health Organization.
Available from:
https://www.who.int/whosis/whostat/2009/en/
Wahlbeck, K., Westman, J., Nordentoft, M., Gissler, M. and Laursen, T.M., 2011. Outcomes of
Nordic mental health systems: life expectancy of patients with mental disorders. The British
Journal of Psychiatry, 199(6), pp.453-458.
chevron_up_icon
1 out of 9
circle_padding
hide_on_mobile
zoom_out_icon
[object Object]

Your All-in-One AI-Powered Toolkit for Academic Success.

Available 24*7 on WhatsApp / Email

[object Object]