Evaluation of Macroeconomic Performance: Australia and USA, BUS700
VerifiedAdded on 2023/04/23
|23
|3682
|114
Report
AI Summary
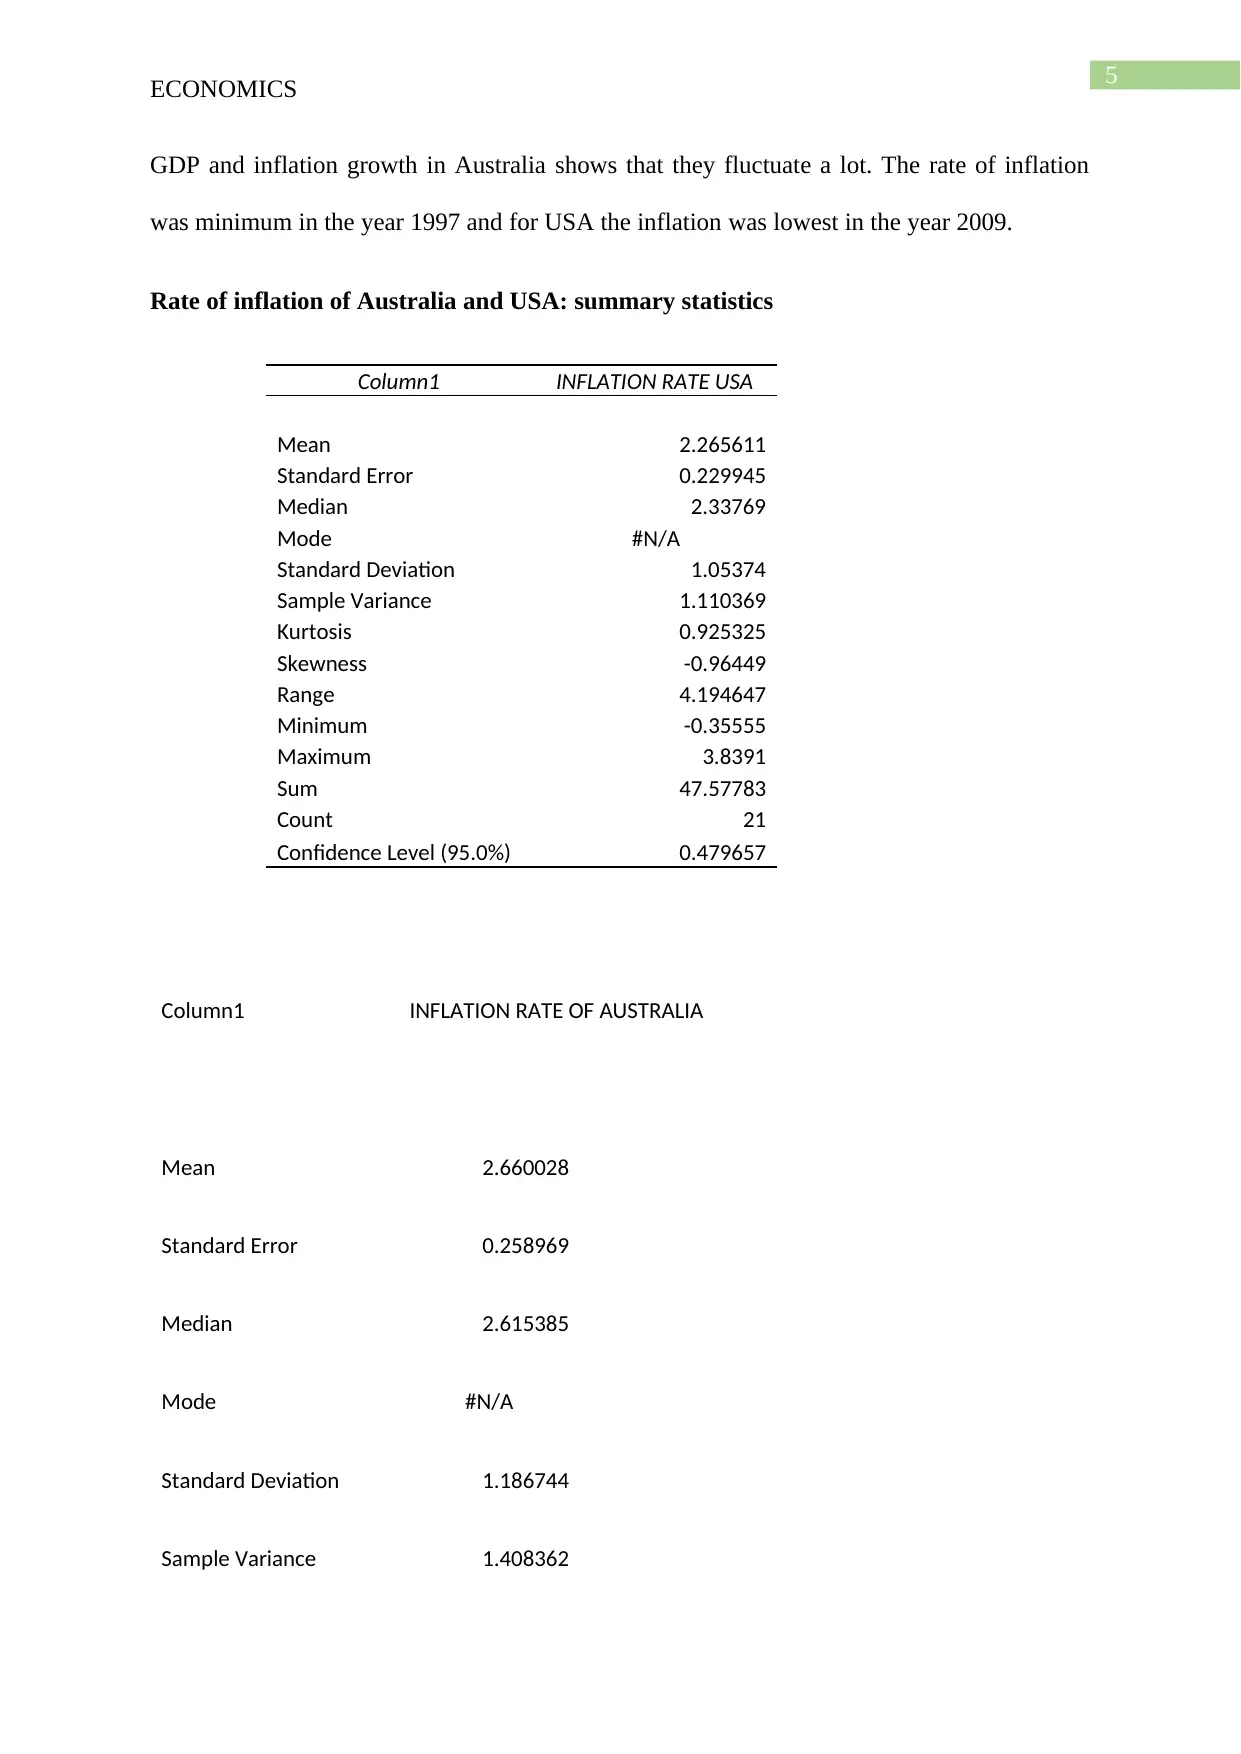
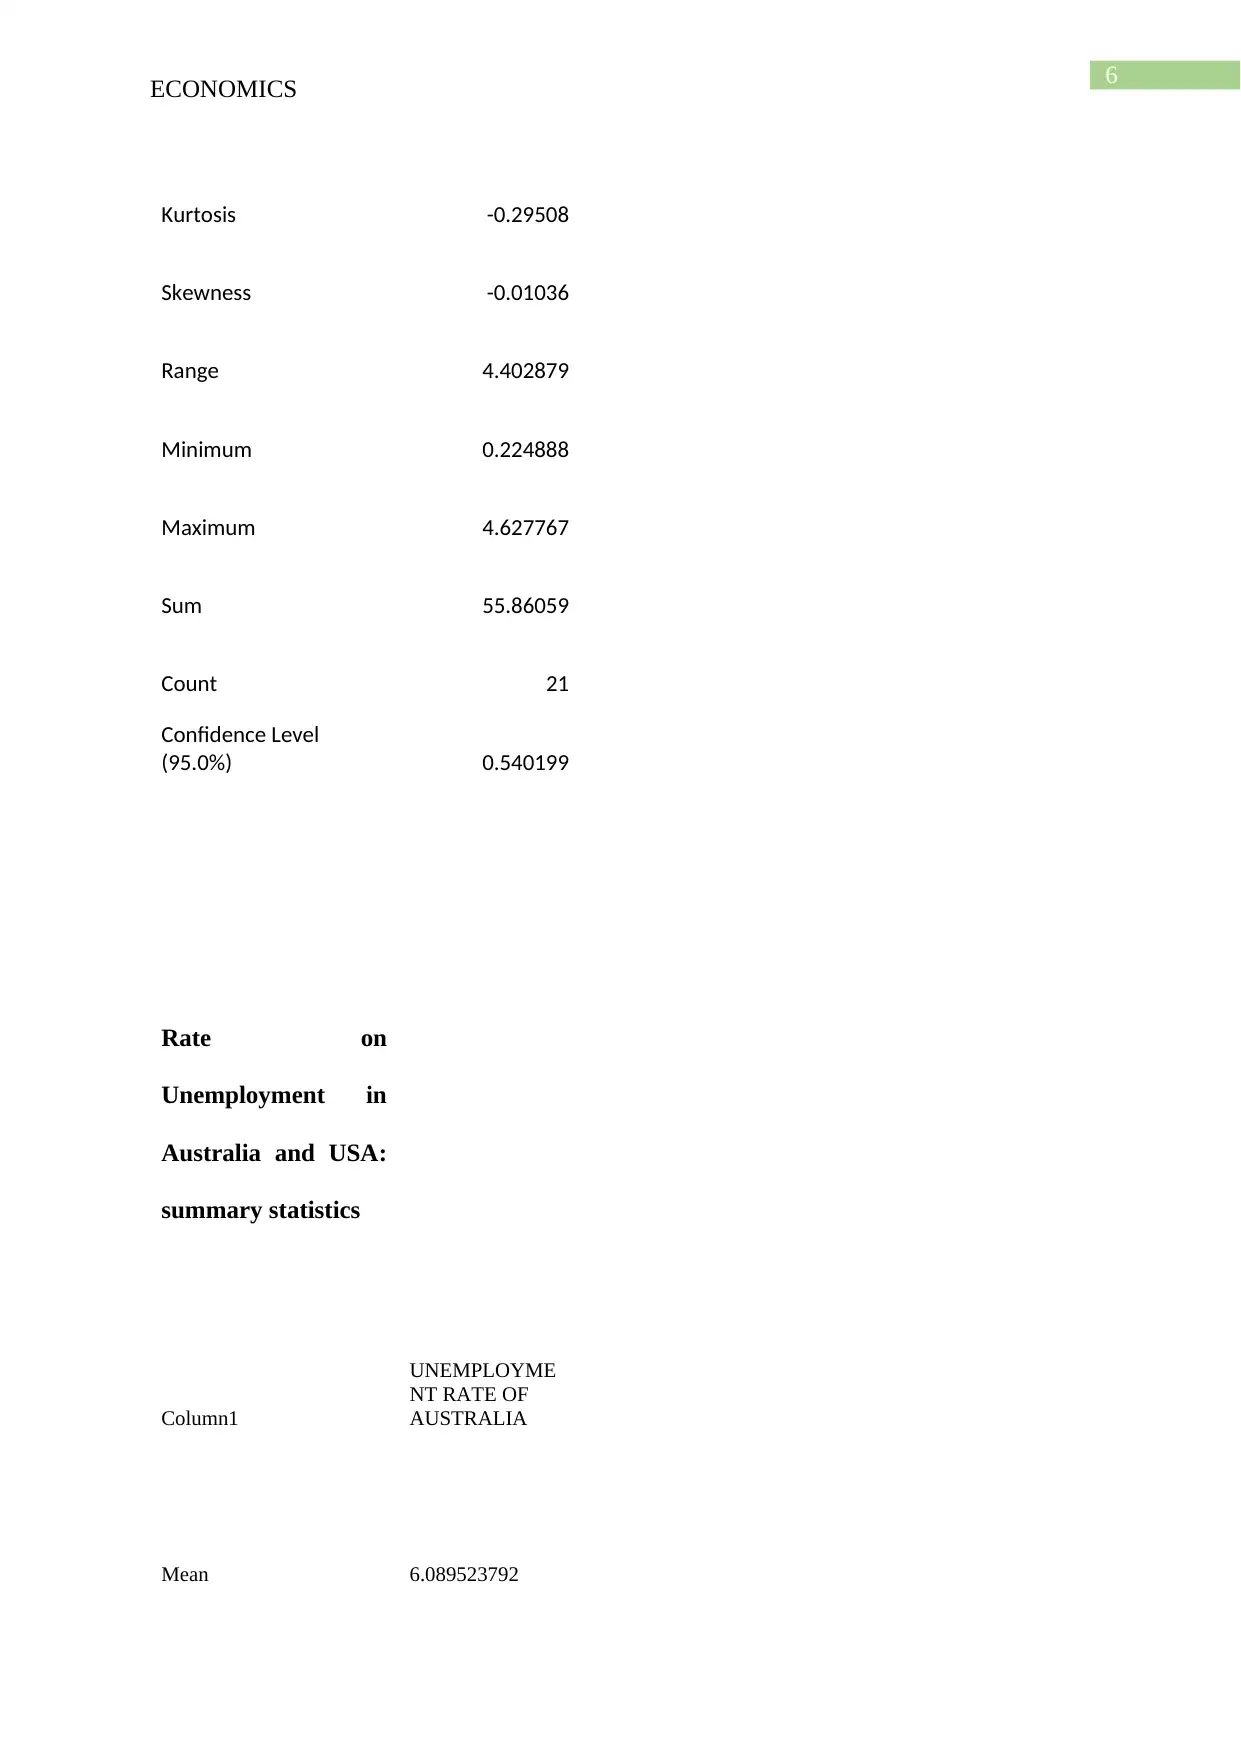
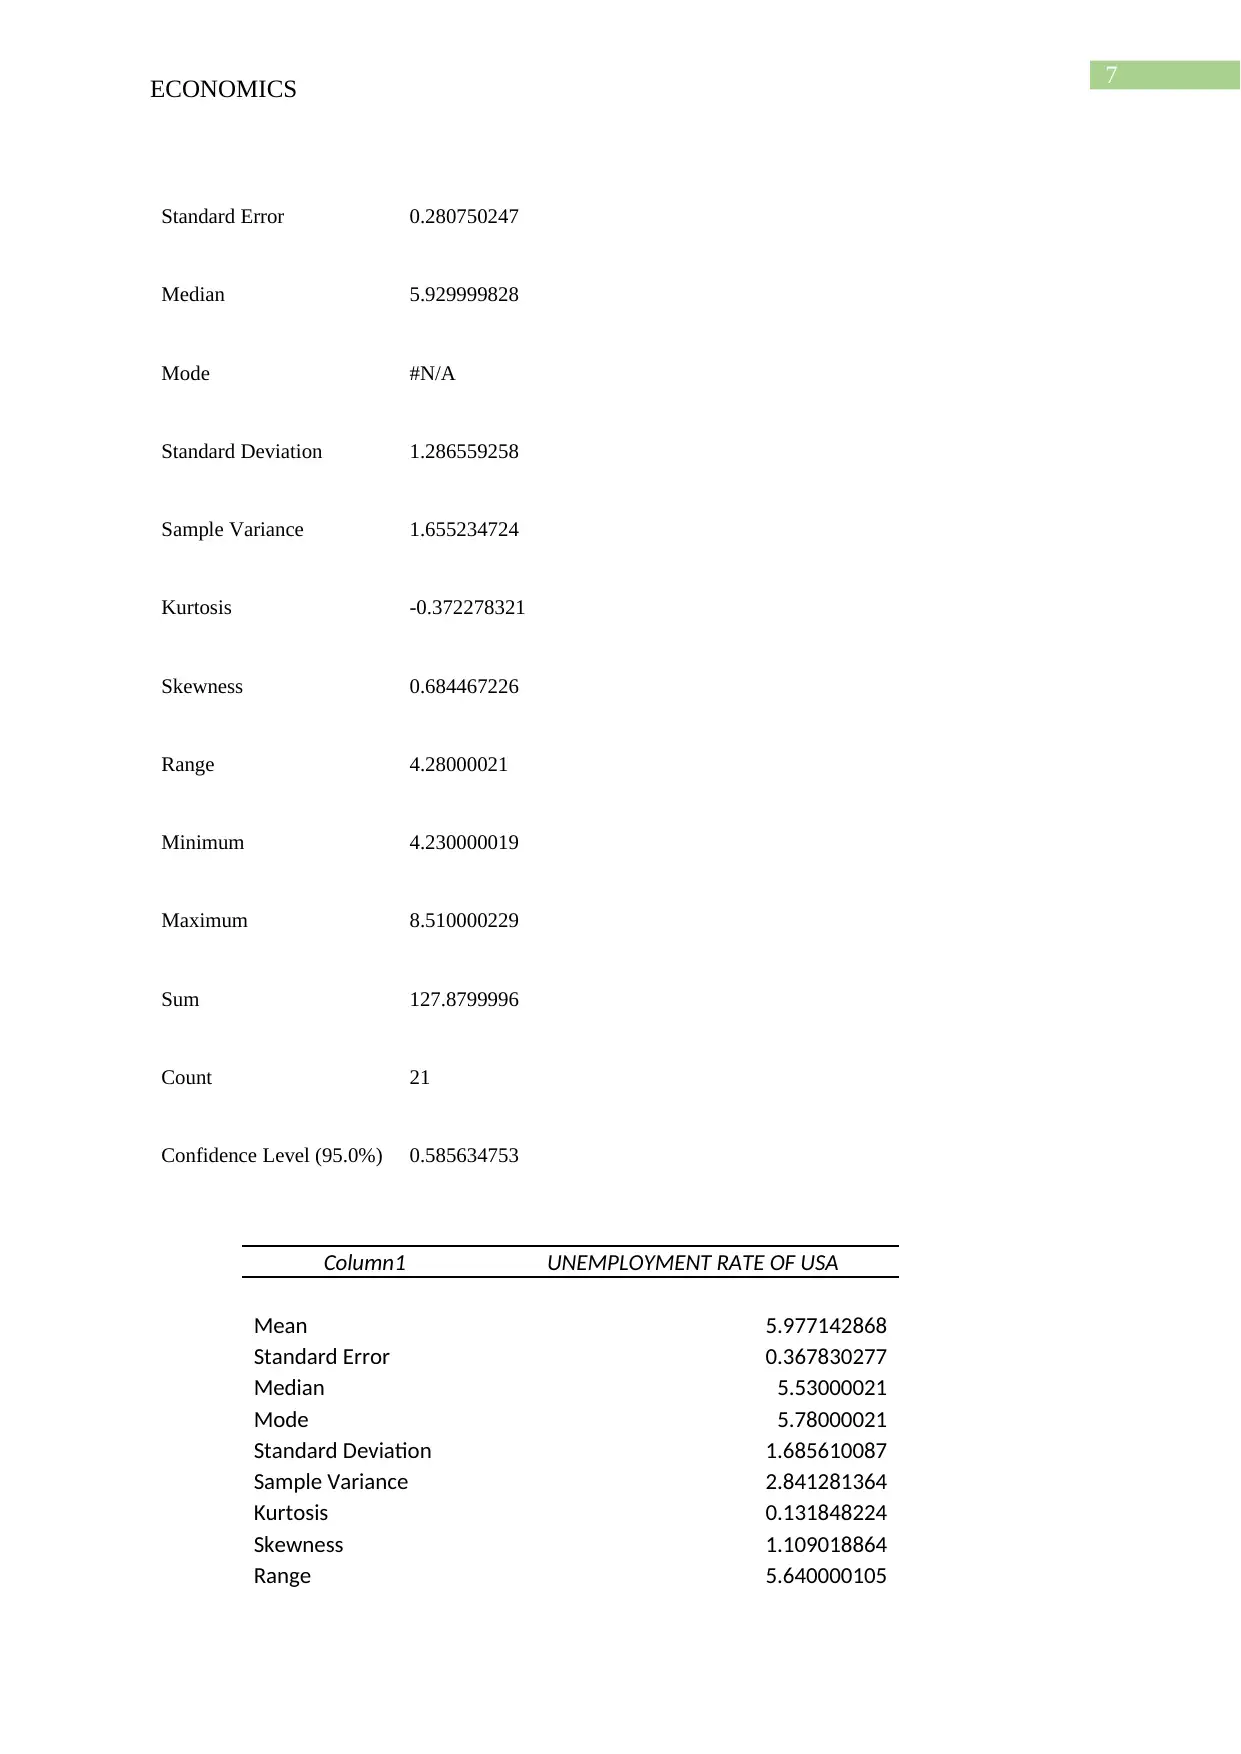
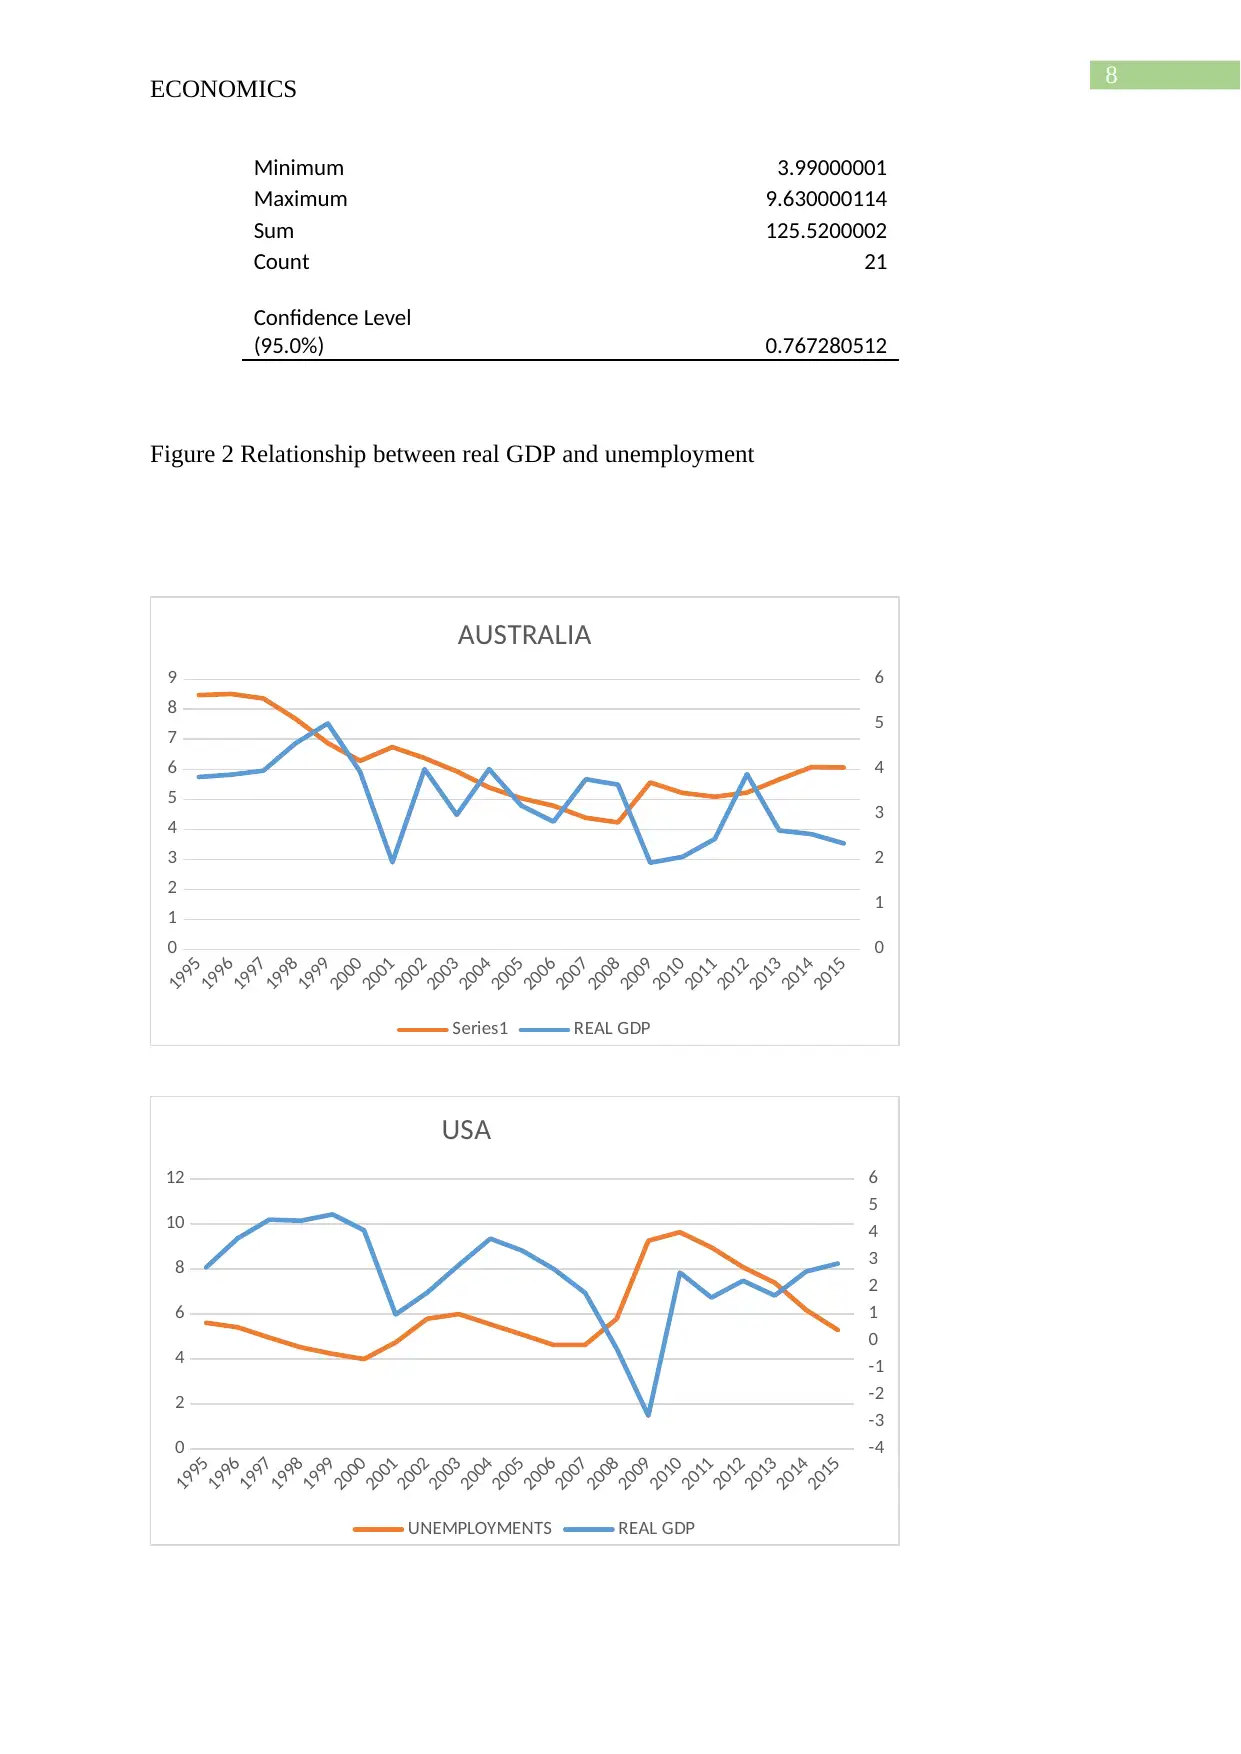
This economics report provides a comprehensive analysis of the macroeconomic performance of Australia and the USA from 1995 to 2015. The report begins with an executive summary and then delves into the summary statistics of various macroeconomic indicators, including real GDP growth, inflation rates, unemployment rates, interest rates, net exports, and exchange rates. The analysis includes pairwise graphs illustrating the relationships between these indicators for both countries. The report also examines the role of government monetary and fiscal policies in influencing economic growth. The study concludes with a detailed discussion of the macroeconomic conditions in Australia during the specified period. The analysis uses data to compare the two economies, providing insights into their respective strengths and weaknesses. The report is well-structured, incorporating tables and graphs to present the data effectively, and offers a thorough evaluation of the macroeconomic landscape of both nations.

1 out of 23
Related Documents


Your All-in-One AI-Powered Toolkit for Academic Success.
+13062052269
info@desklib.com
Available 24*7 on WhatsApp / Email
![[object Object]](/_next/static/media/star-bottom.7253800d.svg)
Copyright © 2020–2025 A2Z Services. All Rights Reserved. Developed and managed by ZUCOL.