Evaluation of the Macroeconomic Performance of Australia and USA
VerifiedAdded on 2023/04/22
|25
|4066
|453
AI Summary
This paper evaluates the macroeconomic performance of Australia and USA from 1995 to 2015. It includes summary statistics of each of the indicators, graphs of macroeconomic indicators, and government policies of Australia and USA. The paper also discusses the macroeconomic outlook of Australia.
Contribute Materials
Your contribution can guide someone’s learning journey. Share your
documents today.

Running head: ECONOMICS
Economics
Name of the student
Name of the university
Author note
Economics
Name of the student
Name of the university
Author note
Secure Best Marks with AI Grader
Need help grading? Try our AI Grader for instant feedback on your assignments.
1
ECONOMICS
Table of Contents
Evaluation of the macroeconomic performance of Australia and USA.....................................2
Introduction................................................................................................................................2
Summary statistics of the macroeconomic indicators of Australia and the United States of
America......................................................................................................................................2
Graphs of macroeconomic indicators.......................................................................................12
Government policies of Australia and USA............................................................................17
Macroeconomic outlook of Australia.......................................................................................19
Conclusion................................................................................................................................21
Reference list............................................................................................................................23

2
ECONOMICS
Evaluation of the macroeconomic performance of Australia and USA
The paper below shows the summary statistics and the graph of the pair wise
macroeconomic factors that affects the Australian as well as the American economy from the
year 1995 to 2015. The summary statistics of each of the indicators shows how they are
related to each other and the graph shows the relationship between the real gross domestic
product and the other factors of the macroeconomy.
Introduction
The macroeconomic factor that relates to the economy at the regional or at the
national level which affects the large population. The macroeconomic factors comprise of the
unemployment, inflation, savings and investments. They are known as the key indicators of
the economic performance which are known to closely monitored by the business,
governments and consumers.
Summary statistics of the macroeconomic indicators of Australia and the United States
of America
Table 1 REAL GDP growth of Australia and USA
Column1
REAL GDP GROWTH RATE OF
AUSTRALIA
Mean -0.07749512
Standard Error 0.221400338
Median -0.081144834
Mode #N/A
Standard Deviation 1.01458381
Sample Variance 1.029380307
Kurtosis -0.008634789
Skewness 0.038330901
Range 4.079999908
Minimum -2.010083353

3
ECONOMICS
Maximum 2.069916555
Sum -1.62739753
Count 21
Confidence Level
(95.0%) 0.461833013
Column1
REAL GDP GROWTH
RATE OF USA
Mean -0.183529247
Standard Error 0.378251666
Median -0.238821158
Mode #N/A
Standard Deviation 1.774157575
Sample Variance 3.1476351
Kurtosis 3.477356076
Skewness 1.019380258
Range 8.423644805
Minimum -3.116194615
Maximum 5.30745019
Sum -4.037643425
Count 22
Confidence Level
(95.0%) 0.786617401
The table above shows that the mean of real gross domestic product of Australia is quite low
when compared to the real GDP of USA. The maximum growth of GDP was 5 percent for
USA. The data that has been collected from the world bank shows that the inflation starts
declining from 1995 to 1999 however, the real gross domestic growth rate remained constant
at 3.8 for the three years. The inflation rate of the united states of America were around 2 to 3
percent for most of the years. Though it can be seen that in the year 2009, it went to negative.
Paraphrase This Document
Need a fresh take? Get an instant paraphrase of this document with our AI Paraphraser

4
ECONOMICS
Column1
INFLATION RATE
USA
Mean 2.265611
Standard Error 0.229945
Median 2.33769
Mode #N/A
Standard Deviation 1.05374
Sample Variance 1.110369
Kurtosis 0.925325
Skewness -0.96449
Range 4.194647
Minimum -0.35555
Maximum 3.8391
Sum 47.57783
Count 21
Confidence Level
(95.0%) 0.479657
Column1 INFLATION RATE OF AUSTRALIA
Mean 2.660028
Standard Error 0.258969
Median 2.615385
Mode #N/A
Standard Deviation 1.186744
Sample Variance 1.408362
Kurtosis -0.29508
Skewness -0.01036
Range 4.402879
Minimum 0.224888
Maximum 4.627767
Sum 55.86059
Count 21
Confidence Level
(95.0%) 0.540199

5
ECONOMICS
Column1 UNEMPLOYMENT RATE OF AUSTRALIA
Mean 6.089523792
Standard Error 0.280750247
Median 5.929999828
Mode #N/A
Standard Deviation 1.286559258
Sample Variance 1.655234724
Kurtosis -0.372278321
Skewness 0.684467226
Range 4.28000021
Minimum 4.230000019
Maximum 8.510000229
Sum 127.8799996
Count 21

6
ECONOMICS
Confidence Level
(95.0%) 0.585634753
Column1 UNEMPLOYMENT RATE OF INFLATION
Mean 5.977142868
Standard Error 0.367830277
Median 5.53000021
Mode 5.78000021
Standard Deviation 1.685610087
Sample Variance 2.841281364
Kurtosis 0.131848224
Skewness 1.109018864
Range 5.640000105
Minimum 3.99000001
Maximum 9.630000114
Sum 125.5200002
Count 21
Confidence Level
(95.0%) 0.767280512
From the summary statistics provided above in the table it can be said that in case of the rate
unemployment rate, it was more than eight percent back in the year 1995. Although it started
to decline and was lowest in 2008, when the rate of unemployment was 4.23 percent. From
the summary statistics it have been found that the mean value of the unemployment level is 6.
The standard error was 0.28. The median of the unemployment rate of Australia is 6.
Secure Best Marks with AI Grader
Need help grading? Try our AI Grader for instant feedback on your assignments.

7
ECONOMICS
Column1 NX OF AUSTRALIA
Mean -1.166077721
Standard Error 0.244954835
Median -1.298144186
Mode #N/A
Standard Deviation 1.122524075
Sample Variance 1.260060298
Kurtosis -1.170943089
Skewness 0.203812415
Range 3.711753595
Minimum -2.744010975
Maximum 0.96774262
Sum -24.48763215
Count 21
Confidence Level
(95.0%) 0.510966833
Column1 NX OF USA
Mean -3.406654491
Standard Error 0.296682946
Median -3.470995189
Mode #N/A
Standard Deviation 1.359572059
Sample Variance 1.848436185
Kurtosis -0.714960116
Skewness 0.139801241
Range 4.392884198
Minimum -5.564038913
Maximum -1.171154714
Sum -71.53974431
Count 21
Confidence Level
(95.0%) 0.618869782
In case of the net exports and imports it can be said from the values that have been provides
in the website that have been provided in the website of the world bank is that the imports
have been always higher when compared to the imports. The exports had been the highest in
the year 2009. On the other hand, the imports had been the highest in the year 2001. The net

8
ECONOMICS
exports had always been negative over the decade. Although in the year 2009 and in 2001,
the exports have been higher than the imports.
ECONOMICS
exports had always been negative over the decade. Although in the year 2009 and in 2001,
the exports have been higher than the imports.

9
ECONOMICS
Column1
CASH RATE FOR
AUSTRALIA
Mean 4.738095
Standard Error 0.313618
Median 4.75
Mode 4.75
Standard Deviation 1.437176
Sample Variance 2.065476
Kurtosis -0.26819
Skewness -0.19797
Range 5.5
Minimum 2
Maximum 7.5
Sum 99.5
Count 21
Confidence Level
(95.0%) 0.654195
Column1
INTERES
T RATE
OF USA
Mean 2.559524
Standard Error 0.52638
Median 1.82
Mode 0.16
Standard Deviation 2.412176
Sample Variance 5.818595
Kurtosis -1.79413
Skewness 0.271431
Range 6.33
Minimum 0.07
Maximum 6.4
Sum 53.75
Count 21
Confidence Level
(95.0%) 1.09801
Paraphrase This Document
Need a fresh take? Get an instant paraphrase of this document with our AI Paraphraser

10
ECONOMICS
While finding out the summary statistics for the cash rate of Australia and the interest rate for
America, it has been found out that the mean of the cash rate was 4 with median and mode
being the same which means the cash rate four percent all over the years. The maximum
amount of cash rate had been 7 percent and the minimum amount was at 2. It is known to
have negative skewness and negative kurtosis
Column1
Exchange rate
OF AUSTRALIA
Mean 0.770531
Standard Error 0.009618
Median 0.7615
Mode 0.7389
Standard Deviation 0.15237
Sample Variance 0.023217
Kurtosis -0.70266
Skewness 0.211558
Range 0.6064
Minimum 0.489
Maximum 1.0954
Sum 193.4033
Count 251
Confidence Level
(95.0%) 0.018942
The mean of the exchange rate of the United states had been
found to be one with the value of the mean and mode being the
similar. The standard deviation is also less than one with
negative kurtosis. While the exchange rate of Australia shows
that it has negative kurtosis and positive skewness with mean
less than one.

11
ECONOMICS
Column1 EXCHANGE RATE OF USA
Mean 1.350850517
Standard Error 0.017442062
Median 1.313197636
Mode 1.353363107
Standard Deviation 0.276334229
Sample Variance 0.076360606
Kurtosis -0.335258987
Skewness 0.564650156
Range 1.132081248
Minimum 0.912908527
Maximum 2.044989775
Sum 339.0634799
Count 251
Confidence Level (95.0%) 0.034352113

12
ECONOMICS
Graphs of macroeconomic indicators
Table 2 Graph of inflation and GDP rate for Australia and USA
1995
1996
1997
1998
1999
2000
2001
2002
2003
2004
2005
2006
2007
2008
2009
2010
2011
2012
2013
2014
2015
0
0.5
1
1.5
2
2.5
3
3.5
4
4.5
5
0
1
2
3
4
5
6
AUSTRALIA
INFLATION REAL GDP
YEAR
(Source: Data.worldbank.org. 2019).
1995
1996
1997
1998
1999
2000
2001
2002
2003
2004
2005
2006
2007
2008
2009
2010
2011
2012
2013
2014
2015
-1
0
1
2
3
4
5
-4
-3
-2
-1
0
1
2
3
4
5
6
USA
INFLATION REAL GDP
YEAR
(Source: Data.worldbank.org. 2019).
Secure Best Marks with AI Grader
Need help grading? Try our AI Grader for instant feedback on your assignments.

13
ECONOMICS
Table 3Graph of unemployment and GDP rate for Australia and USA
1995
1996
1997
1998
1999
2000
2001
2002
2003
2004
2005
2006
2007
2008
2009
2010
2011
2012
2013
2014
2015
0
1
2
3
4
5
6
7
8
9
0
1
2
3
4
5
6
AUSTRALIA
Series1 REAL GDP
(Source: Data.worldbank.org. 2019).
ECONOMICS
Table 3Graph of unemployment and GDP rate for Australia and USA
1995
1996
1997
1998
1999
2000
2001
2002
2003
2004
2005
2006
2007
2008
2009
2010
2011
2012
2013
2014
2015
0
1
2
3
4
5
6
7
8
9
0
1
2
3
4
5
6
AUSTRALIA
Series1 REAL GDP
(Source: Data.worldbank.org. 2019).

14
ECONOMICS
1995
1996
1997
1998
1999
2000
2001
2002
2003
2004
2005
2006
2007
2008
2009
2010
2011
2012
2013
2014
2015
0
2
4
6
8
10
12
-4
-3
-2
-1
0
1
2
3
4
5
6
USA
UNEMPLOYMENTS REAL GDP
(Source: Data.worldbank.org. 2019).
ECONOMICS
1995
1996
1997
1998
1999
2000
2001
2002
2003
2004
2005
2006
2007
2008
2009
2010
2011
2012
2013
2014
2015
0
2
4
6
8
10
12
-4
-3
-2
-1
0
1
2
3
4
5
6
USA
UNEMPLOYMENTS REAL GDP
(Source: Data.worldbank.org. 2019).

15
ECONOMICS
Table 4 Graph of exchange rate and GDP rate for Australia and USA
1995
1996
1997
1998
1999
2000
2001
2002
2003
2004
2005
2006
2007
2008
2009
2010
2011
2012
2013
2014
2015
0
1
2
3
4
5
6
0.0000
0.2000
0.4000
0.6000
0.8000
1.0000
1.2000
AUSTRALIA
REAL GDP EXCHANGE RATE
(Source: Data.worldbank.org. 2019).
-4
-3
-2
-1
0
1
2
3
4
5
6
0
0.5
1
1.5
2
2.5
USA
REAL GDP EXCHANGE RATE
(Source: Data.worldbank.org. 2019).
Paraphrase This Document
Need a fresh take? Get an instant paraphrase of this document with our AI Paraphraser

16
ECONOMICS
Table 5 Graph of interest rate and GDP rate for Australia and USA
1995
1996
1997
1998
1999
2000
2001
2002
2003
2004
2005
2006
2007
2008
2009
2010
2011
2012
2013
2014
2015
0
1
2
3
4
5
6
7
8
AUSTRALIA
REAL GDP INTEREST RATE
(Source: Reserve Bank of Australia. 2019).
1995
1996
1997
1998
1999
2000
2001
2002
2003
2004
2005
2006
2007
2008
2009
2010
2011
2012
2013
2014
2015
-4
-2
0
2
4
6
8
USA
REAL GDP INTEREST RATE
(Source: Federalreserve.gov. 2019).

17
ECONOMICS
Government policies of Australia and USA
The two policies which the government will be employing for influencing the
economic growth and its indicators are the monetary and the fiscal policies. In case of
monetary policy when there will be changes in the interest rate it will be affecting the money
supply. In order to increase the spending in economy along with encouraging the economic
growth, the government will be losing the rate of interest. The government can sometimes
lower the rate of interest for increasing the money supply. Although this can lead to inflation.
When the economy will be growing, there will be huge amount of inflation. However, when
the supply of money will be lower it will be discouraging the spending. The Reserve bank of
Australia is mostly said to be responsible or the monetary policy of Australia where the
policy involve es setting the cash rate on the overnight loans in the money market. For
determining the monetary policy it is main duty of the Bank for maintain the stability of the
price , full employment along with maintain the economic prosperity and welfare of the
people of Australia. For achieving the objectives, the Reserve Bank of Australia will be
achieving the inflation target and also seeks to keep the inflation of the consumer price to 2 to
3 percent on average over the medium term. In Australia, the monetary policy is mainly about
the rate of interest which mainly influences the aggregate demand, inflation and employment.
The Reserve Bank of Australia is also mostly responsible for the monetary policy in
Australia and will be setting the nation’s official rate of interest which referred to as the cash
rate. The cash rate therefore known to affect the other interest rates in the economy which in
turn will be influencing the activity in the economy , inflation and employment. The main
objectives of the monetary policy of Australia is to stabilize the Australian currency,
maintaining full employment in Australia along with maintenance of economic prosperity
and welfare of the Australian people. On the other hand, the monetary policy in the united

18
ECONOMICS
nations will be comprising of the actions of the Federal Reserves and communications which
will be helping to promote the maximum employment, stable prices and moderate long term
rate of interest. These are the three economic goals which have been instructed by the
congress to the Federal Reserve for pursuing. The Federal Reserves also known to conduct
the monetary policy of the nation by managing the level of the short term rate of interest
which is known to influence the overall activity and credit cost in the economy. The
monetary policy will also be directly affecting the short term interest rates and affect the long
term rate of interest indirectly. With the help of these channels the monetary policies of the
United States of America will be influencing the spending of the household, business
investment, employment, production of the United States. The tools of the monetary policy
include open market operations, discount rate, reserve requirements and many more
(Federalreserve.gov. 2019). Therefore, the central bank of America which is the Federal
Reserve states that monetary policy will be influencing the amount of money and credit in the
economy of the United States of America.
On the other hand, fiscal policies are the spending by the government along with the
tax policies for influencing the conditions of the macroeconomy which comprises of the
aggregate demand, employment, economic growth and rate of inflation. Therefore, it can be
said that the objectives of the fiscal policies are to supply the public goods which will be
contributing to the welfare of the population. It will also stabilize the cyclical fluctuations of
the economy and for this reason it can be stated that the budget is the main tool for achieving
this particular objective. For balancing the budget fiscal policy can be treated as one of the
main tools. In case of the united states it can be said that fiscal policy will be directed by both
the executive and the legislative branches. In case of the executive branch two of the most
influential offices are usually belong to the president.
Secure Best Marks with AI Grader
Need help grading? Try our AI Grader for instant feedback on your assignments.

19
ECONOMICS
The government of the united states known to have spent more money than taking in.
the national debt at that time was around $1 billion. the instruments of the fiscal policy will
be quite effective in case of poverty reduction and promoting the living standards of the
community. Fiscal policies are mostly used for stabilizing the economy over the course of the
business cycle. When there will be change in the composition of the taxes along with the
spending of the government it will be affecting the macroeconomic distribution like income
distribution, saving and investment and the level of the economic activity which can be stated
with the help of aggregate demand. There are three different types of fiscal policies which are
neutral fiscal policy, expansionary fiscal policy and the contractionary fiscal policy. In case
of the contractionary fiscal policies it will be taking place when the deficit spending of the
government will be quite lower than usual. On the other hand, when the spending of the
government will be exceeding the revenue of the tax , the expansionary fiscal policy will be
taking place. Neutral fiscal policy will be taking place when the economy w3ill be neither in
a recession nor in a boom.
Macroeconomic outlook of Australia
From the above graphs its can be seen that there is an inverse relationship between
the growth of gross domestic and the rate of inflation in case of Australia in the first few
years. The data that has been collected from the world bank shows that the inflation starts
declining from 1995 to 1999 however, the real gross domestic growth rate remained constant
at 3.8 for the three years. The inflation rate of the united states of America were around 2 to 3
percent for most of the years. Though it can be seen that in the year 2009, it went to negative.
The real gross domestic product had been around three to four percent for the decade.
However it went down in the year 2008 and 2001.
20
ECONOMICS
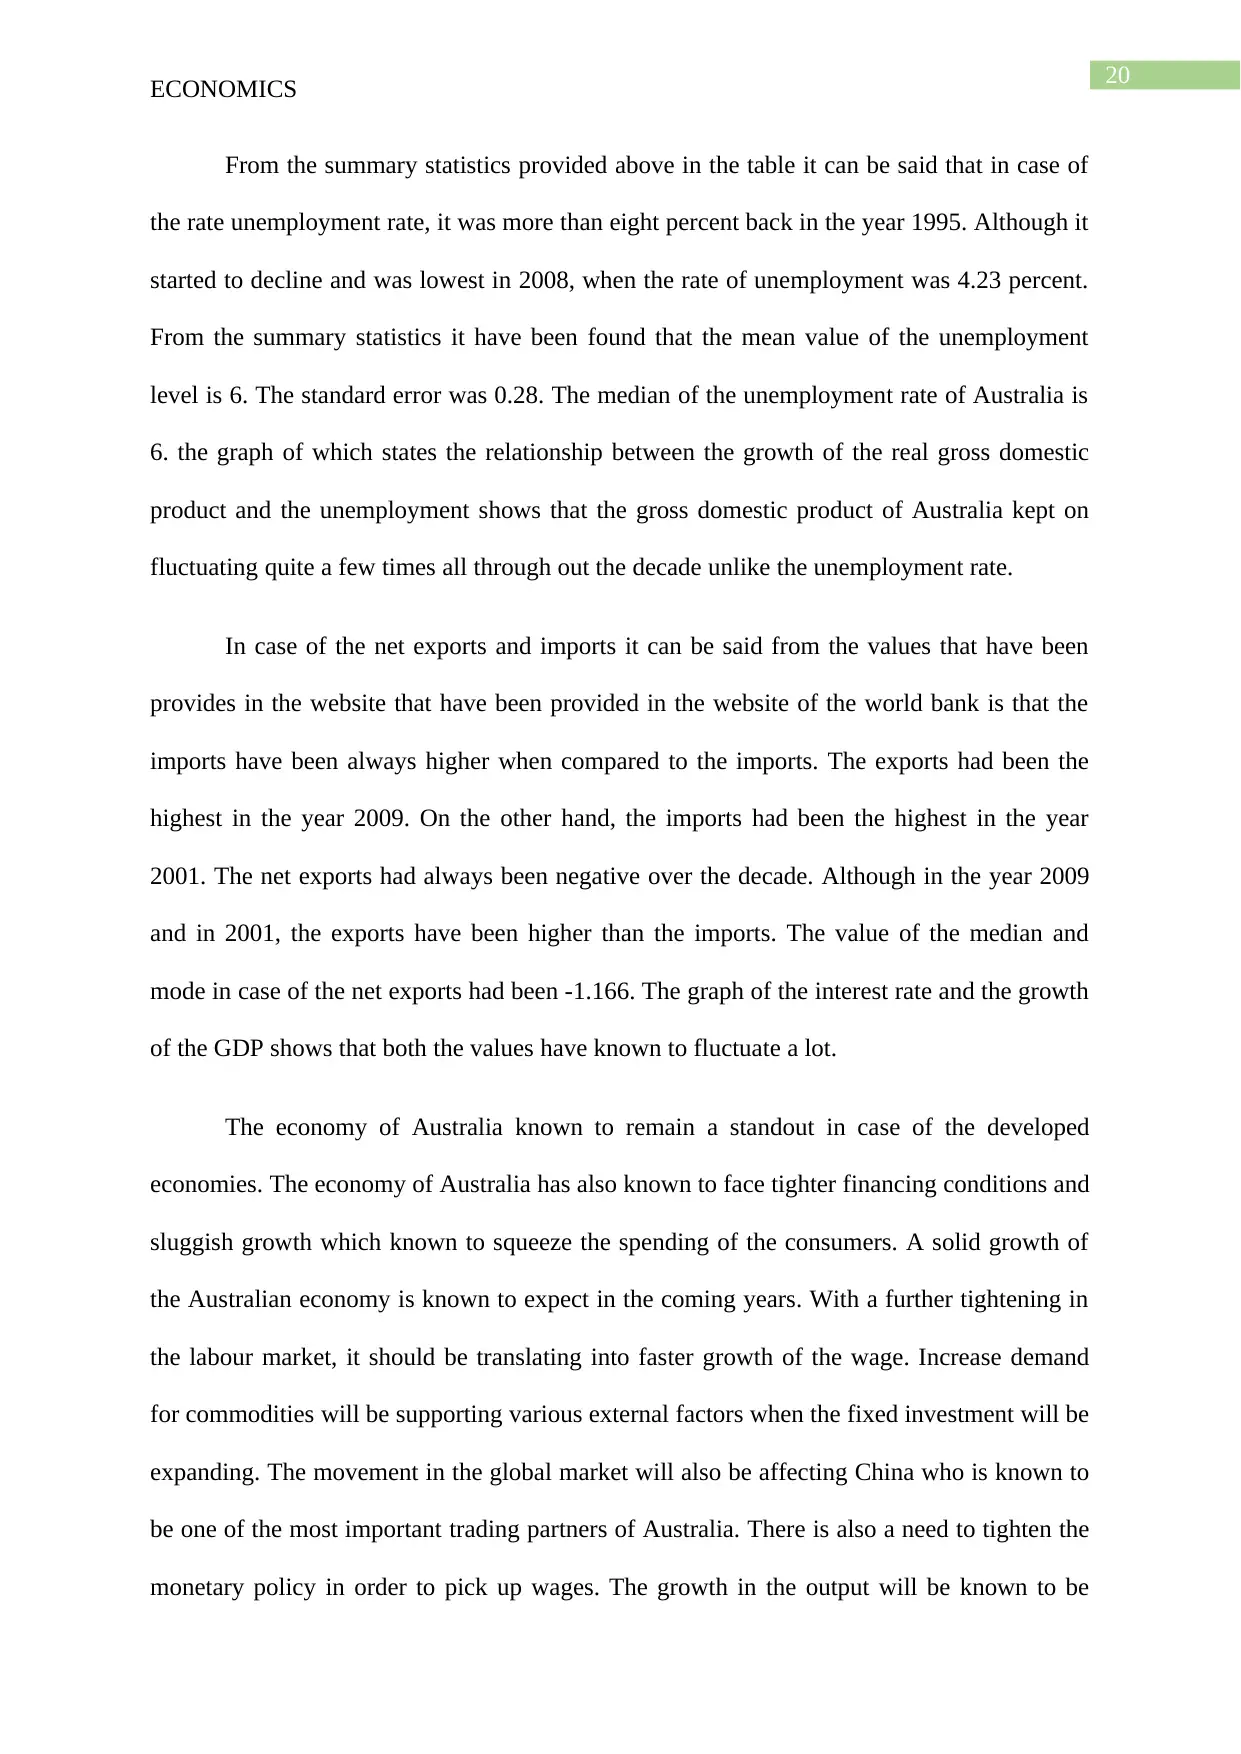
From the summary statistics provided above in the table it can be said that in case of
the rate unemployment rate, it was more than eight percent back in the year 1995. Although it
started to decline and was lowest in 2008, when the rate of unemployment was 4.23 percent.
From the summary statistics it have been found that the mean value of the unemployment
level is 6. The standard error was 0.28. The median of the unemployment rate of Australia is
6. the graph of which states the relationship between the growth of the real gross domestic
product and the unemployment shows that the gross domestic product of Australia kept on
fluctuating quite a few times all through out the decade unlike the unemployment rate.
In case of the net exports and imports it can be said from the values that have been
provides in the website that have been provided in the website of the world bank is that the
imports have been always higher when compared to the imports. The exports had been the
highest in the year 2009. On the other hand, the imports had been the highest in the year
2001. The net exports had always been negative over the decade. Although in the year 2009
and in 2001, the exports have been higher than the imports. The value of the median and
mode in case of the net exports had been -1.166. The graph of the interest rate and the growth
of the GDP shows that both the values have known to fluctuate a lot.
The economy of Australia known to remain a standout in case of the developed
economies. The economy of Australia has also known to face tighter financing conditions and
sluggish growth which known to squeeze the spending of the consumers. A solid growth of
the Australian economy is known to expect in the coming years. With a further tightening in
the labour market, it should be translating into faster growth of the wage. Increase demand
for commodities will be supporting various external factors when the fixed investment will be
expanding. The movement in the global market will also be affecting China who is known to
be one of the most important trading partners of Australia. There is also a need to tighten the
monetary policy in order to pick up wages. The growth in the output will be known to be
ECONOMICS
From the summary statistics provided above in the table it can be said that in case of
the rate unemployment rate, it was more than eight percent back in the year 1995. Although it
started to decline and was lowest in 2008, when the rate of unemployment was 4.23 percent.
From the summary statistics it have been found that the mean value of the unemployment
level is 6. The standard error was 0.28. The median of the unemployment rate of Australia is
6. the graph of which states the relationship between the growth of the real gross domestic
product and the unemployment shows that the gross domestic product of Australia kept on
fluctuating quite a few times all through out the decade unlike the unemployment rate.
In case of the net exports and imports it can be said from the values that have been
provides in the website that have been provided in the website of the world bank is that the
imports have been always higher when compared to the imports. The exports had been the
highest in the year 2009. On the other hand, the imports had been the highest in the year
2001. The net exports had always been negative over the decade. Although in the year 2009
and in 2001, the exports have been higher than the imports. The value of the median and
mode in case of the net exports had been -1.166. The graph of the interest rate and the growth
of the GDP shows that both the values have known to fluctuate a lot.
The economy of Australia known to remain a standout in case of the developed
economies. The economy of Australia has also known to face tighter financing conditions and
sluggish growth which known to squeeze the spending of the consumers. A solid growth of
the Australian economy is known to expect in the coming years. With a further tightening in
the labour market, it should be translating into faster growth of the wage. Increase demand
for commodities will be supporting various external factors when the fixed investment will be
expanding. The movement in the global market will also be affecting China who is known to
be one of the most important trading partners of Australia. There is also a need to tighten the
monetary policy in order to pick up wages. The growth in the output will be known to be

21
ECONOMICS
moderate in nature in the coming years since the capacity constraints will be tightening.
There will be also a slow growth in the export market and the households will also become
less willing to draw down savings. While comparing the graphs of Australia and USA with
real gross domestic product and interest rate, it can be seen that in both the cases as the
growth in the GDP is quite similar with the growth of the rate of ineptest for both the
countries. From the year 1995 to 2015, it can be predicted that with the rise in the interest rate
the growth of the gross domestic product will also rise. While finding out the summary
statistics for the cash rate of Australia and the interest rate for America, it has been found out
that the mean of the cash rate was 4 with median and mode being the same which means the
cash rate four percent all over the years.
The maximum amount of cash rate had been 7 percent and the minimum amount was
at 2. It is known to have negative skewness and negative kurtosis. While coming to the
measurement of the interest rate of America, it can be said that the interest rate in case of the
united states of America had been quite low. The standard error had been found to be at 0.5.
the variance is known to be around six percent wit median and mode to be around one. This
states that the cash rate of Australia is little bit higher than the interest rate of the United
States. The mean of the exchange rate of the United states had been found to be one with the
value of the mean and mode being the similar. The standard deviation is also less than one
with negative kurtosis. While the exchange rate of Australia shows that it has negative
kurtosis and positive skewness with mean less than one. Similar trend has been in the case of
median and mode. The variance is very low at 0.02. The maximum exchange rate was one
and the minimum was zero.
Paraphrase This Document
Need a fresh take? Get an instant paraphrase of this document with our AI Paraphraser

22
ECONOMICS
Conclusion
The economy of Australia known to have experienced quite a favourable global
condition where there will be strong domestic demand along with population growth.
Although presence of global uncertainty along with high debt can weaken the prospect of the
growth. The recent growth in the economy had been driven by the household consumption
along with the spending of the government. The continuous growth of the population had also
prompted the governments to increase their spending on transport along with various other
infrastructures specially in case of New South Wales and Victoria.
23
ECONOMICS
Reference list
Abs.gov.au. (2019). Australian Bureau of Statistics, Australian Government. [online]
Available at: http://www.abs.gov.au [Accessed 21 Jan. 2019].
Ally, M., Gardiner, M. and Lane, M., 2016. The potential impact of digital currencies on the
Australian economy. arXiv preprint arXiv:1606.02462.
Data.worldbank.org. (2019). World Bank Open Data | Data. [online] Available at:
https://data.worldbank.org/ [Accessed 21 Jan. 2019].
Federalreserve.gov. (2019). Federal Reserve Board - Monetary Policy. [online] Available at:
https://www.federalreserve.gov/monetarypolicy.htm [Accessed 21 Jan. 2019].
Kishor, N.K. and Marfatia, H.A., 2017. The dynamic relationship between housing prices and
the macroeconomy: Evidence from OECD countries. The Journal of Real Estate Finance and
Economics, 54(2), pp.237-268.
Manalo, J., Perera, D. and Rees, D.M., 2015. Exchange rate movements and the Australian
economy. Economic Modelling, 47, pp.53-62.
Reserve Bank of Australia. (2019). Reserve Bank of Australia. [online] Available at:
https://www.rba.gov.au/ [Accessed 21 Jan. 2019].
Schroeder, S., 2018. Just how fragile is the Australian economy?. Australian Options, (87),
p.18.

24
ECONOMICS
ECONOMICS
1 out of 25
Related Documents


Your All-in-One AI-Powered Toolkit for Academic Success.
+13062052269
info@desklib.com
Available 24*7 on WhatsApp / Email
![[object Object]](/_next/static/media/star-bottom.7253800d.svg)
Unlock your academic potential
© 2024 | Zucol Services PVT LTD | All rights reserved.