Managerial Finance: Ratio Analysis of Tesco and Sainsbury's
Added on 2022-12-30
19 Pages4050 Words61 Views
MANAGERIAL
FINANCE
FINANCE
Table of Contents
INTRODUCTION...........................................................................................................................1
PORTFOLIO 1.................................................................................................................................1
Compare the performance by ratio analysis of two company .....................................................1
Interpretation of financial performance and position of the business entity on the basis of ratio
and chart.......................................................................................................................................3
Recommendation on the poor performance ..............................................................................11
Limitations of the ratio analysis ................................................................................................12
PORTFOLIO 2...............................................................................................................................13
Use of the investment appraisal techniques for the adoption of the two alternatives ...............13
Limitation of the investment appraisal techniques....................................................................15
CONCLUSION..............................................................................................................................15
REFERENCES .............................................................................................................................16
INTRODUCTION
Managerial finance means assessing of the evaluation of the financial statements for
determine the performance of the company in the market by seeing the significance of the data,
they also provide financial information which help in prevent the losses and help in improvement
of the organization planning. In simple terms it means the combination of the corporate finance
and managerial accounting for maintaining the business strategies for control their effectiveness
working and monitoring their day to day activities. It is used by all firms for apply the financial
techniques at different level of department (Altaf and Ahmad, 2019). This report is based on the
two company TESCO AND SAINSBURY'S. Tesco Plc is the British multinational groceries and
general merchandise retailer headquarter in Welwyn Garden city, England. It is the third largest
retailer in the world which is determine by the revenue. Sainsbury's is also the second largest
chain in the supermarket in the United kingdom, it has 16% share in the market among the
sector. It became the largest retailer of groceries. In this report there is the ratio analysis of both
the firm is determine to get the exact performance and limitations of the ratio also. There is the
limitation of investment appraisal techniques is also discussed.
PORTFOLIO 1
Compare the performance by ratio analysis of two company
Ratio analysis means measure and analysis of the performance in the minds of investor
and analyst so they can invest their investment to get better return in the future. Through this
they can easily know the liquidity, efficiency and profitability position of the entity. This is very
important element for the evaluation of the financial statements. This is very useful in deciding
which firm is profitable or which is not. It is also helpful in evaluation of the detailed operation
in the organization.
There is the analysis of both entity Tesco and Sainsbury's to determine which is best for
the investor and which give higher profit in the long run, to maintain their brand image in the
minds of them (Hotchkiss and Wang, 2019).
1
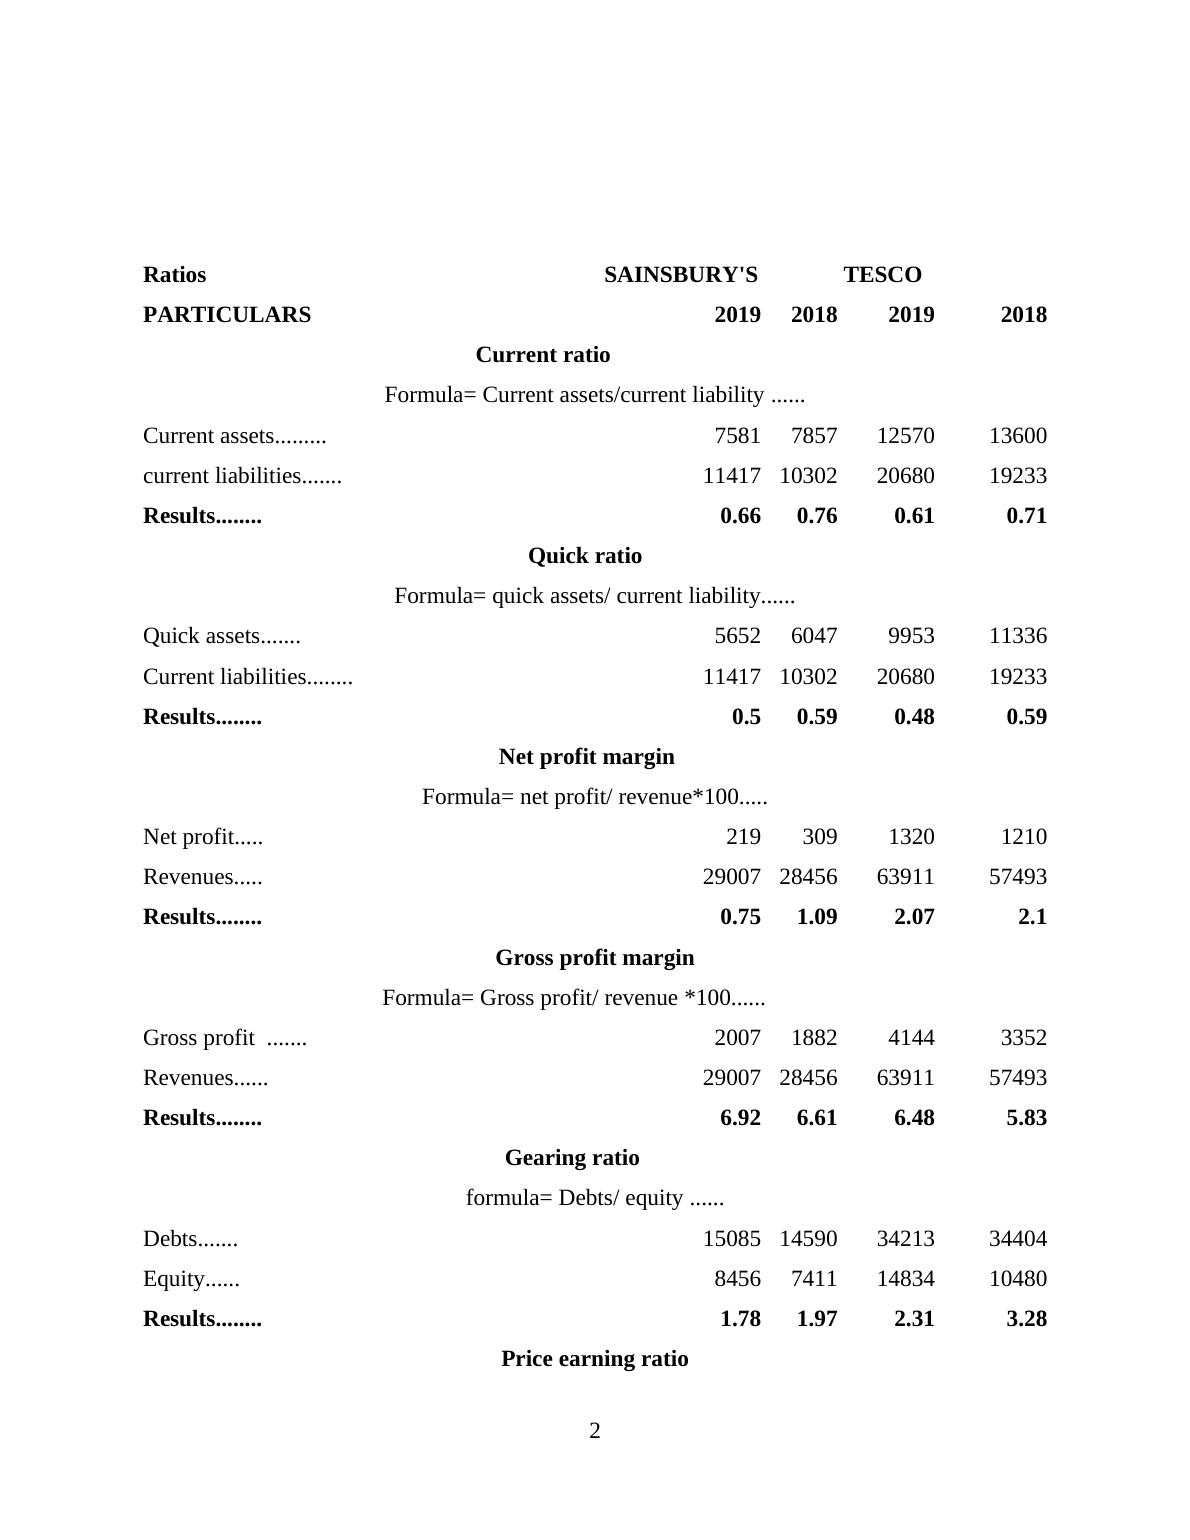
Ratios SAINSBURY'S TESCO
PARTICULARS 2019 2018 2019 2018
Current ratio
Formula= Current assets/current liability ......
Current assets......... 7581 7857 12570 13600
current liabilities....... 11417 10302 20680 19233
Results........ 0.66 0.76 0.61 0.71
Quick ratio
Formula= quick assets/ current liability......
Quick assets....... 5652 6047 9953 11336
Current liabilities........ 11417 10302 20680 19233
Results........ 0.5 0.59 0.48 0.59
Net profit margin
Formula= net profit/ revenue*100.....
Net profit..... 219 309 1320 1210
Revenues..... 29007 28456 63911 57493
Results........ 0.75 1.09 2.07 2.1
Gross profit margin
Formula= Gross profit/ revenue *100......
Gross profit ....... 2007 1882 4144 3352
Revenues...... 29007 28456 63911 57493
Results........ 6.92 6.61 6.48 5.83
Gearing ratio
formula= Debts/ equity ......
Debts....... 15085 14590 34213 34404
Equity...... 8456 7411 14834 10480
Results........ 1.78 1.97 2.31 3.28
Price earning ratio
2
End of preview
Want to access all the pages? Upload your documents or become a member.
Related Documents
Comparison of Tesco and Sainsbury’s Financial Performance through Ratio Analysislg...
|17
|3984
|58
Managerial Finance: Ratio Analysis and Investment Appraisallg...
|18
|4416
|1
Comparison of Financial Ratios: Tesco vs Sainsbury'slg...
|20
|3867
|435
Managerial Finance: Evaluating Financial Performance and Investment Appraisallg...
|17
|3768
|67
Managerial Finance: Analysis of Tesco and Sainsbury Plclg...
|17
|3747
|62
Portfolio Management in Sainsbury and Tescolg...
|20
|4221
|83