Ratio Analysis of Tesco and Sainsburry: Managerial Finance
Added on 2022-12-30
18 Pages3767 Words40 Views
Managerial
Finance
Finance
Table of Contents
INTRODUCTION...........................................................................................................................3
PORTFOLIO 1.................................................................................................................................3
Ratio calculation of Tesco and Sainsburry for the year 2018 and 2019:.....................................3
Ratio analysis and interpretation:.................................................................................................5
Limitations of ratio analysis:.....................................................................................................11
PORTFOLIO 2...............................................................................................................................11
Investment appraisal techniques:...............................................................................................11
Limitations of investment appraisal techniques:........................................................................12
CONCLUSION..............................................................................................................................12
REFERENCES..............................................................................................................................14
INTRODUCTION
Finance is the activity for arranging funds and acquiring funds for running business
activities. It helps in distributing funds into the business activities in other departments so that
they can work because every activities needed for money. So finance is all about fulfill the needs
of all other departments by providing money. Managerial finance is about planning, organising,
analysing, managing, controlling financial activiti8es within an organisation by better utilisation
of resources (Carbonell and Rodriguez Escudero 2016). Management is about to manage
activities so that firms can accomplish its business objectives. The company which is selected for
this report is Tesco and Sainsburry. Tesco is the British retail based company, it was founded in
year 1919, headquarter situated in UK. Sainsburry has large number of super market chain for
retail sector, it was founded in 1922, headquarter situated in London. This report covers topics
such as ratio calculation, ratio analysis of both companies, limitations of ratio analysis. Apart
from this its also covers topics such as investment appraisal techniques and limitations of
investment appraisal techniques (Cruz and Justo, 2017).
PORTFOLIO 1
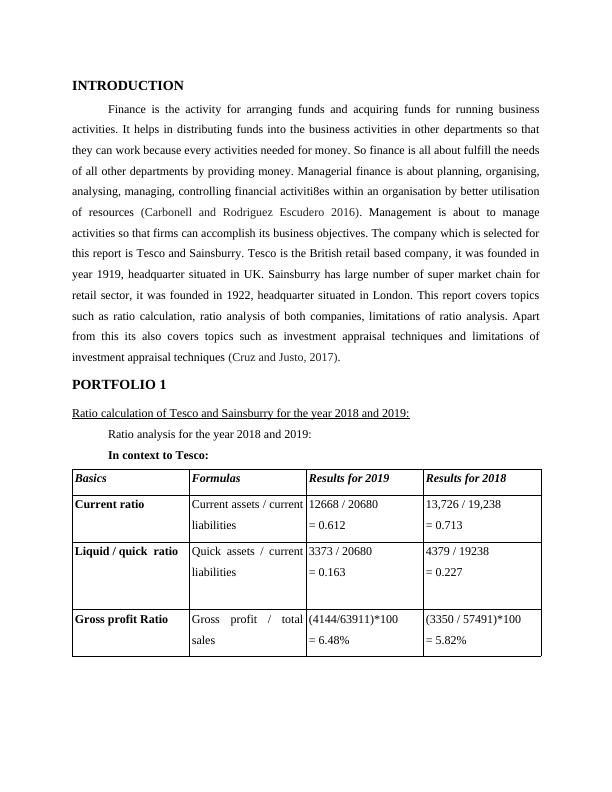
Ratio calculation of Tesco and Sainsburry for the year 2018 and 2019:
Ratio analysis for the year 2018 and 2019:
In context to Tesco:
Basics Formulas Results for 2019 Results for 2018
Current ratio Current assets / current
liabilities
12668 / 20680
= 0.612
13,726 / 19,238
= 0.713
Liquid / quick ratio Quick assets / current
liabilities
3373 / 20680
= 0.163
4379 / 19238
= 0.227
Gross profit Ratio Gross profit / total
sales
(4144/63911)*100
= 6.48%
(3350 / 57491)*100
= 5.82%
Finance is the activity for arranging funds and acquiring funds for running business
activities. It helps in distributing funds into the business activities in other departments so that
they can work because every activities needed for money. So finance is all about fulfill the needs
of all other departments by providing money. Managerial finance is about planning, organising,
analysing, managing, controlling financial activiti8es within an organisation by better utilisation
of resources (Carbonell and Rodriguez Escudero 2016). Management is about to manage
activities so that firms can accomplish its business objectives. The company which is selected for
this report is Tesco and Sainsburry. Tesco is the British retail based company, it was founded in
year 1919, headquarter situated in UK. Sainsburry has large number of super market chain for
retail sector, it was founded in 1922, headquarter situated in London. This report covers topics
such as ratio calculation, ratio analysis of both companies, limitations of ratio analysis. Apart
from this its also covers topics such as investment appraisal techniques and limitations of
investment appraisal techniques (Cruz and Justo, 2017).
PORTFOLIO 1
Ratio calculation of Tesco and Sainsburry for the year 2018 and 2019:
Ratio analysis for the year 2018 and 2019:
In context to Tesco:
Basics Formulas Results for 2019 Results for 2018
Current ratio Current assets / current
liabilities
12668 / 20680
= 0.612
13,726 / 19,238
= 0.713
Liquid / quick ratio Quick assets / current
liabilities
3373 / 20680
= 0.163
4379 / 19238
= 0.227
Gross profit Ratio Gross profit / total
sales
(4144/63911)*100
= 6.48%
(3350 / 57491)*100
= 5.82%
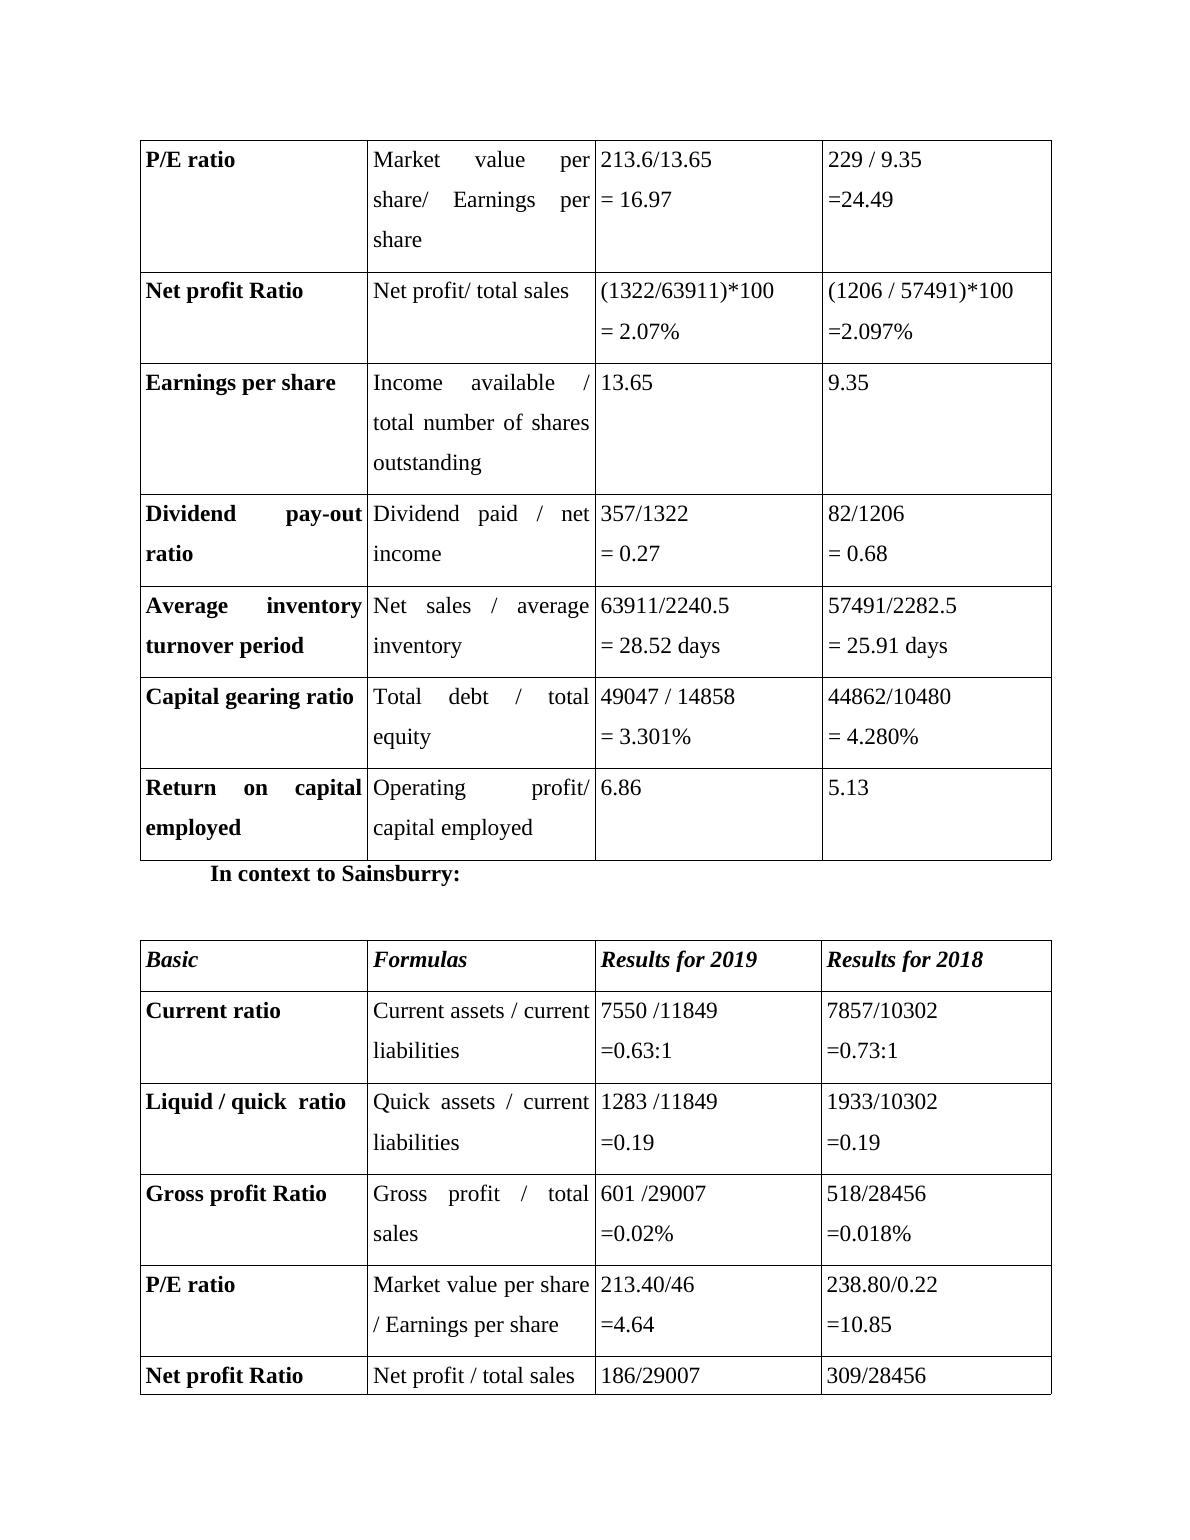
P/E ratio Market value per
share/ Earnings per
share
213.6/13.65
= 16.97
229 / 9.35
=24.49
Net profit Ratio Net profit/ total sales (1322/63911)*100
= 2.07%
(1206 / 57491)*100
=2.097%
Earnings per share Income available /
total number of shares
outstanding
13.65 9.35
Dividend pay-out
ratio
Dividend paid / net
income
357/1322
= 0.27
82/1206
= 0.68
Average inventory
turnover period
Net sales / average
inventory
63911/2240.5
= 28.52 days
57491/2282.5
= 25.91 days
Capital gearing ratio Total debt / total
equity
49047 / 14858
= 3.301%
44862/10480
= 4.280%
Return on capital
employed
Operating profit/
capital employed
6.86 5.13
In context to Sainsburry:
Basic Formulas Results for 2019 Results for 2018
Current ratio Current assets / current
liabilities
7550 /11849
=0.63:1
7857/10302
=0.73:1
Liquid / quick ratio Quick assets / current
liabilities
1283 /11849
=0.19
1933/10302
=0.19
Gross profit Ratio Gross profit / total
sales
601 /29007
=0.02%
518/28456
=0.018%
P/E ratio Market value per share
/ Earnings per share
213.40/46
=4.64
238.80/0.22
=10.85
Net profit Ratio Net profit / total sales 186/29007 309/28456
End of preview
Want to access all the pages? Upload your documents or become a member.
Related Documents
Managerial Financial Portfolioslg...
|16
|3558
|85
Ratio Analysis for Tesco and Sainsburrylg...
|13
|3522
|24
Managerial Finance: Ratio Analysis for Tesco and Sainsburylg...
|18
|3676
|5
Finance: Ratio Analysis and Investment Appraisal Techniqueslg...
|19
|4048
|39
Financial Analysis of Tesco and Sainsbury: A Ratio Analysislg...
|19
|3991
|77
Ratio Analysis of Tesco and Sainsbury: Managerial Financelg...
|16
|3852
|27