Managerial Financial Portfolios
Added on 2022-12-30
16 Pages3558 Words85 Views
Managerial Financial
Portfolios
Portfolios

Table of Contents
INTRODUCTION...........................................................................................................................3
PORTFOLIO 1.................................................................................................................................3
Ratio analysis:..............................................................................................................................3
Interpretation:...............................................................................................................................5
Recommendations:.....................................................................................................................12
Limitations for using ratio analysis for knowing firms financial position:...............................13
PORTFOLIO 2...............................................................................................................................13
Investment appraisal techniques for project A and project B:...................................................13
Interpretation:.............................................................................................................................14
Limitations of using investment appraisal techniques for long term decision-making:............14
CONCLUSION..............................................................................................................................15
REFERENCES..............................................................................................................................16
INTRODUCTION
Finance is describes as activities which are linked with banking, leverage, debt, credit,
money, investments, capital market etc. finance is all about management of money and
arrangement of acquiring funds. Finance is backbone of any organisation as it provides
information and money management for organising activities in the organisation. Managerial
finance is about assessing how financial techniques are being used at various levels for the
company (Addoum, Korniotis and Kumar, 2017). It is management of finance within an
company how well company is using its available resources with its activities. Every firm needed
for money, finance which is used in firms transactions buying and selling assets. The companies
which are selected for this report is Tesco and sainsburry. Tesco is the British multinational
company deals in retail sector, it was founded in 1919, headquarter situated in UK. Sainsburry is
the retailer based company, it was founded in 1869. headquarter situated in UK. This report
covers topics such as ratio analysis of both company, limitations of ratios, graphs for comparing
both companies. Apart from this it also covers topics such as capital investment appraisal,
limitations of this for long term decision-making (Ameer and Othman, 2017).
PORTFOLIO 1
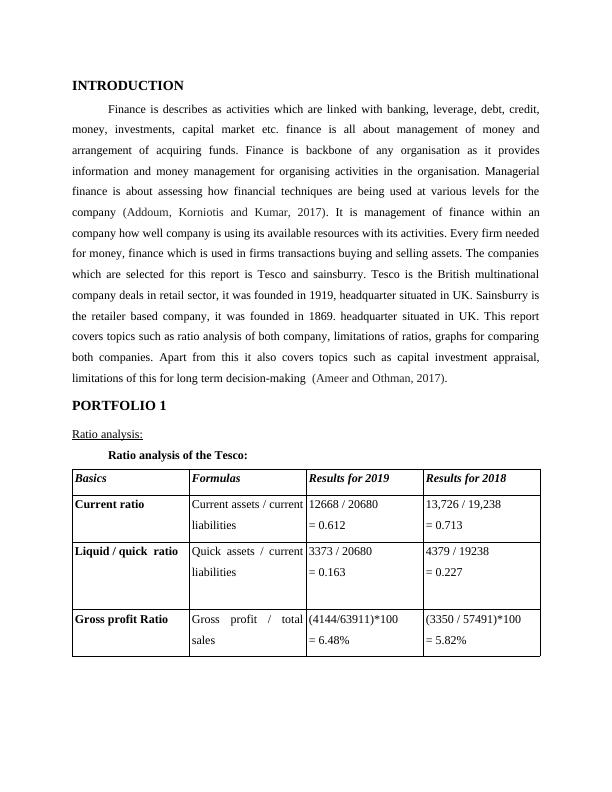
Ratio analysis:
Ratio analysis of the Tesco:
Basics Formulas Results for 2019 Results for 2018
Current ratio Current assets / current
liabilities
12668 / 20680
= 0.612
13,726 / 19,238
= 0.713
Liquid / quick ratio Quick assets / current
liabilities
3373 / 20680
= 0.163
4379 / 19238
= 0.227
Gross profit Ratio Gross profit / total
sales
(4144/63911)*100
= 6.48%
(3350 / 57491)*100
= 5.82%
Finance is describes as activities which are linked with banking, leverage, debt, credit,
money, investments, capital market etc. finance is all about management of money and
arrangement of acquiring funds. Finance is backbone of any organisation as it provides
information and money management for organising activities in the organisation. Managerial
finance is about assessing how financial techniques are being used at various levels for the
company (Addoum, Korniotis and Kumar, 2017). It is management of finance within an
company how well company is using its available resources with its activities. Every firm needed
for money, finance which is used in firms transactions buying and selling assets. The companies
which are selected for this report is Tesco and sainsburry. Tesco is the British multinational
company deals in retail sector, it was founded in 1919, headquarter situated in UK. Sainsburry is
the retailer based company, it was founded in 1869. headquarter situated in UK. This report
covers topics such as ratio analysis of both company, limitations of ratios, graphs for comparing
both companies. Apart from this it also covers topics such as capital investment appraisal,
limitations of this for long term decision-making (Ameer and Othman, 2017).
PORTFOLIO 1
Ratio analysis:
Ratio analysis of the Tesco:
Basics Formulas Results for 2019 Results for 2018
Current ratio Current assets / current
liabilities
12668 / 20680
= 0.612
13,726 / 19,238
= 0.713
Liquid / quick ratio Quick assets / current
liabilities
3373 / 20680
= 0.163
4379 / 19238
= 0.227
Gross profit Ratio Gross profit / total
sales
(4144/63911)*100
= 6.48%
(3350 / 57491)*100
= 5.82%
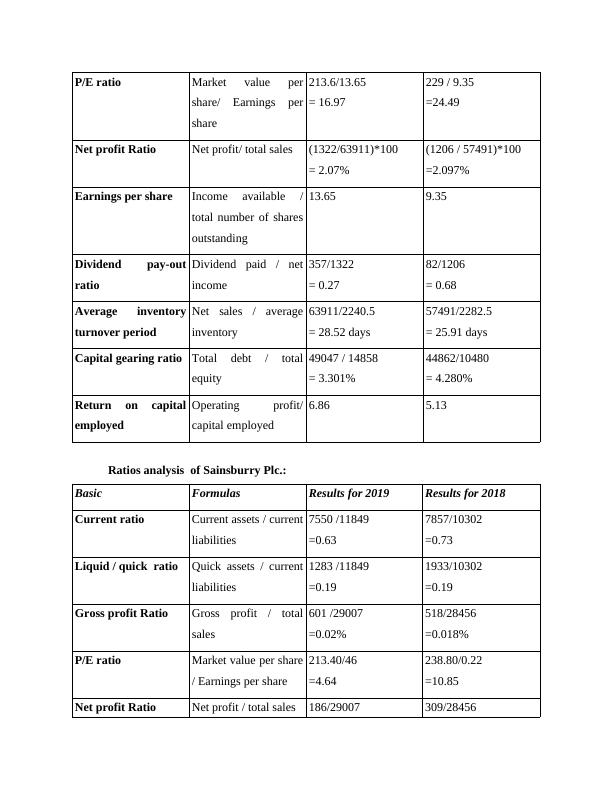
P/E ratio Market value per
share/ Earnings per
share
213.6/13.65
= 16.97
229 / 9.35
=24.49
Net profit Ratio Net profit/ total sales (1322/63911)*100
= 2.07%
(1206 / 57491)*100
=2.097%
Earnings per share Income available /
total number of shares
outstanding
13.65 9.35
Dividend pay-out
ratio
Dividend paid / net
income
357/1322
= 0.27
82/1206
= 0.68
Average inventory
turnover period
Net sales / average
inventory
63911/2240.5
= 28.52 days
57491/2282.5
= 25.91 days
Capital gearing ratio Total debt / total
equity
49047 / 14858
= 3.301%
44862/10480
= 4.280%
Return on capital
employed
Operating profit/
capital employed
6.86 5.13
Ratios analysis of Sainsburry Plc.:
Basic Formulas Results for 2019 Results for 2018
Current ratio Current assets / current
liabilities
7550 /11849
=0.63
7857/10302
=0.73
Liquid / quick ratio Quick assets / current
liabilities
1283 /11849
=0.19
1933/10302
=0.19
Gross profit Ratio Gross profit / total
sales
601 /29007
=0.02%
518/28456
=0.018%
P/E ratio Market value per share
/ Earnings per share
213.40/46
=4.64
238.80/0.22
=10.85
Net profit Ratio Net profit / total sales 186/29007 309/28456
End of preview
Want to access all the pages? Upload your documents or become a member.
Related Documents
Ratio Analysis of Tesco and Sainsburry: Managerial Financelg...
|18
|3767
|40
Ratio Analysis for Tesco and Sainsburrylg...
|13
|3522
|24
Managerial Finance: Ratio Analysis for Tesco and Sainsburylg...
|18
|3676
|5
Financial Analysis of Tesco and Sainsbury: A Ratio Analysislg...
|19
|3991
|77
Finance: Ratio Analysis and Investment Appraisal Techniqueslg...
|19
|4048
|39
Ratio Analysis of Tesco and Sainsbury: Managerial Financelg...
|16
|3852
|27