Ratio Analysis for Tesco and Sainsburry
Added on 2022-12-30
13 Pages3522 Words24 Views
Managerial
Finance
Finance
Table of Contents
INTRODUCTION...........................................................................................................................3
PORTFOLIO 1.................................................................................................................................3
Ratio analysis for the company Tesco and Sainsburry:...............................................................3
Recommendations:.......................................................................................................................7
Limitations for ratio analysis in order to know financial position:..............................................8
PORTFOLIO 2.................................................................................................................................9
Investment appraisal techniques:.................................................................................................9
Limitations for investment appraisal techniques for knowing better investment options:........10
CONCLUSION..............................................................................................................................10
REFERENCES..............................................................................................................................11
INTRODUCTION
Finance is the important element for any organisation, it is about creating managing
money for the investments which helps firms for expanding business. Finance is about acquiring
funds and managing it for organisations activities. Money is essential thing for the organisations
for managing its activities. It helps firms for meeting monetary requirements which helps it to
organise its activities. Financial management is the process for managing financial activities for
the organisations. Financial management has various functions which includes planning,
organising, analysing, controlling, managing financial activities (Abor, 2016). Finance
department managing funds for the organisations activities by various sources includes debts,
equity etc. it is important for accomplish organisations objectives. The company which is
selected for this report is Tesco and Sainsburry. Tesco is the British multinational company for
general merchandise and retail based company. It was founded in 1919, headquarter situated in
UK. Sainsburry has largest chain for supermarkets for retail industry. It was established in 1869,
headquarter situated in UK. This report covers various topics which includes calculation for
ratios, analysis for ratio analysis for both companies, limitations for ratio analysis for knowing
financial position. Apart from this it also covers topics such as investment appraisal techniques,
limitations for investment appraisal techniques in order to know better investment options.
PORTFOLIO 1
Ratio analysis for the company Tesco and Sainsburry:
Ratios for Tesco:
Basics Formulas Results for 2019 Results for 2018
Current ratio Current assets / current
liabilities
12668 / 20680
= 0.612
13,726 / 19,238
= 0.713
Liquid / quick ratio Quick assets / current
liabilities
3373 / 20680
= 0.163
4379 / 19238
= 0.227
Gross profit Ratio Gross profit / total
sales
(4144/63911)*100
= 6.48%
(3350 / 57491)*100
= 5.82%
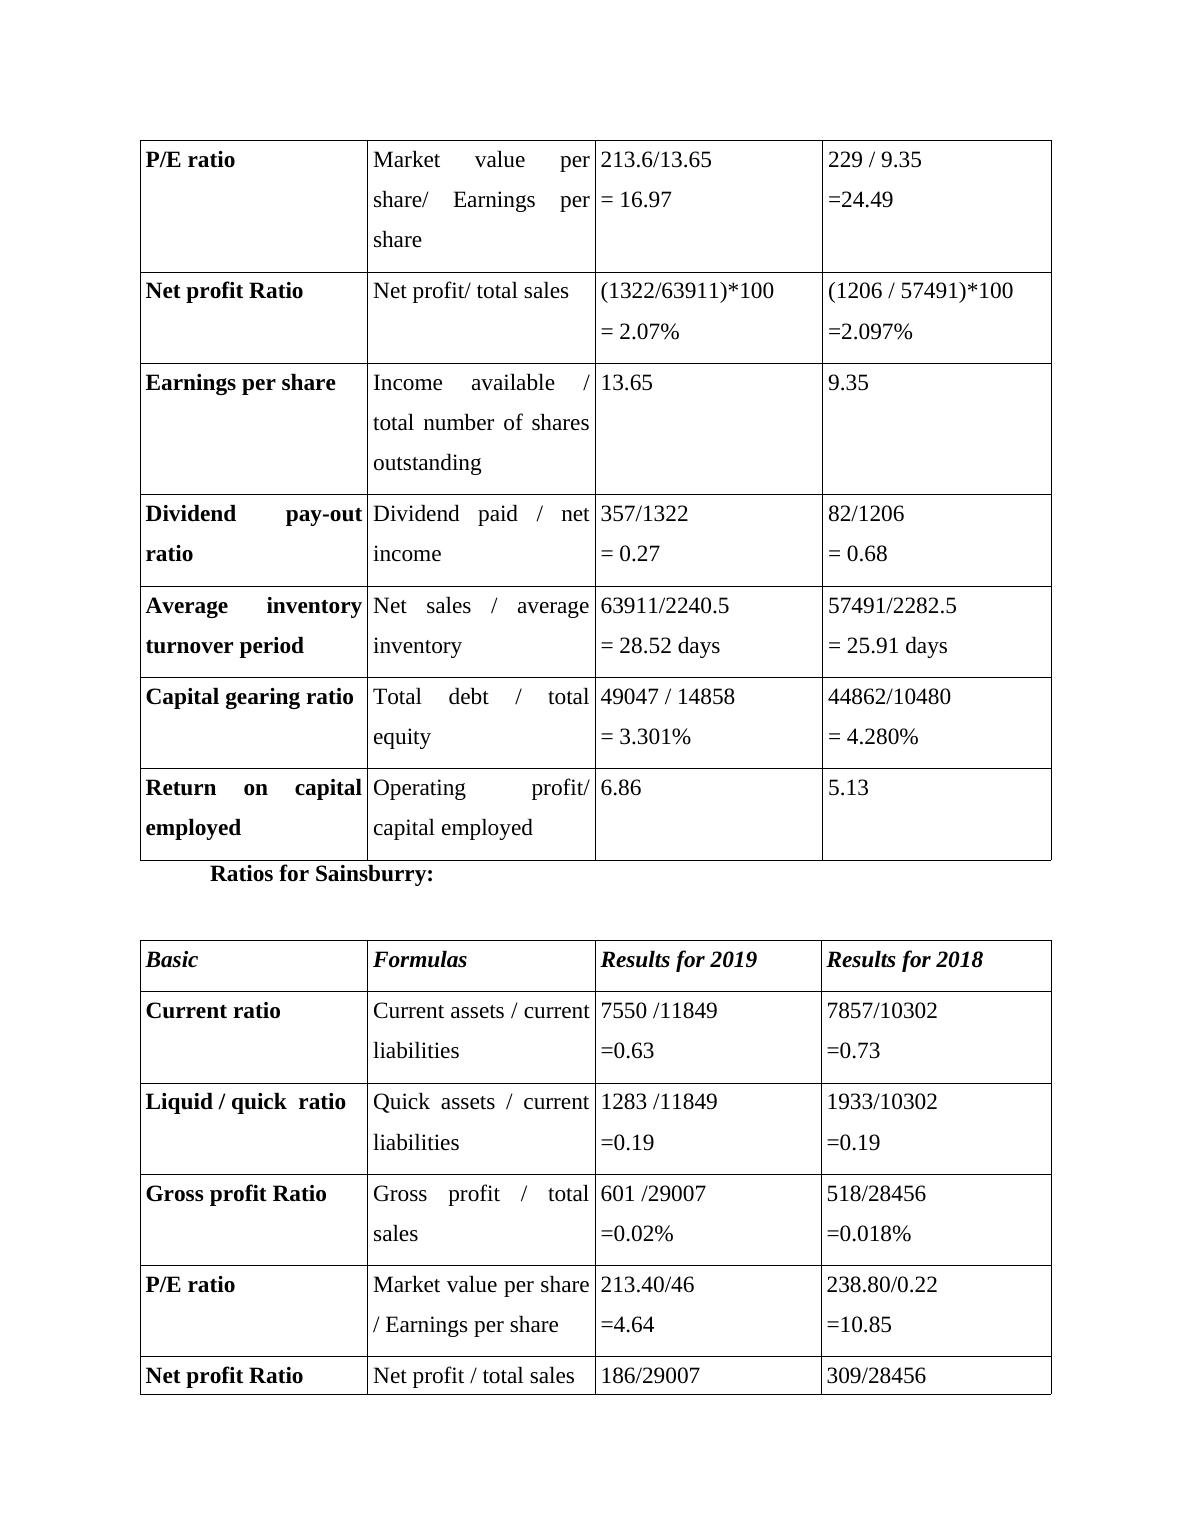
P/E ratio Market value per
share/ Earnings per
share
213.6/13.65
= 16.97
229 / 9.35
=24.49
Net profit Ratio Net profit/ total sales (1322/63911)*100
= 2.07%
(1206 / 57491)*100
=2.097%
Earnings per share Income available /
total number of shares
outstanding
13.65 9.35
Dividend pay-out
ratio
Dividend paid / net
income
357/1322
= 0.27
82/1206
= 0.68
Average inventory
turnover period
Net sales / average
inventory
63911/2240.5
= 28.52 days
57491/2282.5
= 25.91 days
Capital gearing ratio Total debt / total
equity
49047 / 14858
= 3.301%
44862/10480
= 4.280%
Return on capital
employed
Operating profit/
capital employed
6.86 5.13
Ratios for Sainsburry:
Basic Formulas Results for 2019 Results for 2018
Current ratio Current assets / current
liabilities
7550 /11849
=0.63
7857/10302
=0.73
Liquid / quick ratio Quick assets / current
liabilities
1283 /11849
=0.19
1933/10302
=0.19
Gross profit Ratio Gross profit / total
sales
601 /29007
=0.02%
518/28456
=0.018%
P/E ratio Market value per share
/ Earnings per share
213.40/46
=4.64
238.80/0.22
=10.85
Net profit Ratio Net profit / total sales 186/29007 309/28456
End of preview
Want to access all the pages? Upload your documents or become a member.
Related Documents
Ratio Analysis of Tesco and Sainsburry: Managerial Financelg...
|18
|3767
|40
Managerial Financial Portfolioslg...
|16
|3558
|85
Managerial Finance: Ratio Analysis for Tesco and Sainsburylg...
|18
|3676
|5
Ratio Analysis of Tesco and Sainsbury: A Comparative Studylg...
|16
|3748
|85
Finance: Ratio Analysis and Investment Appraisal Techniqueslg...
|19
|4048
|39
Financial Analysis of Tesco and Sainsbury: A Ratio Analysislg...
|19
|3991
|77