MAT5212 | Mathematical Statistics | Assignment
VerifiedAdded on 2022/09/01
|13
|1612
|19
AI Summary
Contribute Materials
Your contribution can guide someone’s learning journey. Share your
documents today.
Running head: MAT5212
MAT5212
Name of the University
Name of the Student
MAT5212
Name of the University
Name of the Student
Secure Best Marks with AI Grader
Need help grading? Try our AI Grader for instant feedback on your assignments.

2MAT5212
Contents
Q1...............................................................................................................................................3
Q2...............................................................................................................................................5
Q3...............................................................................................................................................7
Q4.............................................................................................................................................11
References:...............................................................................................................................13
3MAT5212
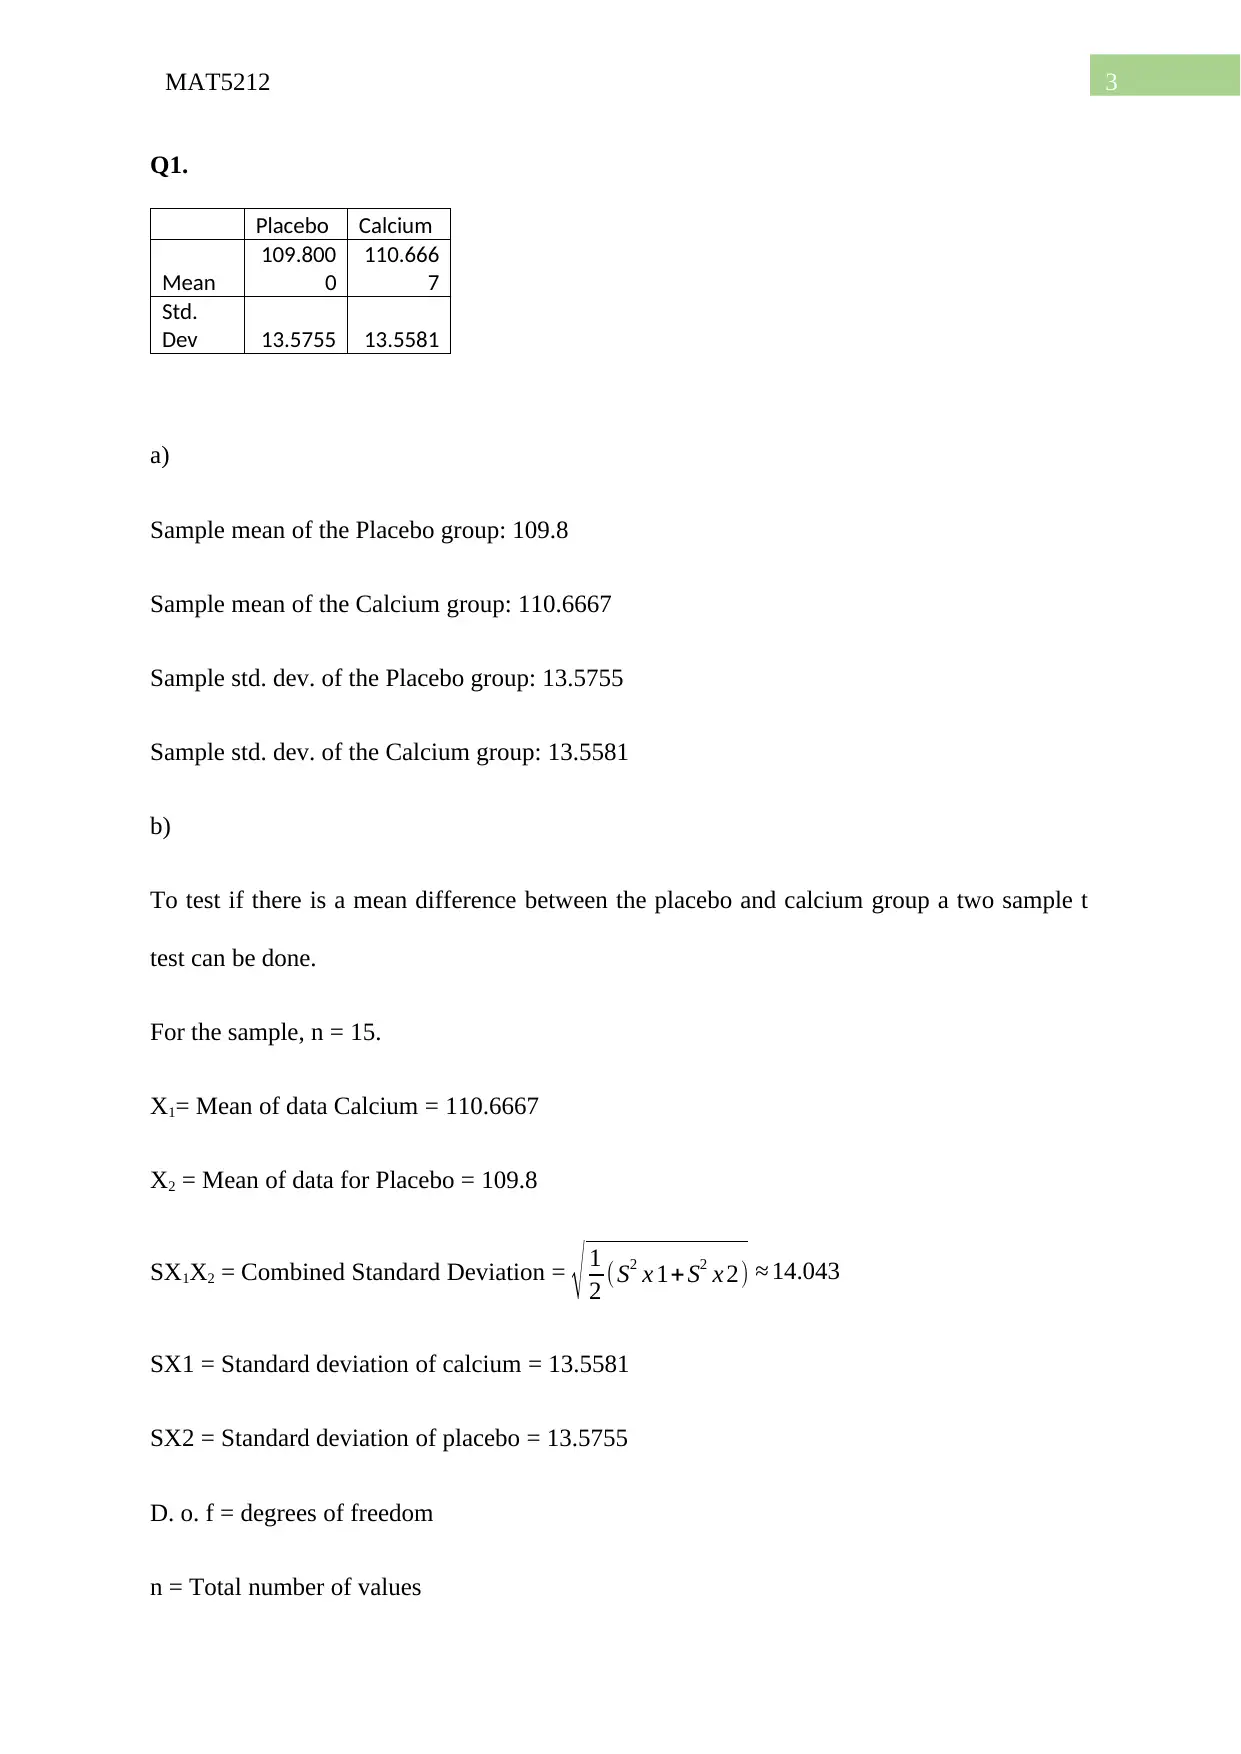
Q1.
Placebo Calcium
Mean
109.800
0
110.666
7
Std.
Dev 13.5755 13.5581
a)
Sample mean of the Placebo group: 109.8
Sample mean of the Calcium group: 110.6667
Sample std. dev. of the Placebo group: 13.5755
Sample std. dev. of the Calcium group: 13.5581
b)
To test if there is a mean difference between the placebo and calcium group a two sample t
test can be done.
For the sample, n = 15.
X1= Mean of data Calcium = 110.6667
X2 = Mean of data for Placebo = 109.8
SX1X2 = Combined Standard Deviation = √ 1
2 (S2 x 1+ S2 x 2) ≈ 14.043
SX1 = Standard deviation of calcium = 13.5581
SX2 = Standard deviation of placebo = 13.5755
D. o. f = degrees of freedom
n = Total number of values
4MAT5212
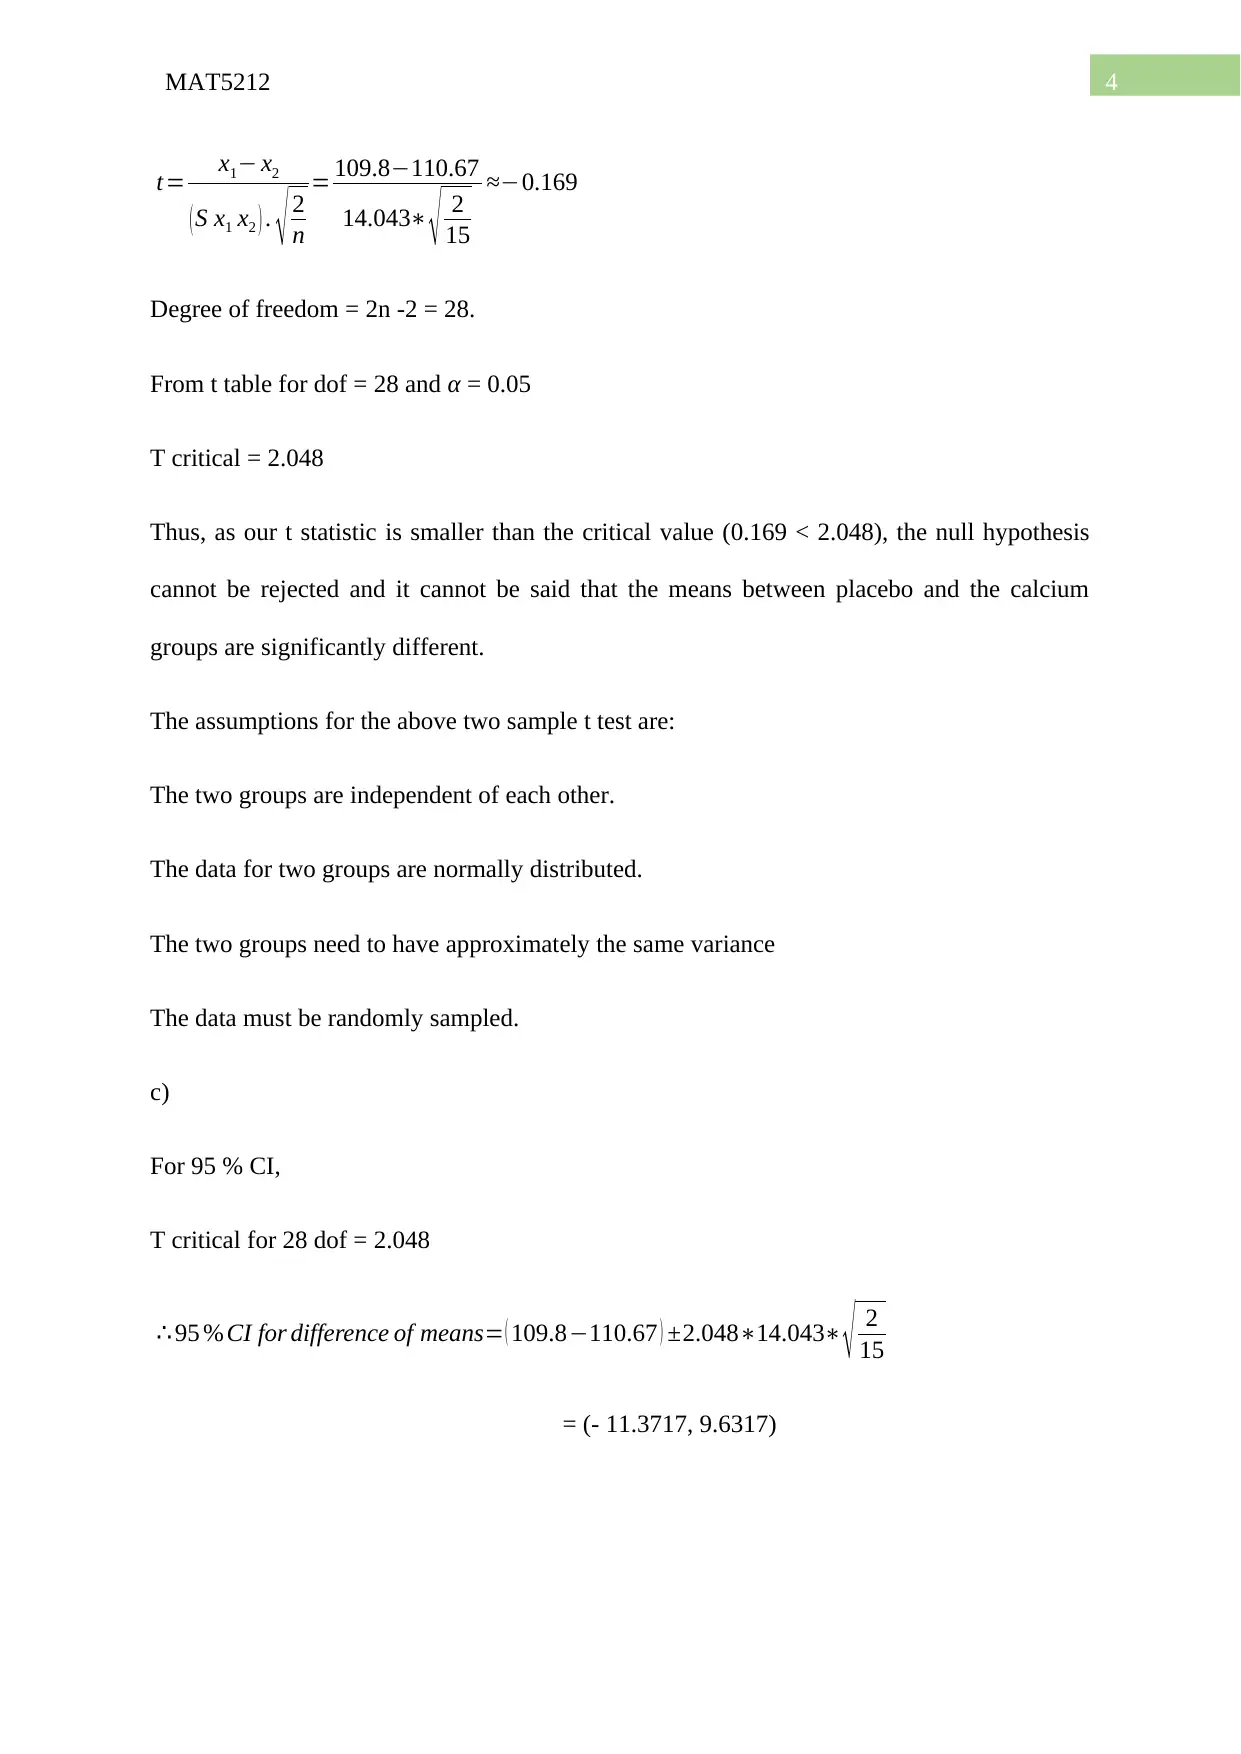
t= x1− x2
( S x1 x2 ) . √ 2
n
= 109.8−110.67
14.043∗ √ 2
15
≈−0.169
Degree of freedom = 2n -2 = 28.
From t table for dof = 28 and α = 0.05
T critical = 2.048
Thus, as our t statistic is smaller than the critical value (0.169 < 2.048), the null hypothesis
cannot be rejected and it cannot be said that the means between placebo and the calcium
groups are significantly different.
The assumptions for the above two sample t test are:
The two groups are independent of each other.
The data for two groups are normally distributed.
The two groups need to have approximately the same variance
The data must be randomly sampled.
c)
For 95 % CI,
T critical for 28 dof = 2.048
∴ 95 % CI for difference of means= ( 109.8−110.67 ) ±2.048∗14.043∗ √ 2
15
= (- 11.3717, 9.6317)
Secure Best Marks with AI Grader
Need help grading? Try our AI Grader for instant feedback on your assignments.
5MAT5212
d)
With 95 % confidence it can be said that the true difference between the sample mean lies
between -11.3717 and 9.6317 which is true for the difference in the sample mean
(109.8−110.67) = -0.87 which is true.
Q2.
(a)
The appropriate test for the study is the paired sample t test. It is used because for each
observation, the two values (that is the iq of the twins) are related.
(b)
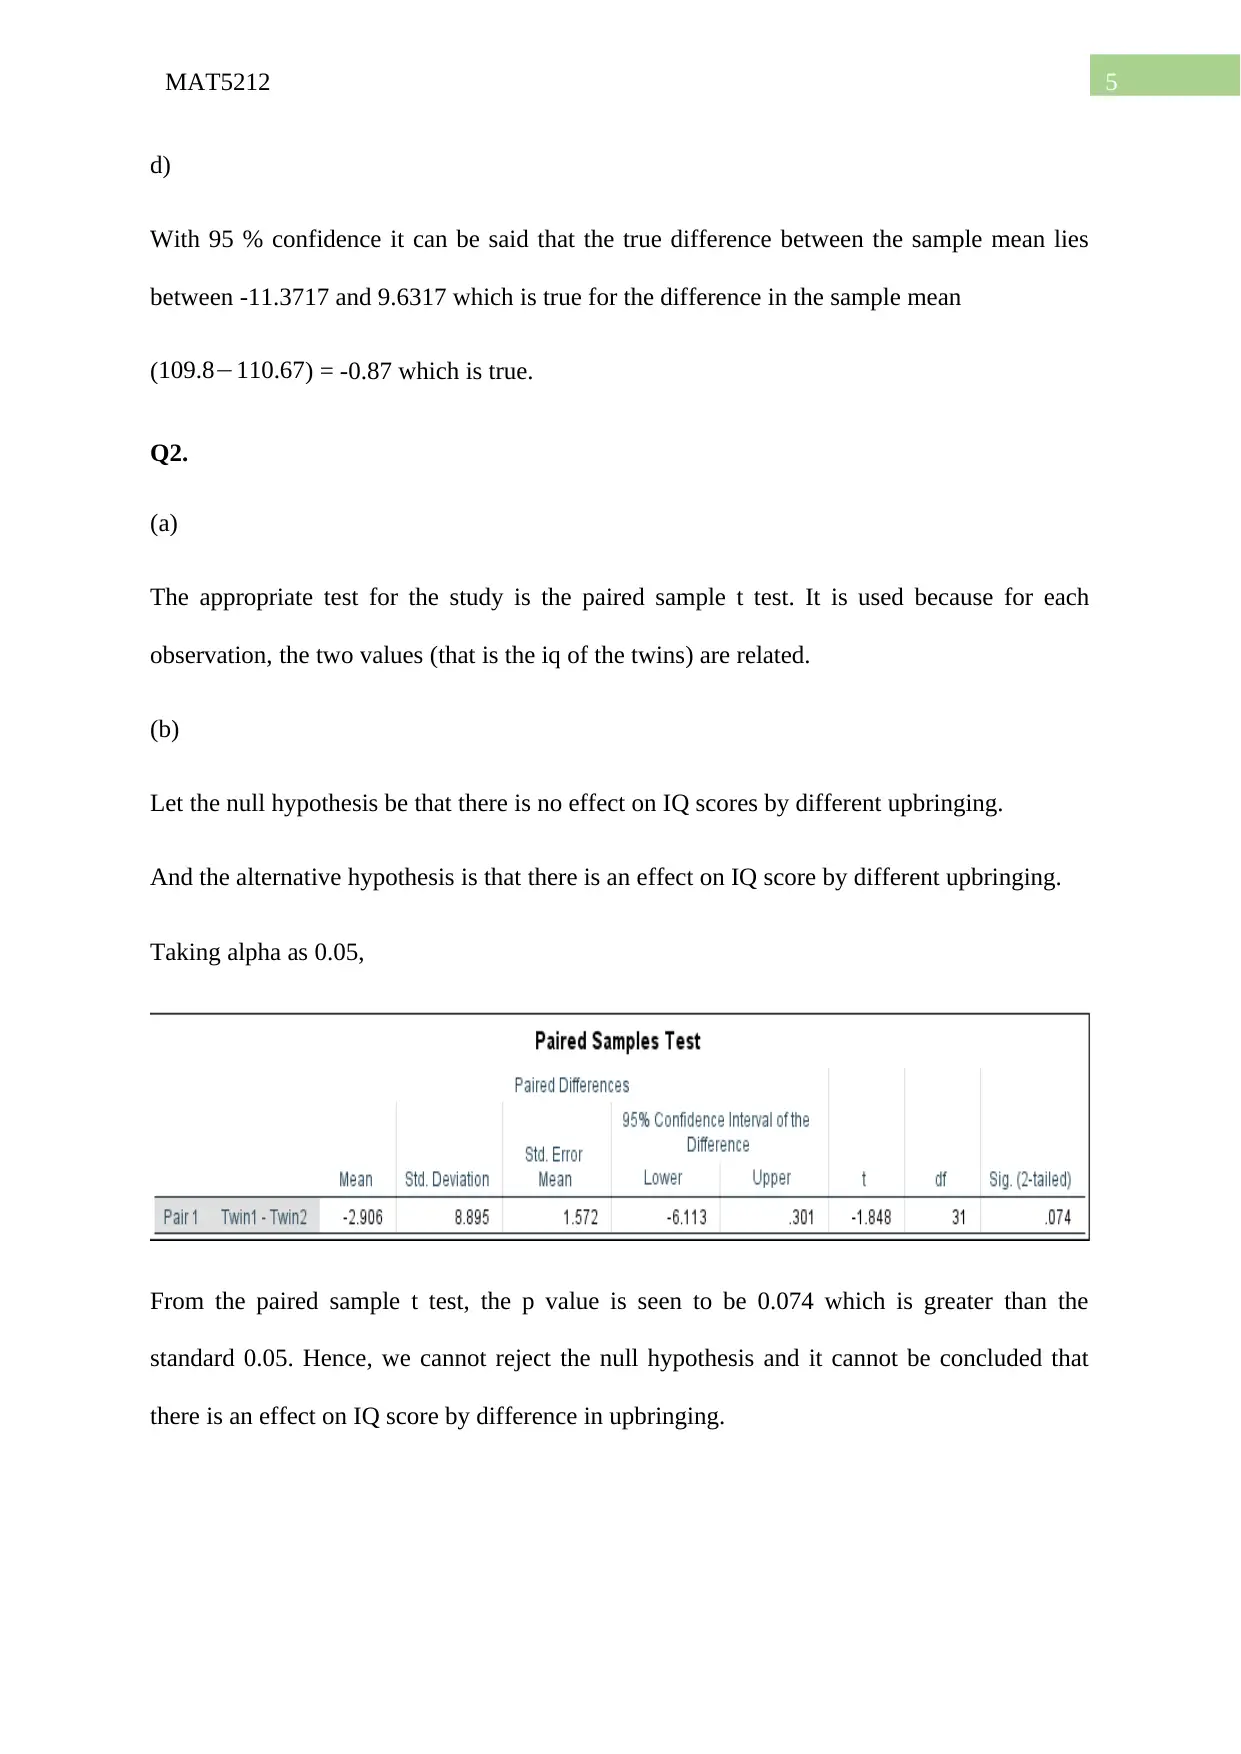
Let the null hypothesis be that there is no effect on IQ scores by different upbringing.
And the alternative hypothesis is that there is an effect on IQ score by different upbringing.
Taking alpha as 0.05,
From the paired sample t test, the p value is seen to be 0.074 which is greater than the
standard 0.05. Hence, we cannot reject the null hypothesis and it cannot be concluded that
there is an effect on IQ score by difference in upbringing.
d)
With 95 % confidence it can be said that the true difference between the sample mean lies
between -11.3717 and 9.6317 which is true for the difference in the sample mean
(109.8−110.67) = -0.87 which is true.
Q2.
(a)
The appropriate test for the study is the paired sample t test. It is used because for each
observation, the two values (that is the iq of the twins) are related.
(b)
Let the null hypothesis be that there is no effect on IQ scores by different upbringing.
And the alternative hypothesis is that there is an effect on IQ score by different upbringing.
Taking alpha as 0.05,
From the paired sample t test, the p value is seen to be 0.074 which is greater than the
standard 0.05. Hence, we cannot reject the null hypothesis and it cannot be concluded that
there is an effect on IQ score by difference in upbringing.
6MAT5212
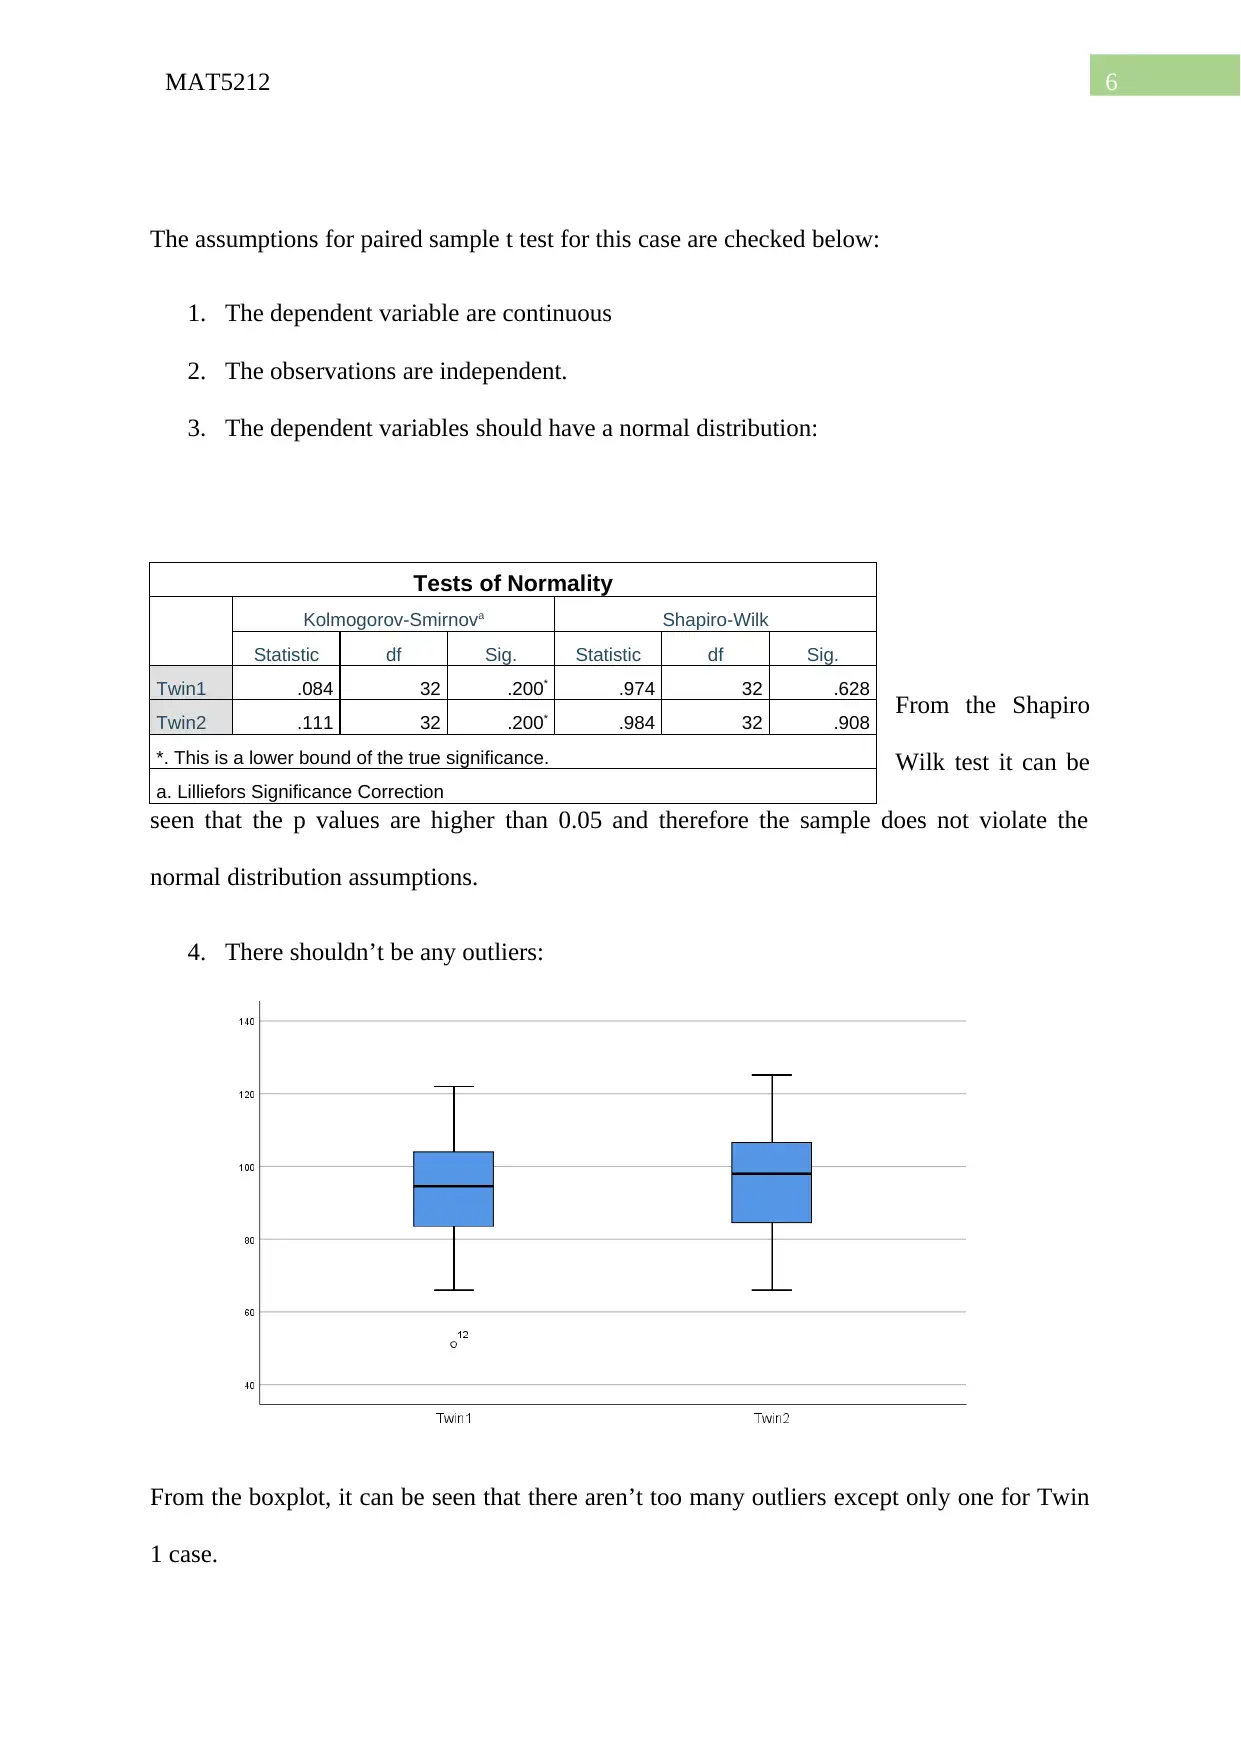
The assumptions for paired sample t test for this case are checked below:
1. The dependent variable are continuous
2. The observations are independent.
3. The dependent variables should have a normal distribution:
From the Shapiro
Wilk test it can be
seen that the p values are higher than 0.05 and therefore the sample does not violate the
normal distribution assumptions.
4. There shouldn’t be any outliers:
From the boxplot, it can be seen that there aren’t too many outliers except only one for Twin
1 case.
Tests of Normality
Kolmogorov-Smirnova Shapiro-Wilk
Statistic df Sig. Statistic df Sig.
Twin1 .084 32 .200* .974 32 .628
Twin2 .111 32 .200* .984 32 .908
*. This is a lower bound of the true significance.
a. Lilliefors Significance Correction
7MAT5212
c)
95% confidence interval for the true mean difference of the IQ scores
: −2.906 ± 1.696∗8.895/ √32 = (-5.5728 ,-0.2392)
Q3.
Mean energy intake for 4 months: 535.8333
Mean energy intake for 6 months: 553.5
Mean energy intake for 8 months: 608.5,
Calculation for sum of squares within groups:
4 Months x- mean (x-mean)^2 6 Months x- mean (x-mean)^2 8 Months x- mean (x-mean)^2
489 -46.83 2193.36 600 46.5 2162.25 650 41.5 1722.25
585 49.17 2417.36 652 98.5 9702.25 660 51.5 2652.25
459 -76.83 5903.36 487 -66.5 4422.25 601 -7.5 56.25
490 -45.83 2100.69 425 -128.5 16512.25 546 -62.5 3906.25
650 114.17 13034.03 480 -73.5 5402.25 690 81.5 6642.25
578 42.17 1778.03 711 157.5 24806.25 599 -9.5 90.25
618 82.17 6751.36 521 -32.5 1056.25 635 26.5 702.25
520 -15.83 250.69 455 -98.5 9702.25 499 -109.5 11990.25
652 116.17 13494.69 600 46.5 2162.25 650 41.5 1722.25
399 -136.83 18723.36 424 -129.5 16770.25 482 -126.5 16002.25
491 -44.83 2010.03 612 58.5 3422.25 670 61.5 3782.25
499 -36.83 1356.69 675 121.5 14762.25 620 11.5 132.25
70013.67 110883 49401
Sum of squares with groups (SSW): (70013.67 + 110883 +49401) = 230297.67
Calculation for total sum of square:
Paraphrase This Document
Need a fresh take? Get an instant paraphrase of this document with our AI Paraphraser
8MAT5212
Calorie
Intake
(x-mean) (x-mean)^2
489 -76.94 5920.45
585 19.06 363.11
459 -106.94 11437.11
490 -75.94 5767.56
650 84.06 7065.34
578 12.06 145.34
618 52.06 2709.78
520 -45.94 2110.89
652 86.06 7405.56
399 -166.94 27870.45
491 -74.94 5616.67
499 -66.94 4481.56
600 34.06 1159.78
652 86.06 7405.56
487 -78.94 6232.23
425 -140.94 19865.34
480 -85.94 7386.45
711 145.06 21041.11
521 -44.94 2020.00
455 -110.94 12308.67
600 34.06 1159.78
424 -141.94 20148.23
612 46.06 2121.11
675 109.06 11893.11
650 84.06 7065.34
660 94.06 8846.45
601 35.06 1228.89
546 -19.94 397.78
690 124.06 15389.78
599 33.06 1092.67
635 69.06 4768.67
499 -66.94 4481.56
650 84.06 7065.34
482 -83.94 7046.67
670 104.06 10827.56
620 54.06 2922.00
Total 264767.8889
Mean
565.9444
Total sum of squares (SST): 264767.889
Sum of squares between groups: Total Sum of Squares – Sum of Squares within Groups
9MAT5212
: 264767.889 - 230297.67 = 34470.219
∑ of squares between groups
Df = 34470.219
3−1 =¿ 17235.1095
SSW
Df = 230297.67
(36−3) =6978 . 7172
F = 17235.1095
6978 .7172 = 2.4696
F critical = 3.2849.
As the F value is less than the critical value, the null hypothesis cannot be rejected and we
cannot conclude that the mean energy intakes for the different months are different.
b)
The assumptions for one way anova are given below:
1. The dependent variables are continuous
2. The observations are independent of one another
3. The data distribution is normal
Tests of Normality
Kolmogorov-Smirnova Shapiro-Wilk
10MAT5212
Statistic df Sig. Statistic df Sig.
4 Months .178 12 .200* .936 12 .453
8 Months .194 12 .200* .897 12 .147
6 Months .178 12 .200* .925 12 .331
*. This is a lower bound of the true significance.
a. Lilliefors Significance Correction
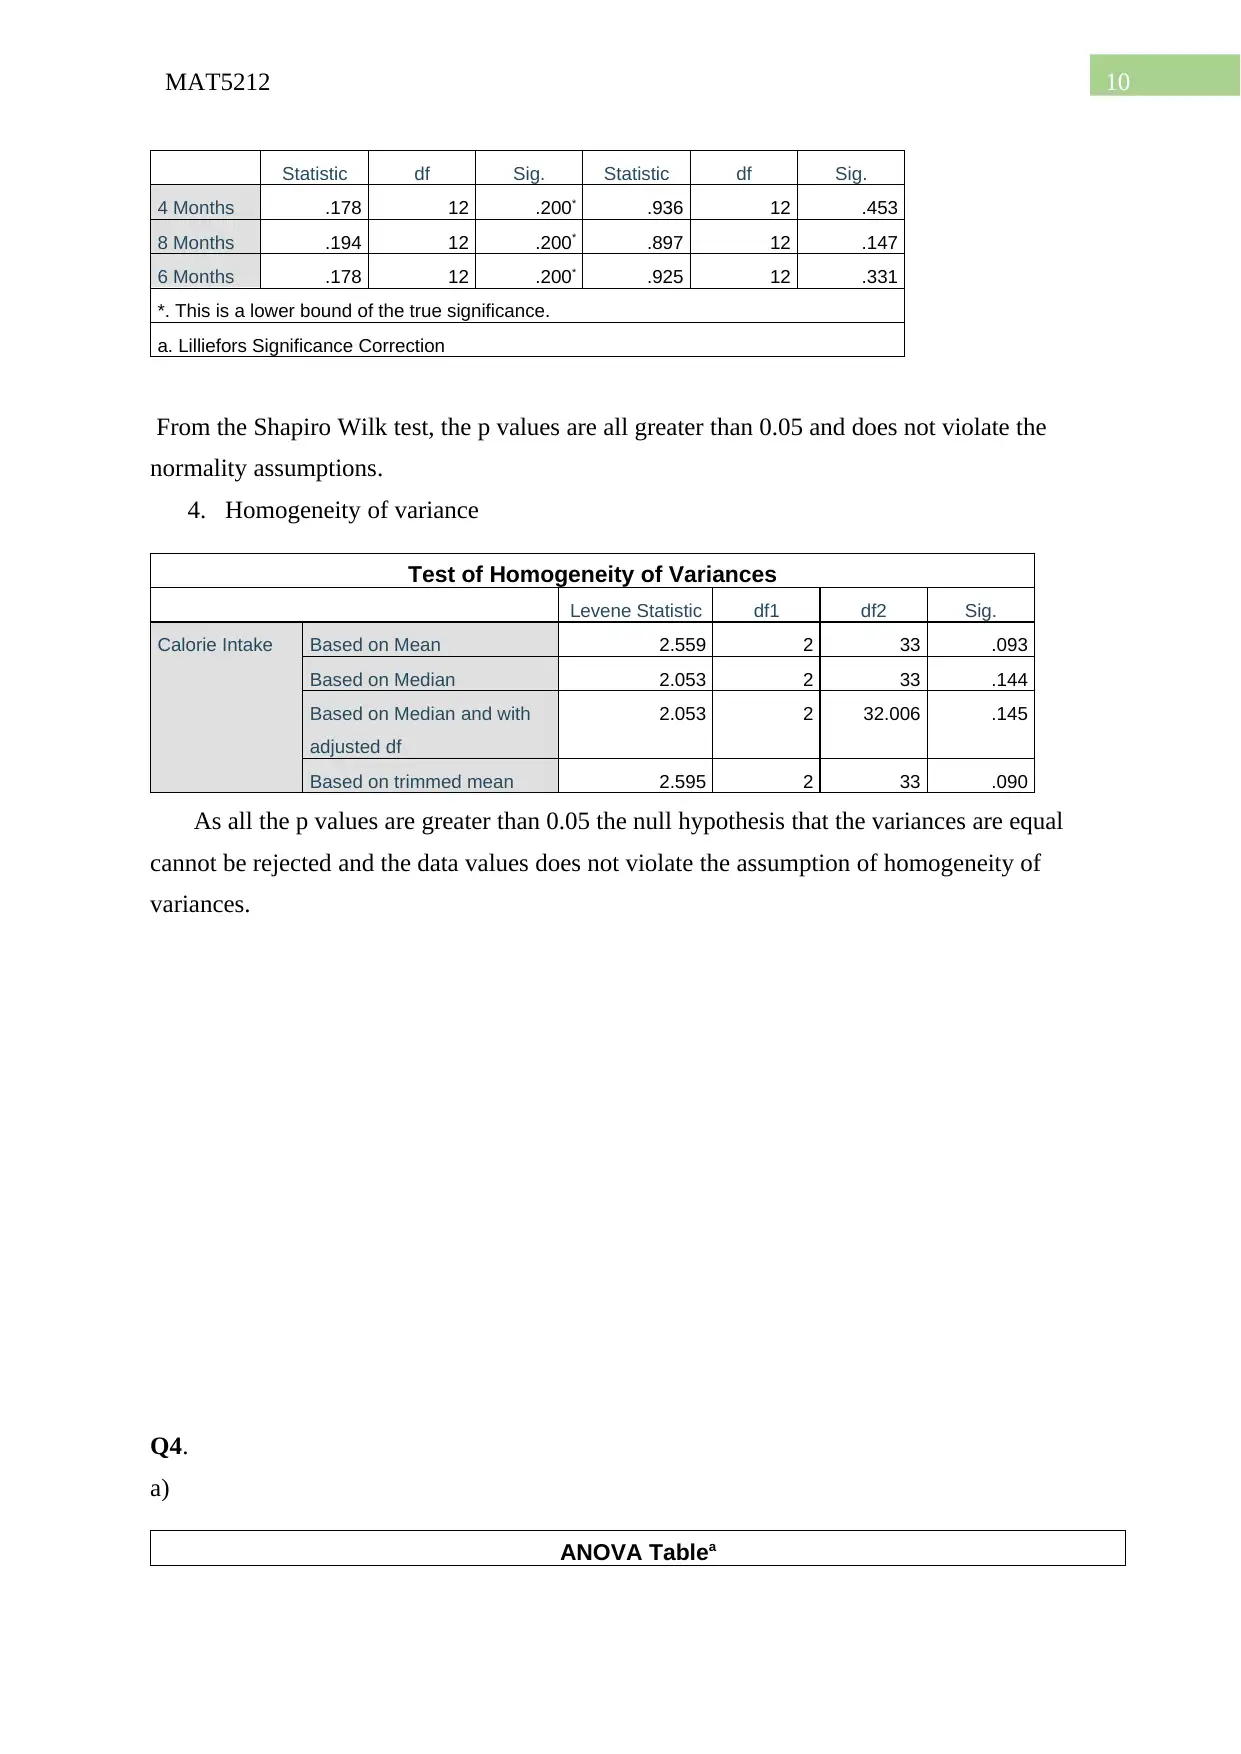
From the Shapiro Wilk test, the p values are all greater than 0.05 and does not violate the
normality assumptions.
4. Homogeneity of variance
Test of Homogeneity of Variances
Levene Statistic df1 df2 Sig.
Calorie Intake Based on Mean 2.559 2 33 .093
Based on Median 2.053 2 33 .144
Based on Median and with
adjusted df
2.053 2 32.006 .145
Based on trimmed mean 2.595 2 33 .090
As all the p values are greater than 0.05 the null hypothesis that the variances are equal
cannot be rejected and the data values does not violate the assumption of homogeneity of
variances.
Q4.
a)
ANOVA Tablea
Statistic df Sig. Statistic df Sig.
4 Months .178 12 .200* .936 12 .453
8 Months .194 12 .200* .897 12 .147
6 Months .178 12 .200* .925 12 .331
*. This is a lower bound of the true significance.
a. Lilliefors Significance Correction
From the Shapiro Wilk test, the p values are all greater than 0.05 and does not violate the
normality assumptions.
4. Homogeneity of variance
Test of Homogeneity of Variances
Levene Statistic df1 df2 Sig.
Calorie Intake Based on Mean 2.559 2 33 .093
Based on Median 2.053 2 33 .144
Based on Median and with
adjusted df
2.053 2 32.006 .145
Based on trimmed mean 2.595 2 33 .090
As all the p values are greater than 0.05 the null hypothesis that the variances are equal
cannot be rejected and the data values does not violate the assumption of homogeneity of
variances.
Q4.
a)
ANOVA Tablea
Secure Best Marks with AI Grader
Need help grading? Try our AI Grader for instant feedback on your assignments.
11MAT5212
Sum of
Squares df
Mean
Square F Sig.
Insect Count *
Color
Between
Groups
(Combined) 157145.193 6 26190.865 3.672 .002
Within Groups 2090112.474 293 7133.490
Total 2247257.667 299
a. The grouping variable Color is a string, so the test for linearity cannot be computed.
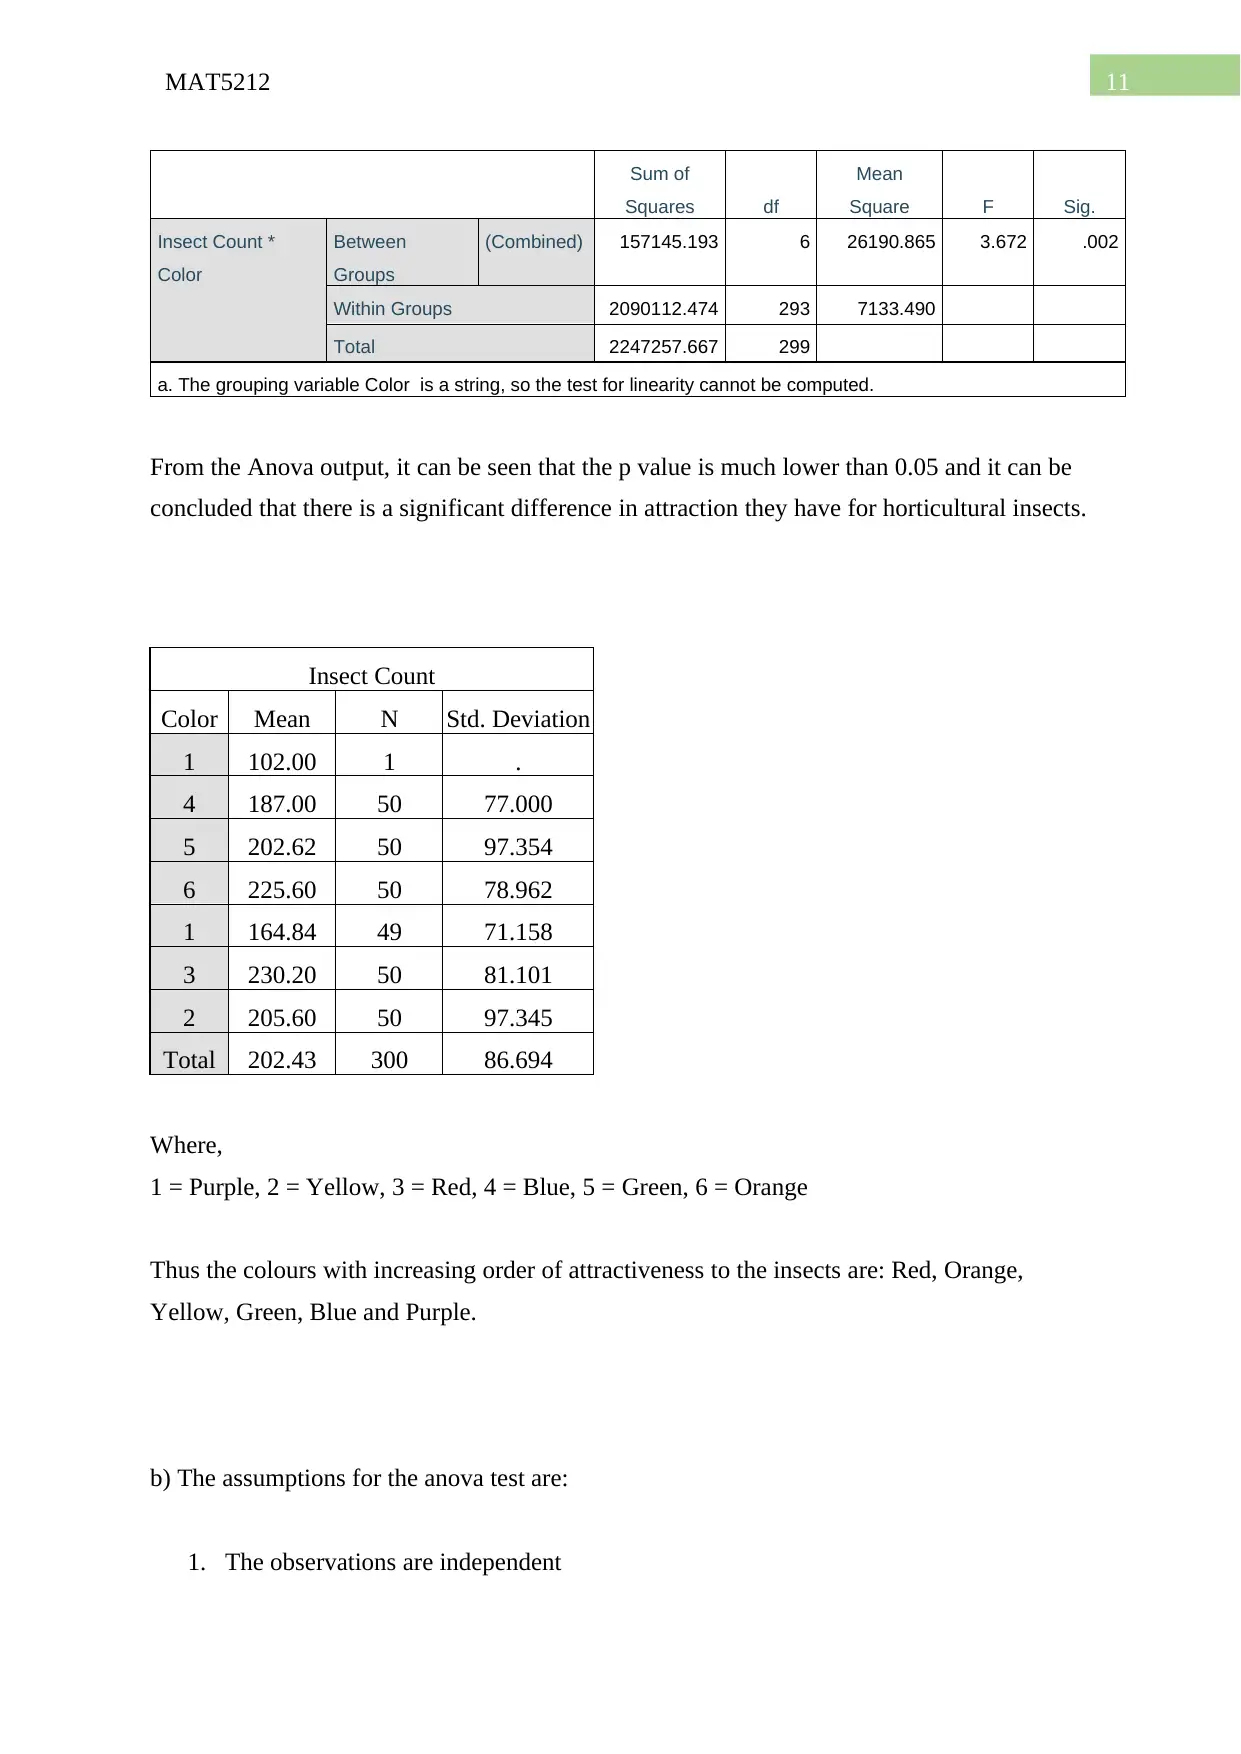
From the Anova output, it can be seen that the p value is much lower than 0.05 and it can be
concluded that there is a significant difference in attraction they have for horticultural insects.
Insect Count
Color Mean N Std. Deviation
1 102.00 1 .
4 187.00 50 77.000
5 202.62 50 97.354
6 225.60 50 78.962
1 164.84 49 71.158
3 230.20 50 81.101
2 205.60 50 97.345
Total 202.43 300 86.694
Where,
1 = Purple, 2 = Yellow, 3 = Red, 4 = Blue, 5 = Green, 6 = Orange
Thus the colours with increasing order of attractiveness to the insects are: Red, Orange,
Yellow, Green, Blue and Purple.
b) The assumptions for the anova test are:
1. The observations are independent
Sum of
Squares df
Mean
Square F Sig.
Insect Count *
Color
Between
Groups
(Combined) 157145.193 6 26190.865 3.672 .002
Within Groups 2090112.474 293 7133.490
Total 2247257.667 299
a. The grouping variable Color is a string, so the test for linearity cannot be computed.
From the Anova output, it can be seen that the p value is much lower than 0.05 and it can be
concluded that there is a significant difference in attraction they have for horticultural insects.
Insect Count
Color Mean N Std. Deviation
1 102.00 1 .
4 187.00 50 77.000
5 202.62 50 97.354
6 225.60 50 78.962
1 164.84 49 71.158
3 230.20 50 81.101
2 205.60 50 97.345
Total 202.43 300 86.694
Where,
1 = Purple, 2 = Yellow, 3 = Red, 4 = Blue, 5 = Green, 6 = Orange
Thus the colours with increasing order of attractiveness to the insects are: Red, Orange,
Yellow, Green, Blue and Purple.
b) The assumptions for the anova test are:
1. The observations are independent
12MAT5212
2. The data is randomly sampled
3. Normality is not violated
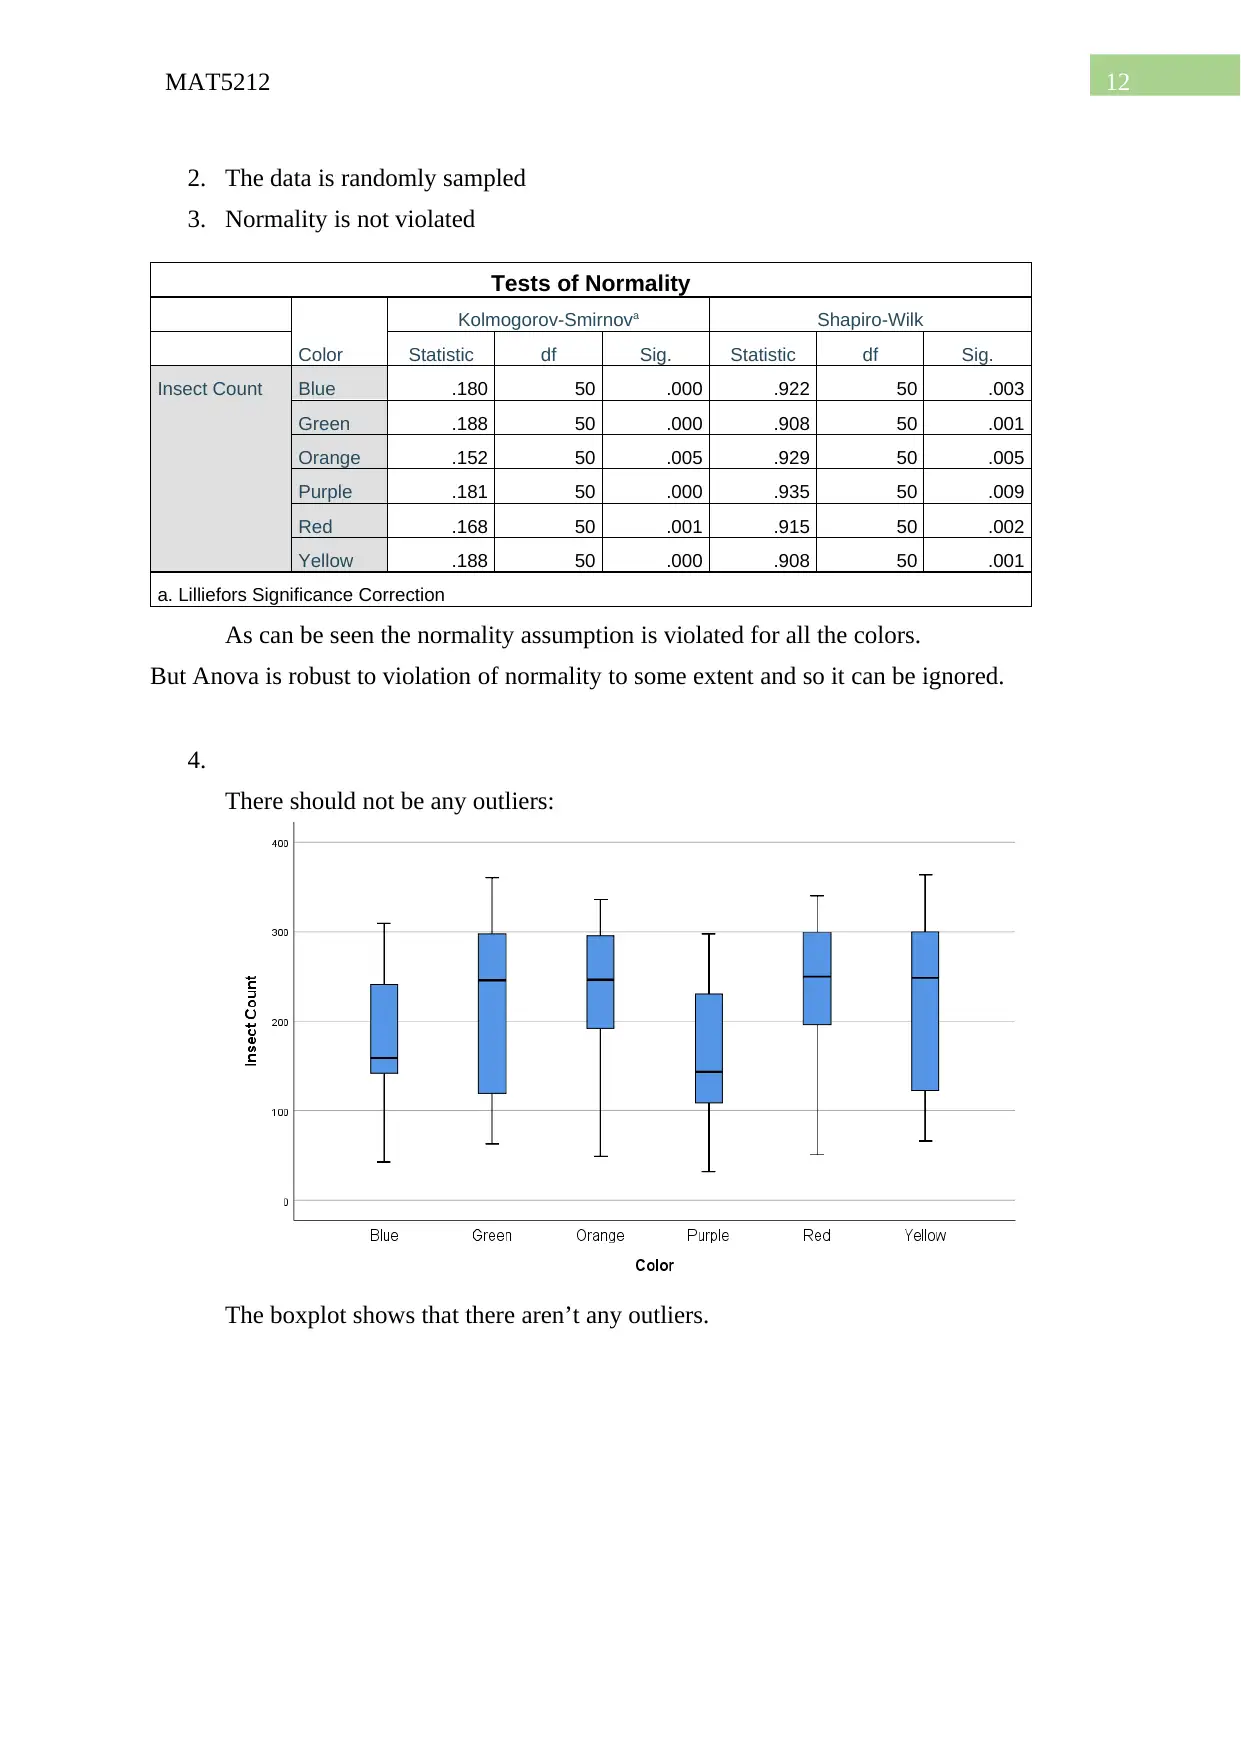
Tests of Normality
Color
Kolmogorov-Smirnova Shapiro-Wilk
Statistic df Sig. Statistic df Sig.
Insect Count Blue .180 50 .000 .922 50 .003
Green .188 50 .000 .908 50 .001
Orange .152 50 .005 .929 50 .005
Purple .181 50 .000 .935 50 .009
Red .168 50 .001 .915 50 .002
Yellow .188 50 .000 .908 50 .001
a. Lilliefors Significance Correction
As can be seen the normality assumption is violated for all the colors.
But Anova is robust to violation of normality to some extent and so it can be ignored.
4.
There should not be any outliers:
The boxplot shows that there aren’t any outliers.
2. The data is randomly sampled
3. Normality is not violated
Tests of Normality
Color
Kolmogorov-Smirnova Shapiro-Wilk
Statistic df Sig. Statistic df Sig.
Insect Count Blue .180 50 .000 .922 50 .003
Green .188 50 .000 .908 50 .001
Orange .152 50 .005 .929 50 .005
Purple .181 50 .000 .935 50 .009
Red .168 50 .001 .915 50 .002
Yellow .188 50 .000 .908 50 .001
a. Lilliefors Significance Correction
As can be seen the normality assumption is violated for all the colors.
But Anova is robust to violation of normality to some extent and so it can be ignored.
4.
There should not be any outliers:
The boxplot shows that there aren’t any outliers.
13MAT5212
References:
Berenson, M., Levine, D., Szabat, K. A., & Krehbiel, T. C. (2012). Basic business statistics:
Concepts and applications. Pearson higher education AU.
Bickel, P. J., & Doksum, K. A. (2015). Mathematical statistics: basic ideas and selected
topics, volume I (Vol. 117). CRC Press.
References:
Berenson, M., Levine, D., Szabat, K. A., & Krehbiel, T. C. (2012). Basic business statistics:
Concepts and applications. Pearson higher education AU.
Bickel, P. J., & Doksum, K. A. (2015). Mathematical statistics: basic ideas and selected
topics, volume I (Vol. 117). CRC Press.
1 out of 13
Related Documents


Your All-in-One AI-Powered Toolkit for Academic Success.
+13062052269
info@desklib.com
Available 24*7 on WhatsApp / Email
![[object Object]](/_next/static/media/star-bottom.7253800d.svg)
Unlock your academic potential
© 2024 | Zucol Services PVT LTD | All rights reserved.