Mathematics Questions and Solutions for Statistics and Analysis
VerifiedAdded on 2023/06/18
|15
|2033
|51
AI Summary
This article provides solutions for mathematics questions related to statistics, analysis, and break-even analysis. It covers topics such as coefficient of variation, critical path, regression equation, break-even point, and more. The article also includes tables, graphs, and formulas to help readers understand the concepts better.
Contribute Materials
Your contribution can guide someone’s learning journey. Share your
documents today.

Mathematics Questions
Secure Best Marks with AI Grader
Need help grading? Try our AI Grader for instant feedback on your assignments.
TABLE OF CONTENTS
TASK 1............................................................................................................................................4
a....................................................................................................................................................4
b...................................................................................................................................................4
TASK 2............................................................................................................................................5
a....................................................................................................................................................5
b...................................................................................................................................................6
c....................................................................................................................................................6
TASK 3............................................................................................................................................6
TASK 4............................................................................................................................................7
a....................................................................................................................................................7
b...................................................................................................................................................8
c....................................................................................................................................................8
TASK 5............................................................................................................................................8
a....................................................................................................................................................8
b...................................................................................................................................................9
c....................................................................................................................................................9
d...................................................................................................................................................9
e....................................................................................................................................................9
TASK 6..........................................................................................................................................10
a..................................................................................................................................................10
b.................................................................................................................................................10
TASK 7..........................................................................................................................................10
PART 2..........................................................................................................................................10
1.................................................................................................................................................10
2.................................................................................................................................................11
3.................................................................................................................................................12
4.................................................................................................................................................12
5.................................................................................................................................................13
6.................................................................................................................................................13
a..................................................................................................................................................13
b.................................................................................................................................................13
c..................................................................................................................................................13
d.................................................................................................................................................13
e..................................................................................................................................................14
f..................................................................................................................................................14
REFERENCES..............................................................................................................................15
PART 1
TASK 1
a.
Expenditure (£) on Stand Mixers
Mean 224.00
Standard Error 6.58
Median 224.00
Mode 224.00
Standard Deviation 75.00
Sample Variance 5625
Kurtosis -0.49
Skewness -0.32
Range 301.00
Minimum 68.00
Maximum 369.00
Sum 29120
Count 130
Coefficient of Variation 33.5%
b.
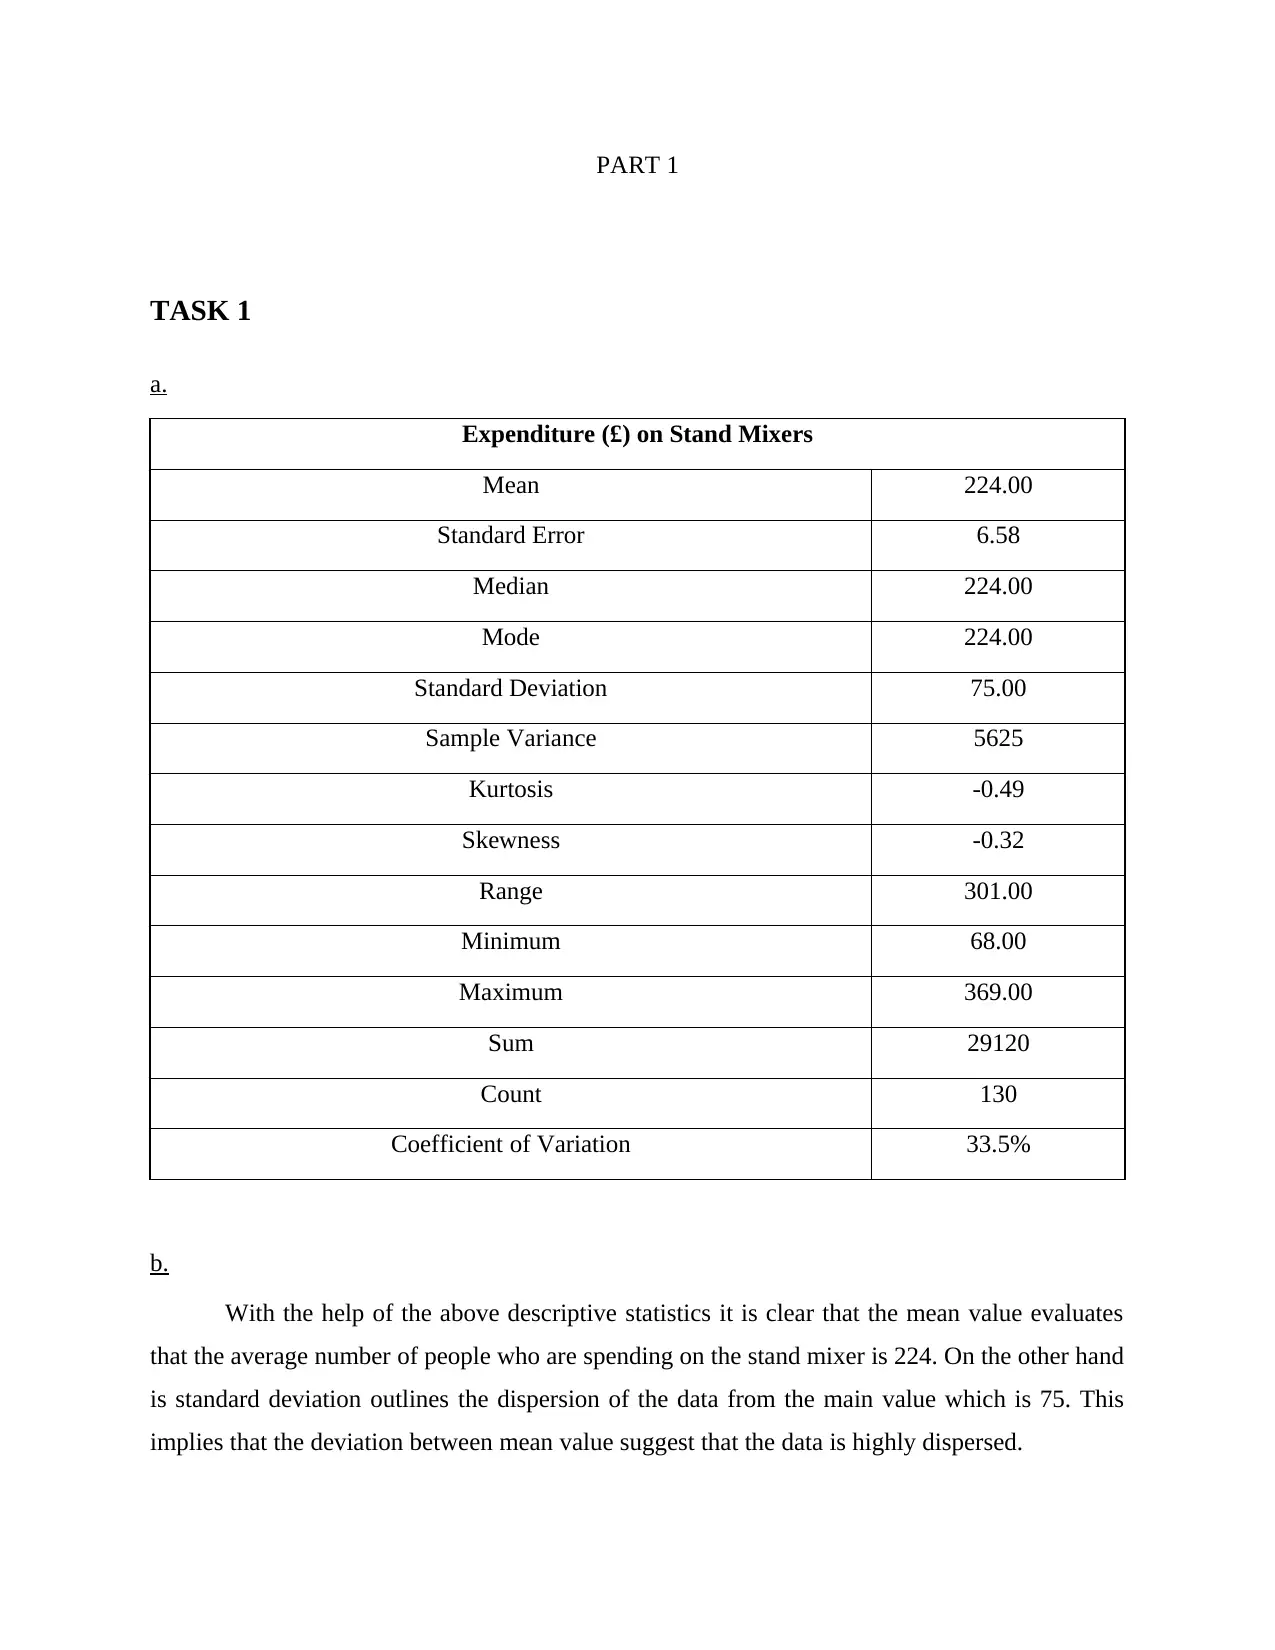
With the help of the above descriptive statistics it is clear that the mean value evaluates
that the average number of people who are spending on the stand mixer is 224. On the other hand
is standard deviation outlines the dispersion of the data from the main value which is 75. This
implies that the deviation between mean value suggest that the data is highly dispersed.
TASK 1
a.
Expenditure (£) on Stand Mixers
Mean 224.00
Standard Error 6.58
Median 224.00
Mode 224.00
Standard Deviation 75.00
Sample Variance 5625
Kurtosis -0.49
Skewness -0.32
Range 301.00
Minimum 68.00
Maximum 369.00
Sum 29120
Count 130
Coefficient of Variation 33.5%
b.
With the help of the above descriptive statistics it is clear that the mean value evaluates
that the average number of people who are spending on the stand mixer is 224. On the other hand
is standard deviation outlines the dispersion of the data from the main value which is 75. This
implies that the deviation between mean value suggest that the data is highly dispersed.
Secure Best Marks with AI Grader
Need help grading? Try our AI Grader for instant feedback on your assignments.
TASK 2
a.
1st Table
Expenditure (£) Frequency Frequency (%)
Under 100 14 11%
100 and under 200 35 27%
200 and under 300 65 50%
300 and over 16 12%
Total 130 100%
2nd Table
Expenditure (£) Frequency
Cumulative
Frequency
Cumulative
Frequency (%)
Under 100 14 14 10%
Under 200 35 49 34%
Under 300 65 100 68%
Under 400 16 81 55%
Total 130 146 100%
3rd Table
Expenditure (£) Frequency
(f)
midpoint
(x) fx (x-
mean)
(x-
mean)2
f(x-
mean)2
Under 100 14 50 700 -164 26846 375838
100 and under
200 35 150 5250 -64 4076 142672
200 and under
300 65 250 16250 36 1307 84962
300 and over 16 350 5600 136 18538 296606
Total 130 27800 900077
b.
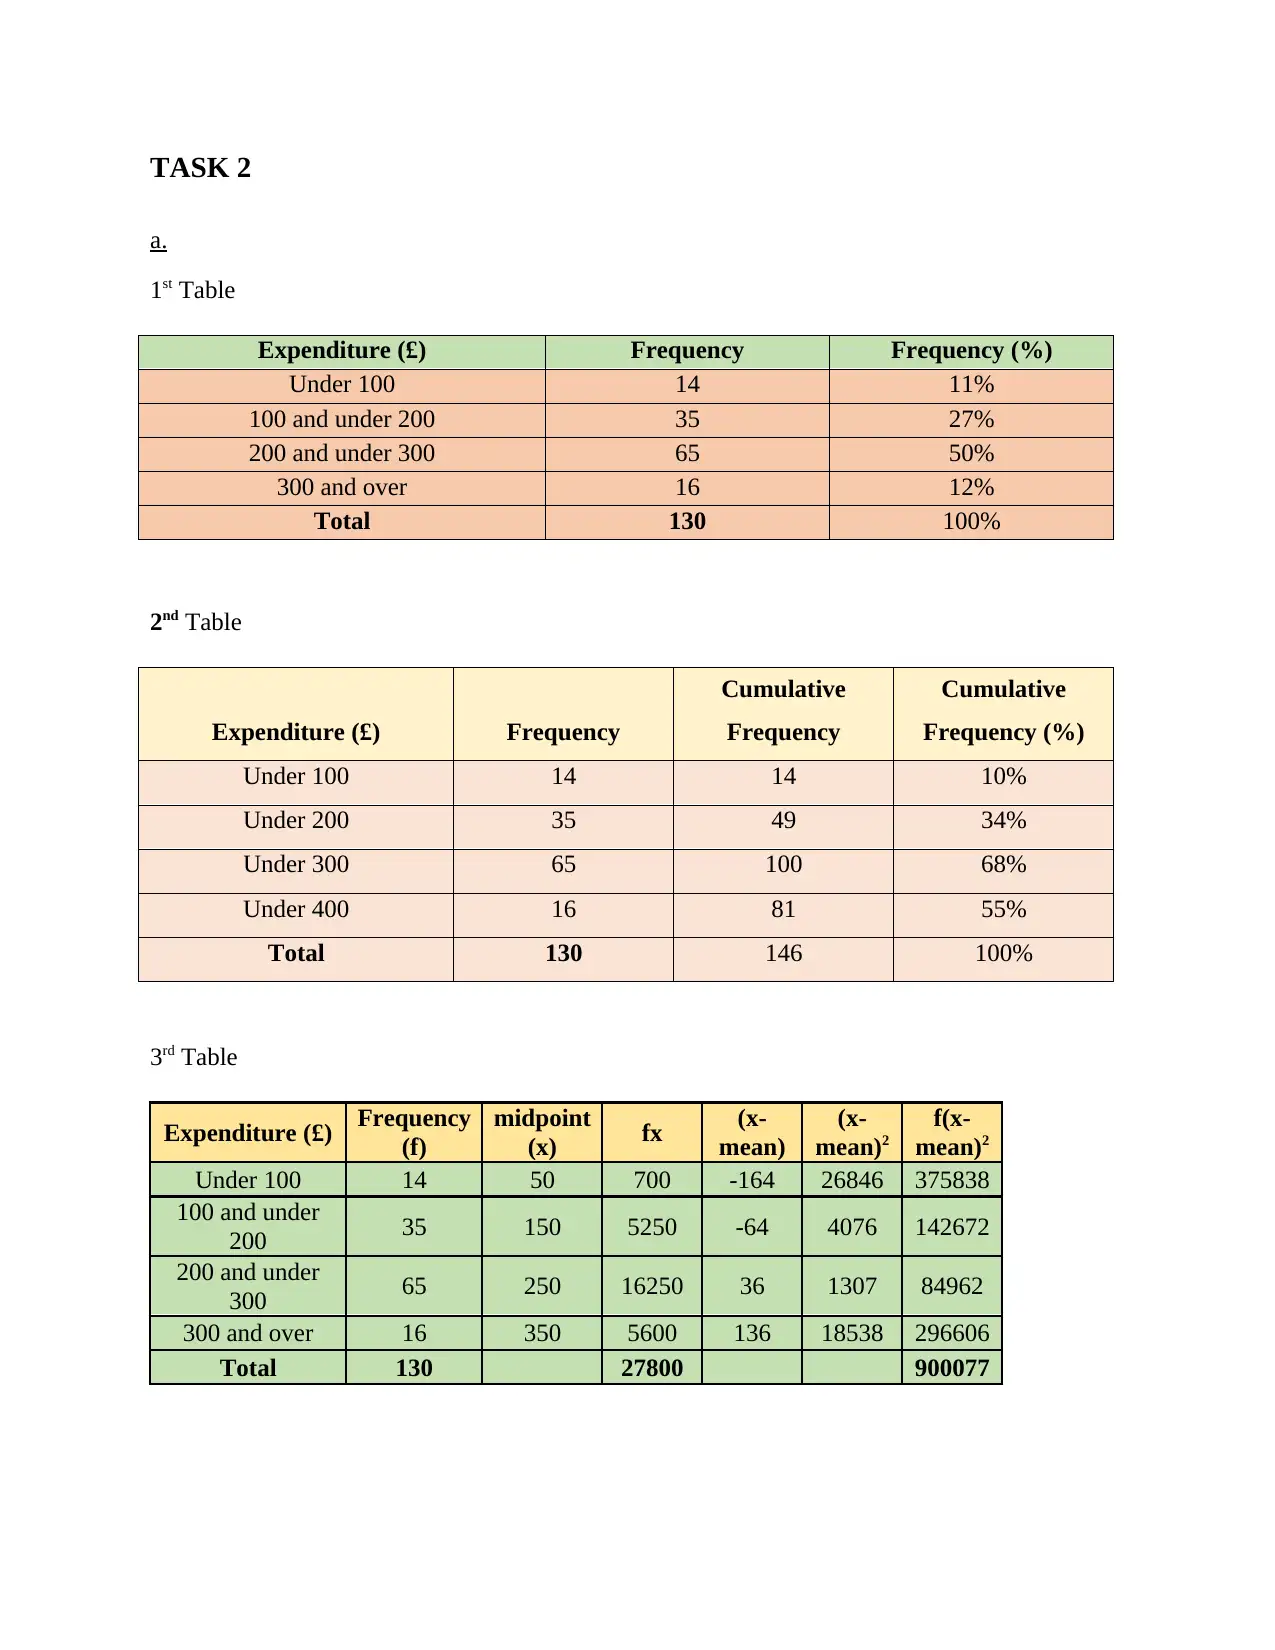
With the analysis of the above calculation it is clear that there is a difference within the
standard deviation and the mean value of both grouped and ungrouped data. This is particularly
because of the reason of class interval. This is particularly due to the reason that the class interval
makes a little difference within the mean value and the standard deviation of the data. In addition
to this the ungrouped data will be providing more accurate results because in this case there is no
midpoint theory being applicable at time of calculation.
c.
By referring to the ogive chart the calculation for estimated minimum amount of consumer
requiring spending on the stand mixer belonging to talk 25% in terms of expenditure is as
follows-
25% is the first quartile = ¼ (n+1)
= ¼ (4+1)
= 5/4 = 1.25 th term
= £14
Hence with the calculation of 25% it is clear that the minimum amount that consume spends on
stand mixer is £14.
TASK 3
The major difference within the time series data and cross sectional data is that the
former relates to focus on the same variable for over a different period of time. On the other hand
the cross-sectional data focuses majorly on different variables at a same point of time (Black,
2019). In the present case of kitchen appliance retailer the time series data will be beneficial
because the company wants to evaluate the demographic profile and lifestyle preference. Hence
due to this referring to same element over different period of time will be beneficial.
TASK 4
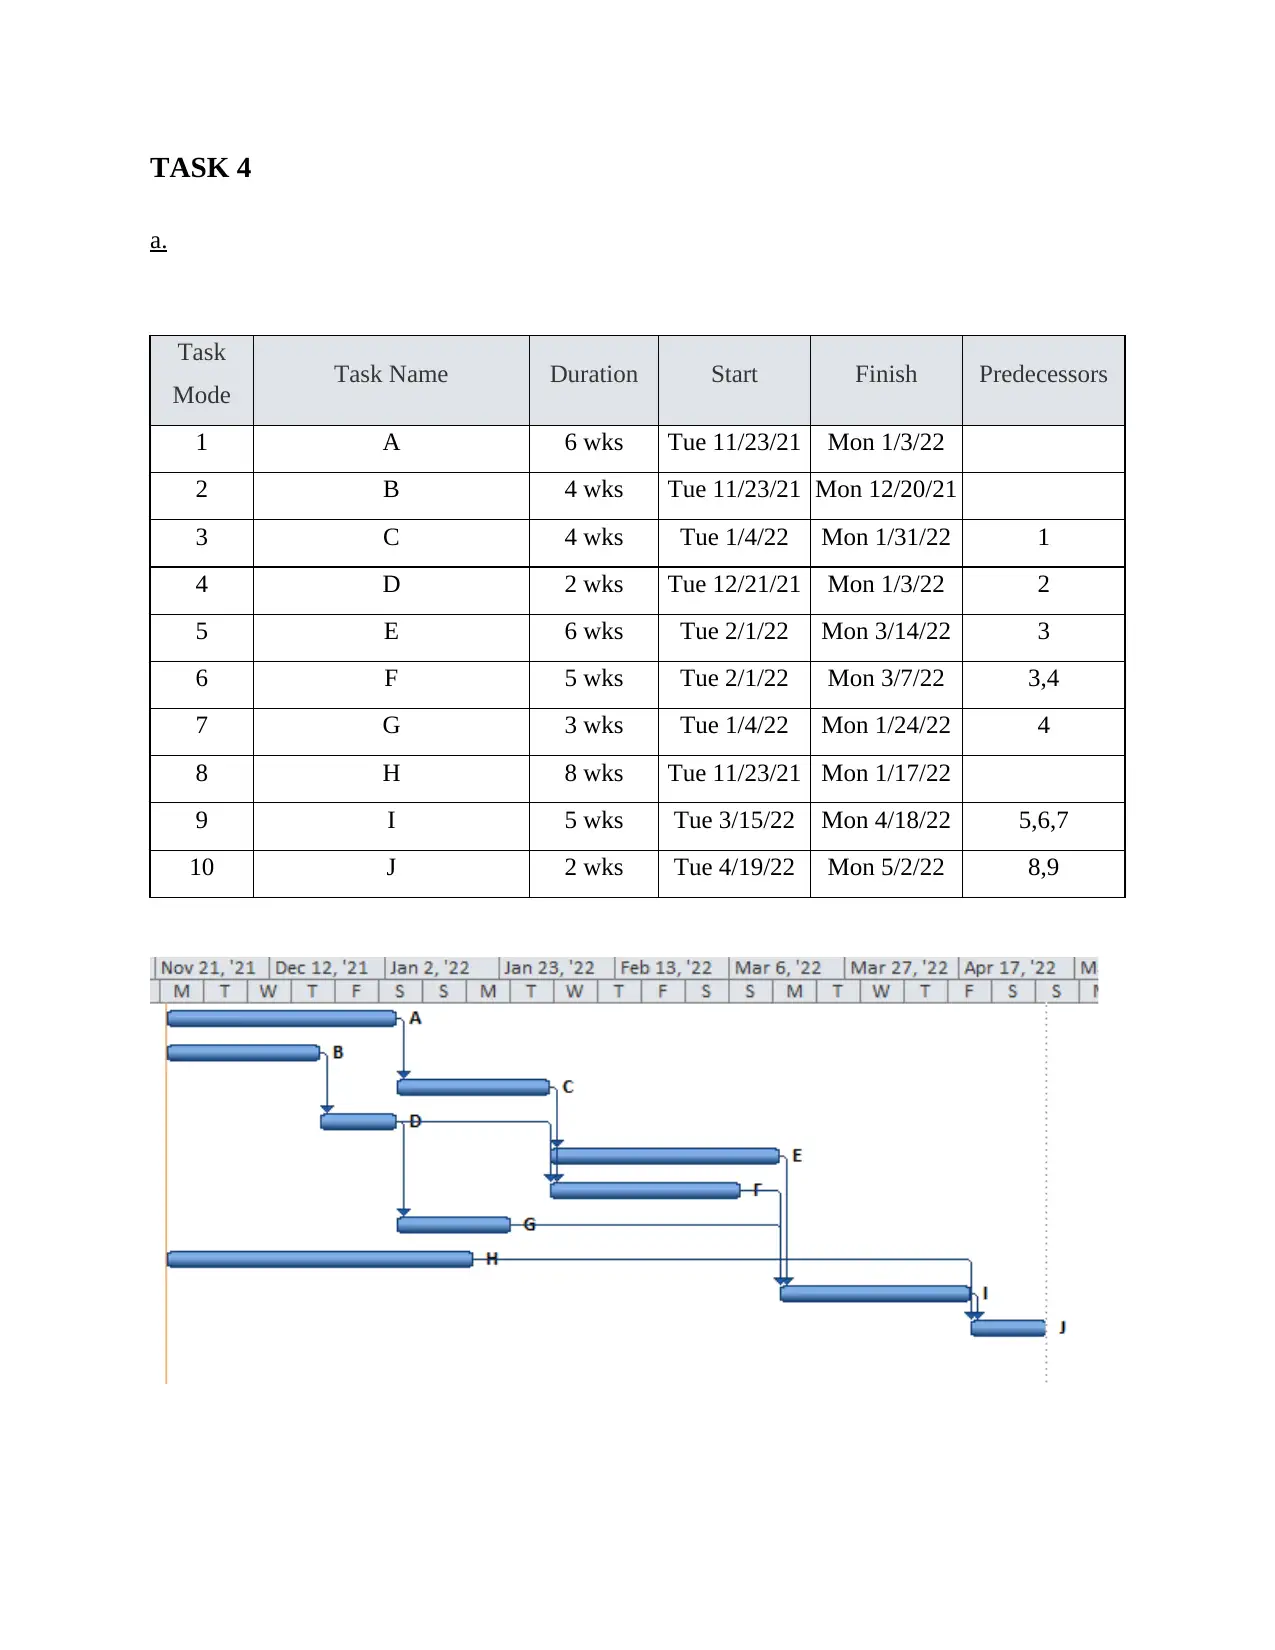
a.
Task
Mode Task Name Duration Start Finish Predecessors
1 A 6 wks Tue 11/23/21 Mon 1/3/22
2 B 4 wks Tue 11/23/21 Mon 12/20/21
3 C 4 wks Tue 1/4/22 Mon 1/31/22 1
4 D 2 wks Tue 12/21/21 Mon 1/3/22 2
5 E 6 wks Tue 2/1/22 Mon 3/14/22 3
6 F 5 wks Tue 2/1/22 Mon 3/7/22 3,4
7 G 3 wks Tue 1/4/22 Mon 1/24/22 4
8 H 8 wks Tue 11/23/21 Mon 1/17/22
9 I 5 wks Tue 3/15/22 Mon 4/18/22 5,6,7
10 J 2 wks Tue 4/19/22 Mon 5/2/22 8,9
Paraphrase This Document
Need a fresh take? Get an instant paraphrase of this document with our AI Paraphraser
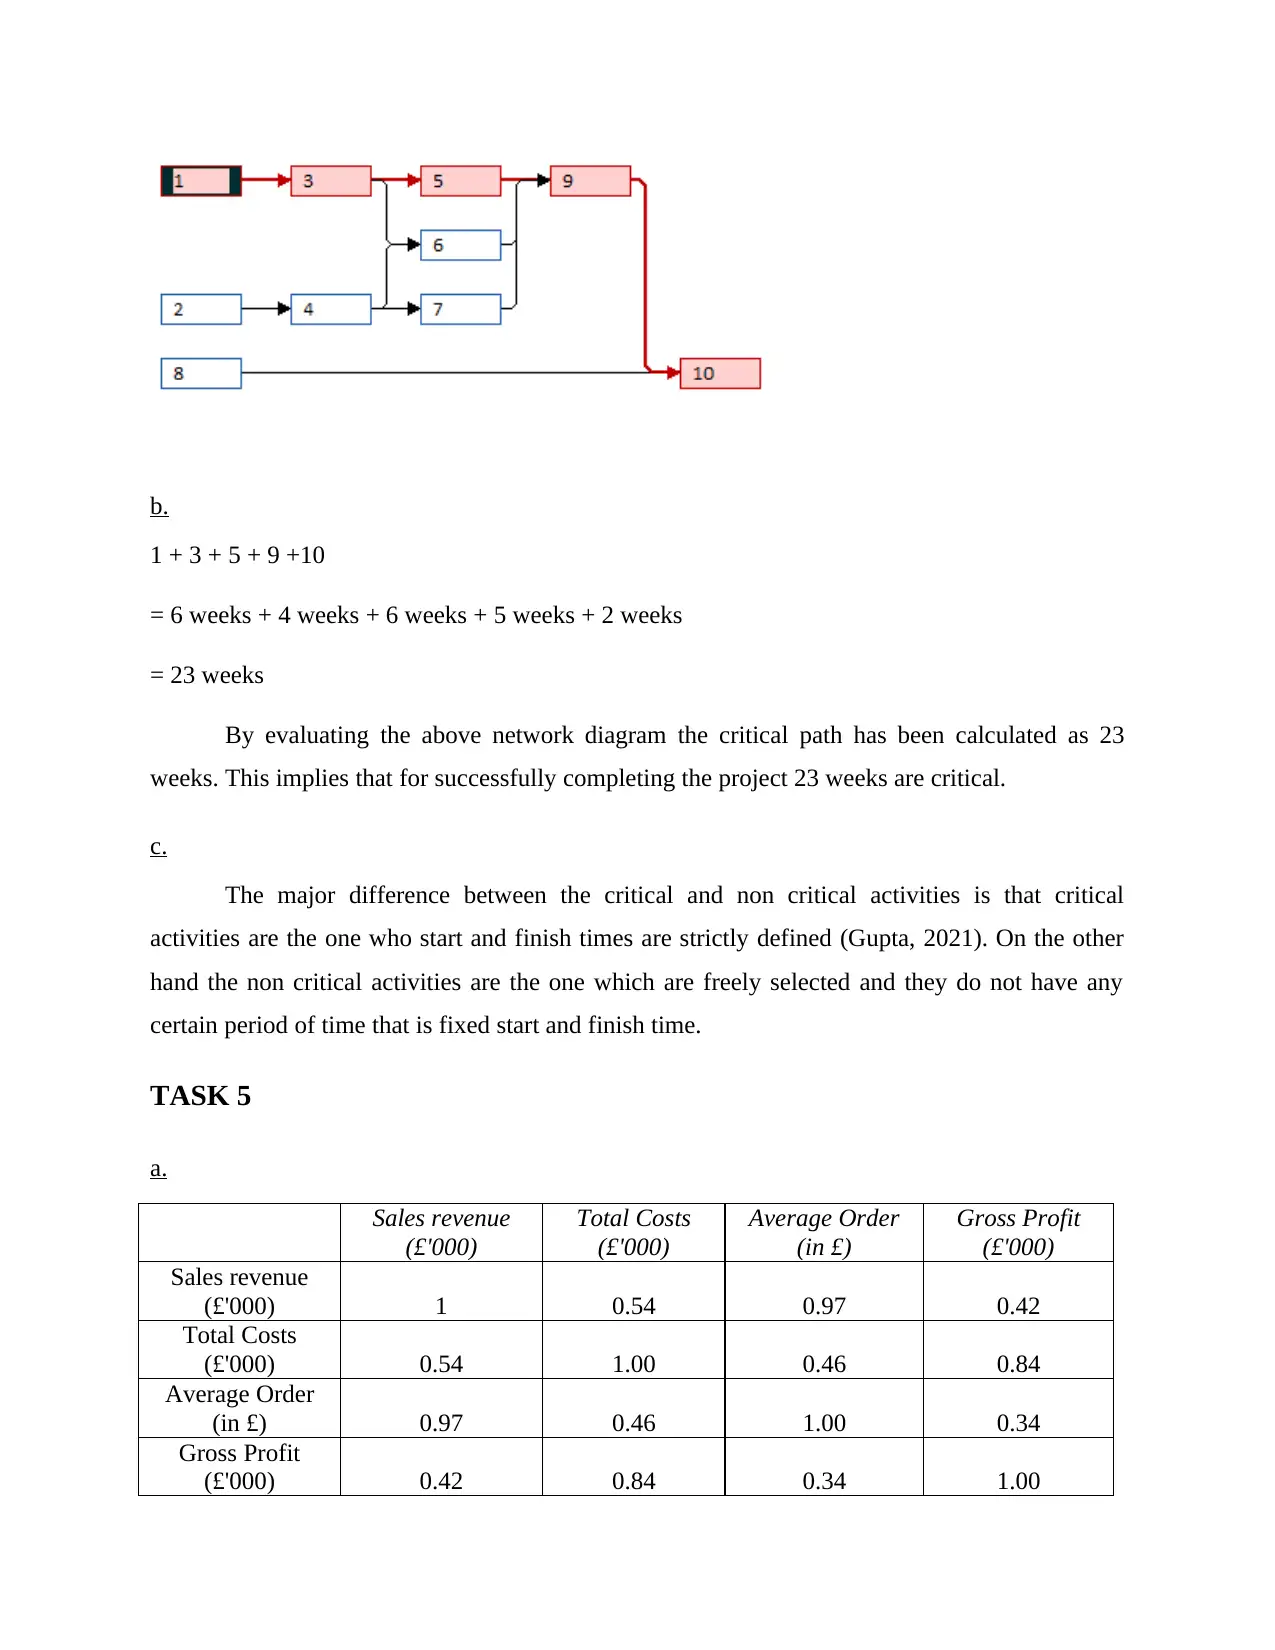
b.
1 + 3 + 5 + 9 +10
= 6 weeks + 4 weeks + 6 weeks + 5 weeks + 2 weeks
= 23 weeks
By evaluating the above network diagram the critical path has been calculated as 23
weeks. This implies that for successfully completing the project 23 weeks are critical.
c.
The major difference between the critical and non critical activities is that critical
activities are the one who start and finish times are strictly defined (Gupta, 2021). On the other
hand the non critical activities are the one which are freely selected and they do not have any
certain period of time that is fixed start and finish time.
TASK 5
a.
Sales revenue
(£'000)
Total Costs
(£'000)
Average Order
(in £)
Gross Profit
(£'000)
Sales revenue
(£'000) 1 0.54 0.97 0.42
Total Costs
(£'000) 0.54 1.00 0.46 0.84
Average Order
(in £) 0.97 0.46 1.00 0.34
Gross Profit
(£'000) 0.42 0.84 0.34 1.00
b.
The best predictor for the quarterly sales revenue is quarter 2 of 2020. This is particularly
because of the reason that in this the sales revenue is highest and the average order value is also
the maximum. This is the best protector of sales revenue.
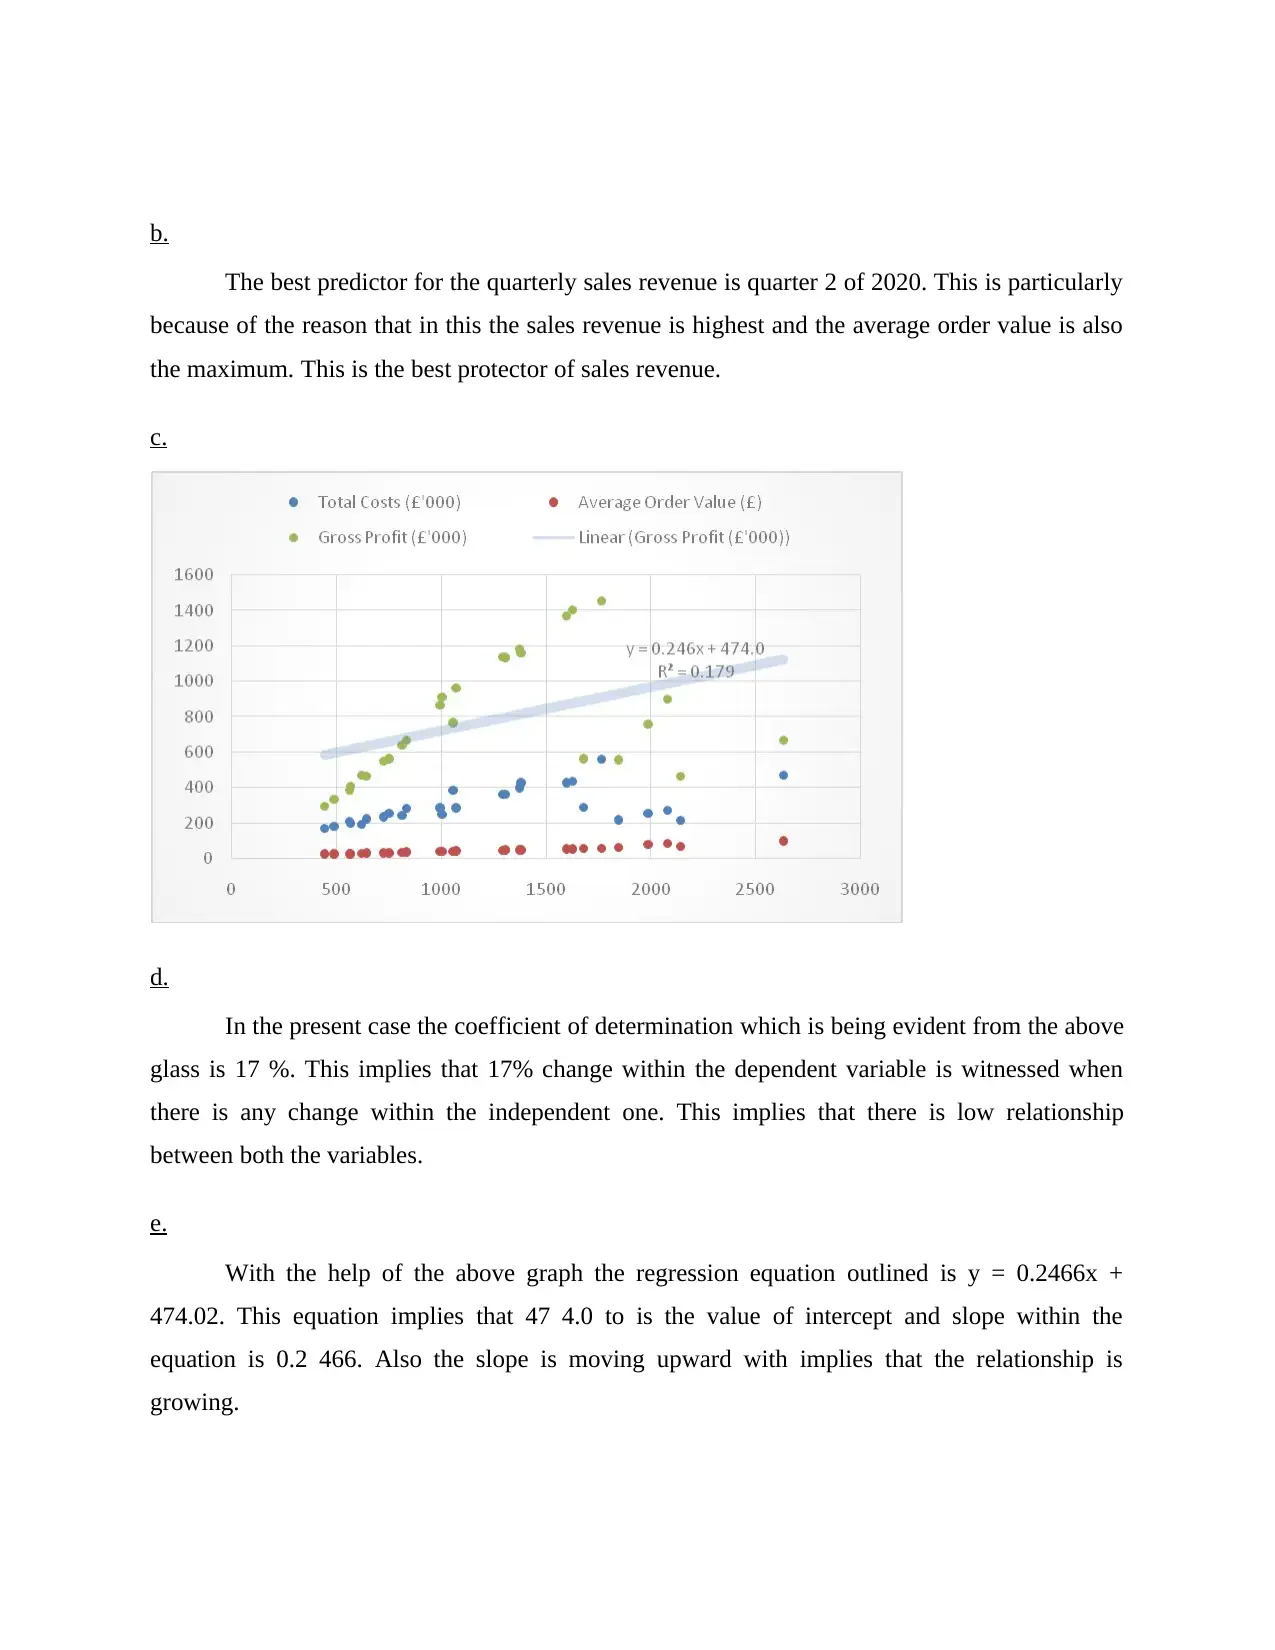
c.
d.
In the present case the coefficient of determination which is being evident from the above
glass is 17 %. This implies that 17% change within the dependent variable is witnessed when
there is any change within the independent one. This implies that there is low relationship
between both the variables.
e.
With the help of the above graph the regression equation outlined is y = 0.2466x +
474.02. This equation implies that 47 4.0 to is the value of intercept and slope within the
equation is 0.2 466. Also the slope is moving upward with implies that the relationship is
growing.
The best predictor for the quarterly sales revenue is quarter 2 of 2020. This is particularly
because of the reason that in this the sales revenue is highest and the average order value is also
the maximum. This is the best protector of sales revenue.
c.
d.
In the present case the coefficient of determination which is being evident from the above
glass is 17 %. This implies that 17% change within the dependent variable is witnessed when
there is any change within the independent one. This implies that there is low relationship
between both the variables.
e.
With the help of the above graph the regression equation outlined is y = 0.2466x +
474.02. This equation implies that 47 4.0 to is the value of intercept and slope within the
equation is 0.2 466. Also the slope is moving upward with implies that the relationship is
growing.
TASK 6
a.
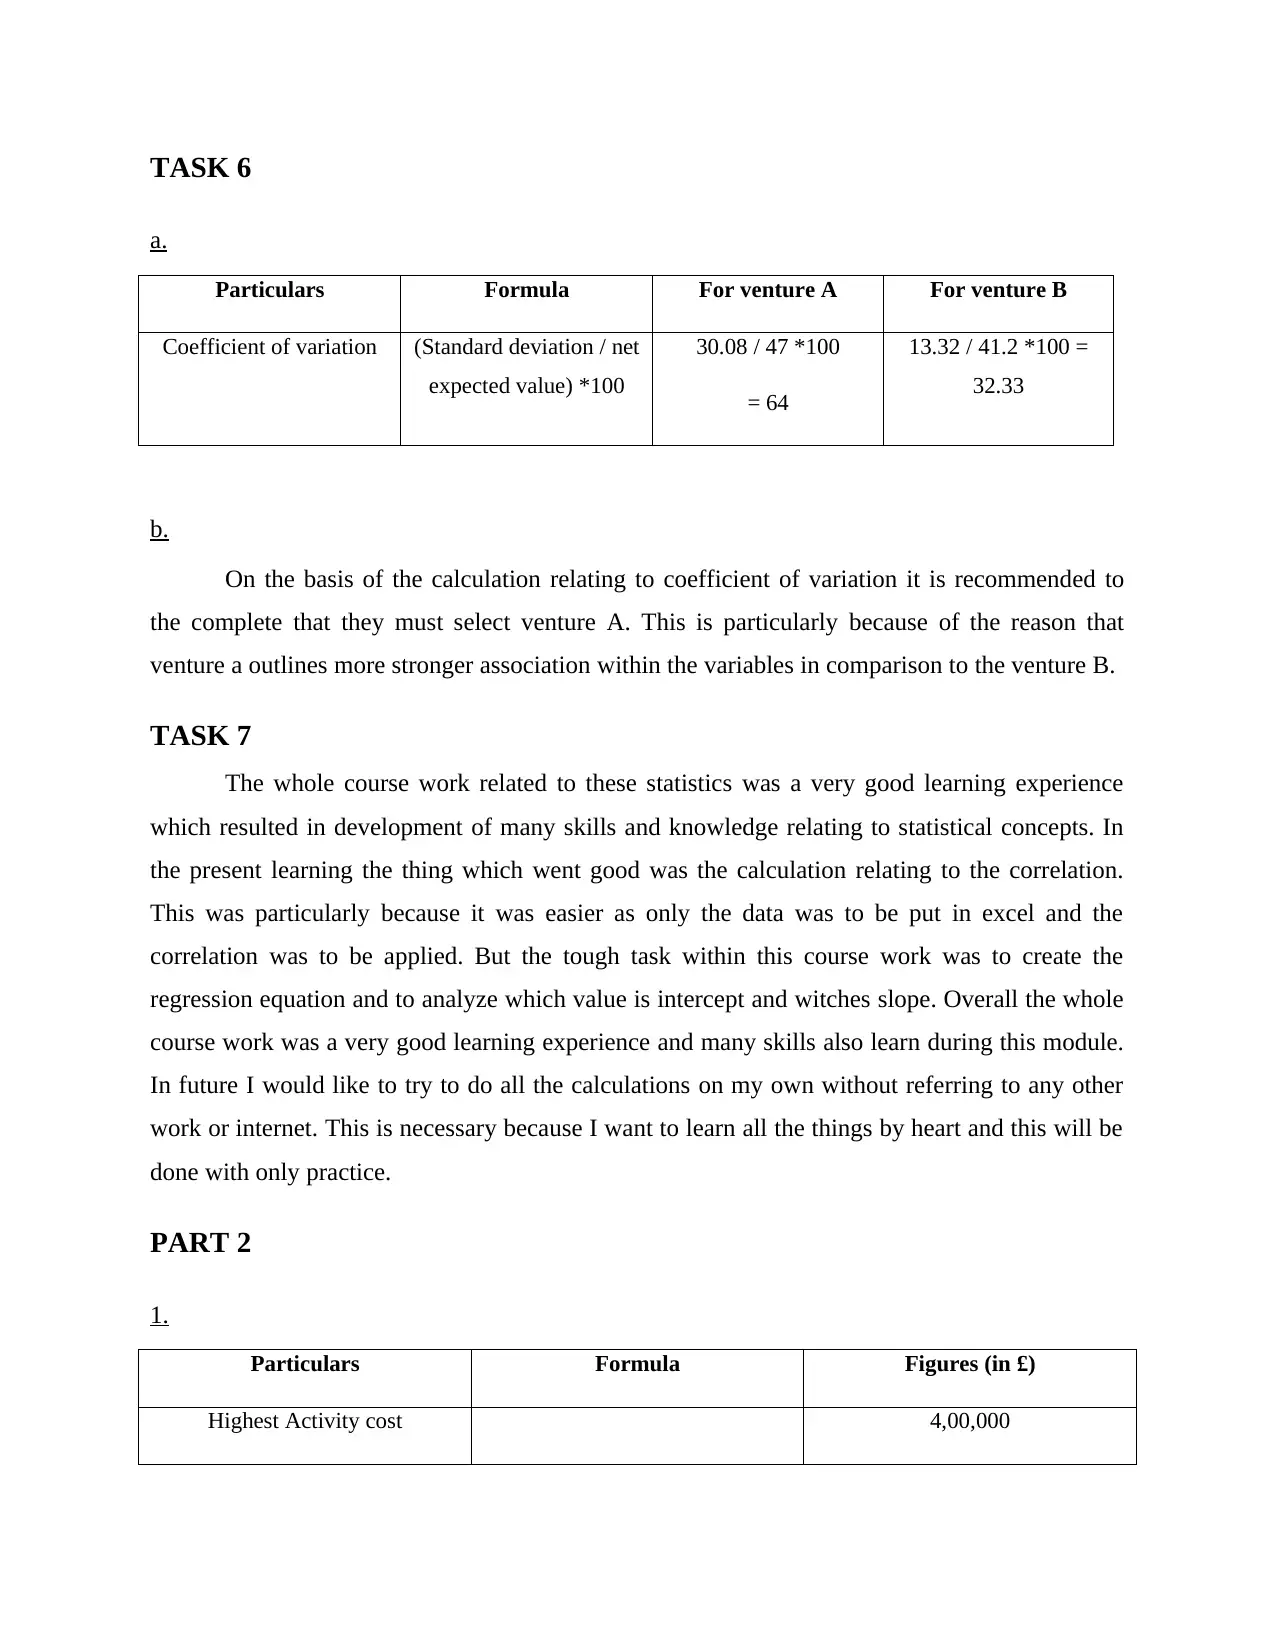
Particulars Formula For venture A For venture B
Coefficient of variation (Standard deviation / net
expected value) *100
30.08 / 47 *100
= 64
13.32 / 41.2 *100 =
32.33
b.
On the basis of the calculation relating to coefficient of variation it is recommended to
the complete that they must select venture A. This is particularly because of the reason that
venture a outlines more stronger association within the variables in comparison to the venture B.
TASK 7
The whole course work related to these statistics was a very good learning experience
which resulted in development of many skills and knowledge relating to statistical concepts. In
the present learning the thing which went good was the calculation relating to the correlation.
This was particularly because it was easier as only the data was to be put in excel and the
correlation was to be applied. But the tough task within this course work was to create the
regression equation and to analyze which value is intercept and witches slope. Overall the whole
course work was a very good learning experience and many skills also learn during this module.
In future I would like to try to do all the calculations on my own without referring to any other
work or internet. This is necessary because I want to learn all the things by heart and this will be
done with only practice.
PART 2
1.
Particulars Formula Figures (in £)
Highest Activity cost 4,00,000
a.
Particulars Formula For venture A For venture B
Coefficient of variation (Standard deviation / net
expected value) *100
30.08 / 47 *100
= 64
13.32 / 41.2 *100 =
32.33
b.
On the basis of the calculation relating to coefficient of variation it is recommended to
the complete that they must select venture A. This is particularly because of the reason that
venture a outlines more stronger association within the variables in comparison to the venture B.
TASK 7
The whole course work related to these statistics was a very good learning experience
which resulted in development of many skills and knowledge relating to statistical concepts. In
the present learning the thing which went good was the calculation relating to the correlation.
This was particularly because it was easier as only the data was to be put in excel and the
correlation was to be applied. But the tough task within this course work was to create the
regression equation and to analyze which value is intercept and witches slope. Overall the whole
course work was a very good learning experience and many skills also learn during this module.
In future I would like to try to do all the calculations on my own without referring to any other
work or internet. This is necessary because I want to learn all the things by heart and this will be
done with only practice.
PART 2
1.
Particulars Formula Figures (in £)
Highest Activity cost 4,00,000
Secure Best Marks with AI Grader
Need help grading? Try our AI Grader for instant feedback on your assignments.
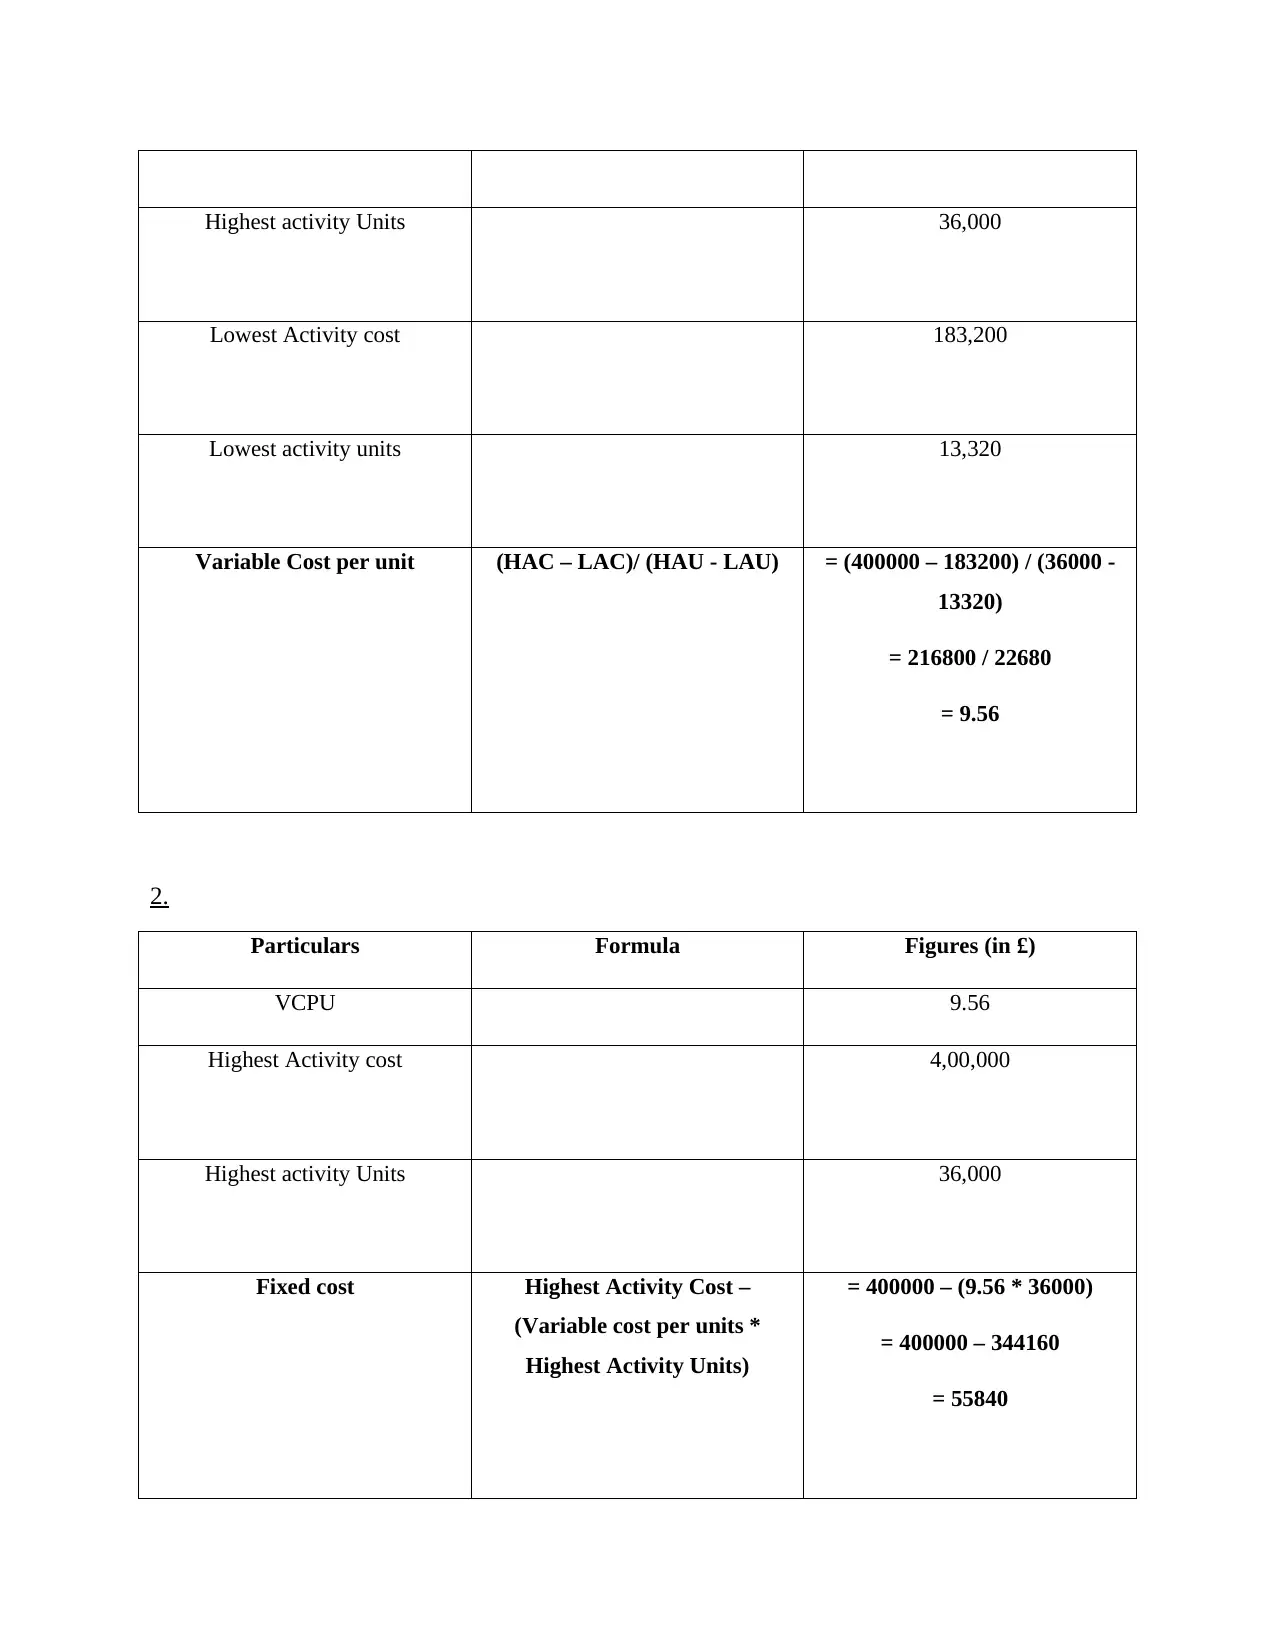
Highest activity Units 36,000
Lowest Activity cost 183,200
Lowest activity units 13,320
Variable Cost per unit (HAC – LAC)/ (HAU - LAU) = (400000 – 183200) / (36000 -
13320)
= 216800 / 22680
= 9.56
2.
Particulars Formula Figures (in £)
VCPU 9.56
Highest Activity cost 4,00,000
Highest activity Units 36,000
Fixed cost Highest Activity Cost –
(Variable cost per units *
Highest Activity Units)
= 400000 – (9.56 * 36000)
= 400000 – 344160
= 55840
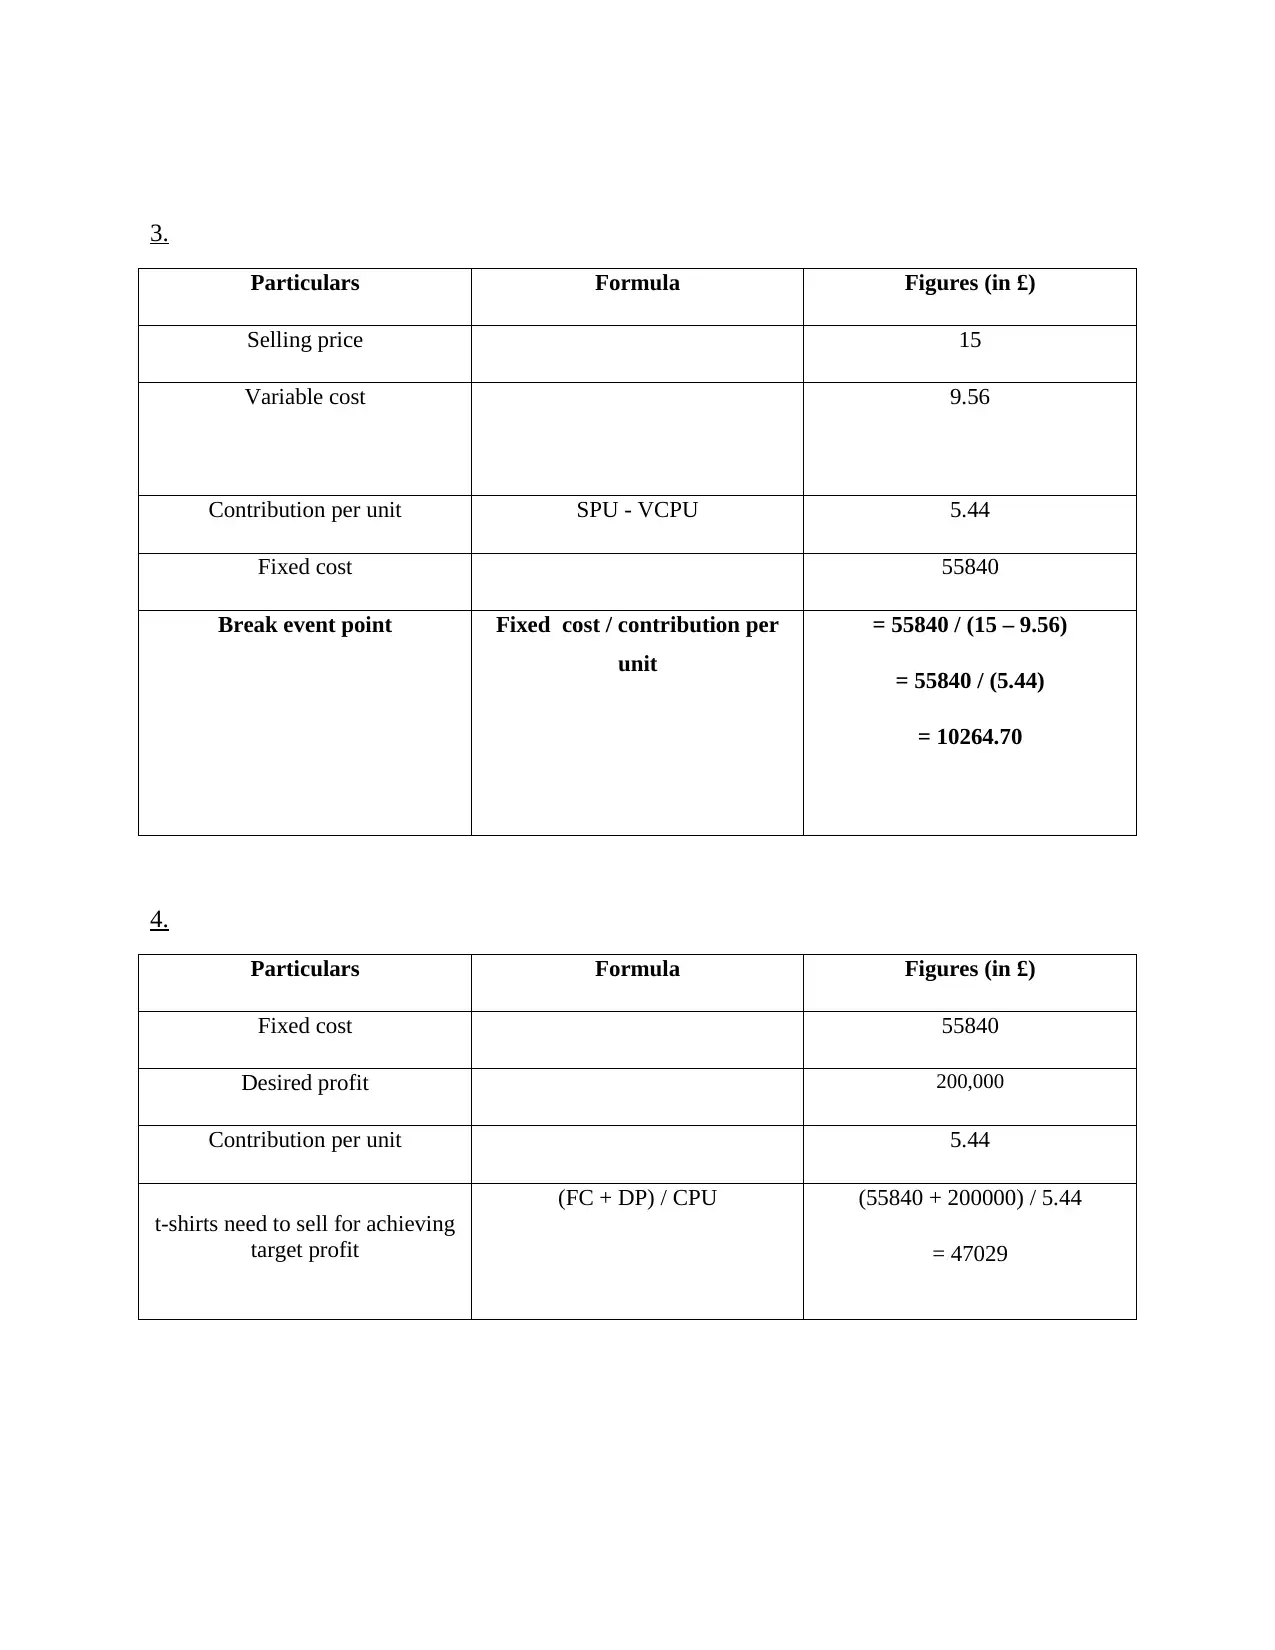
3.
Particulars Formula Figures (in £)
Selling price 15
Variable cost 9.56
Contribution per unit SPU - VCPU 5.44
Fixed cost 55840
Break event point Fixed cost / contribution per
unit
= 55840 / (15 – 9.56)
= 55840 / (5.44)
= 10264.70
4.
Particulars Formula Figures (in £)
Fixed cost 55840
Desired profit 200,000
Contribution per unit 5.44
t-shirts need to sell for achieving
target profit
(FC + DP) / CPU (55840 + 200000) / 5.44
= 47029
Particulars Formula Figures (in £)
Selling price 15
Variable cost 9.56
Contribution per unit SPU - VCPU 5.44
Fixed cost 55840
Break event point Fixed cost / contribution per
unit
= 55840 / (15 – 9.56)
= 55840 / (5.44)
= 10264.70
4.
Particulars Formula Figures (in £)
Fixed cost 55840
Desired profit 200,000
Contribution per unit 5.44
t-shirts need to sell for achieving
target profit
(FC + DP) / CPU (55840 + 200000) / 5.44
= 47029
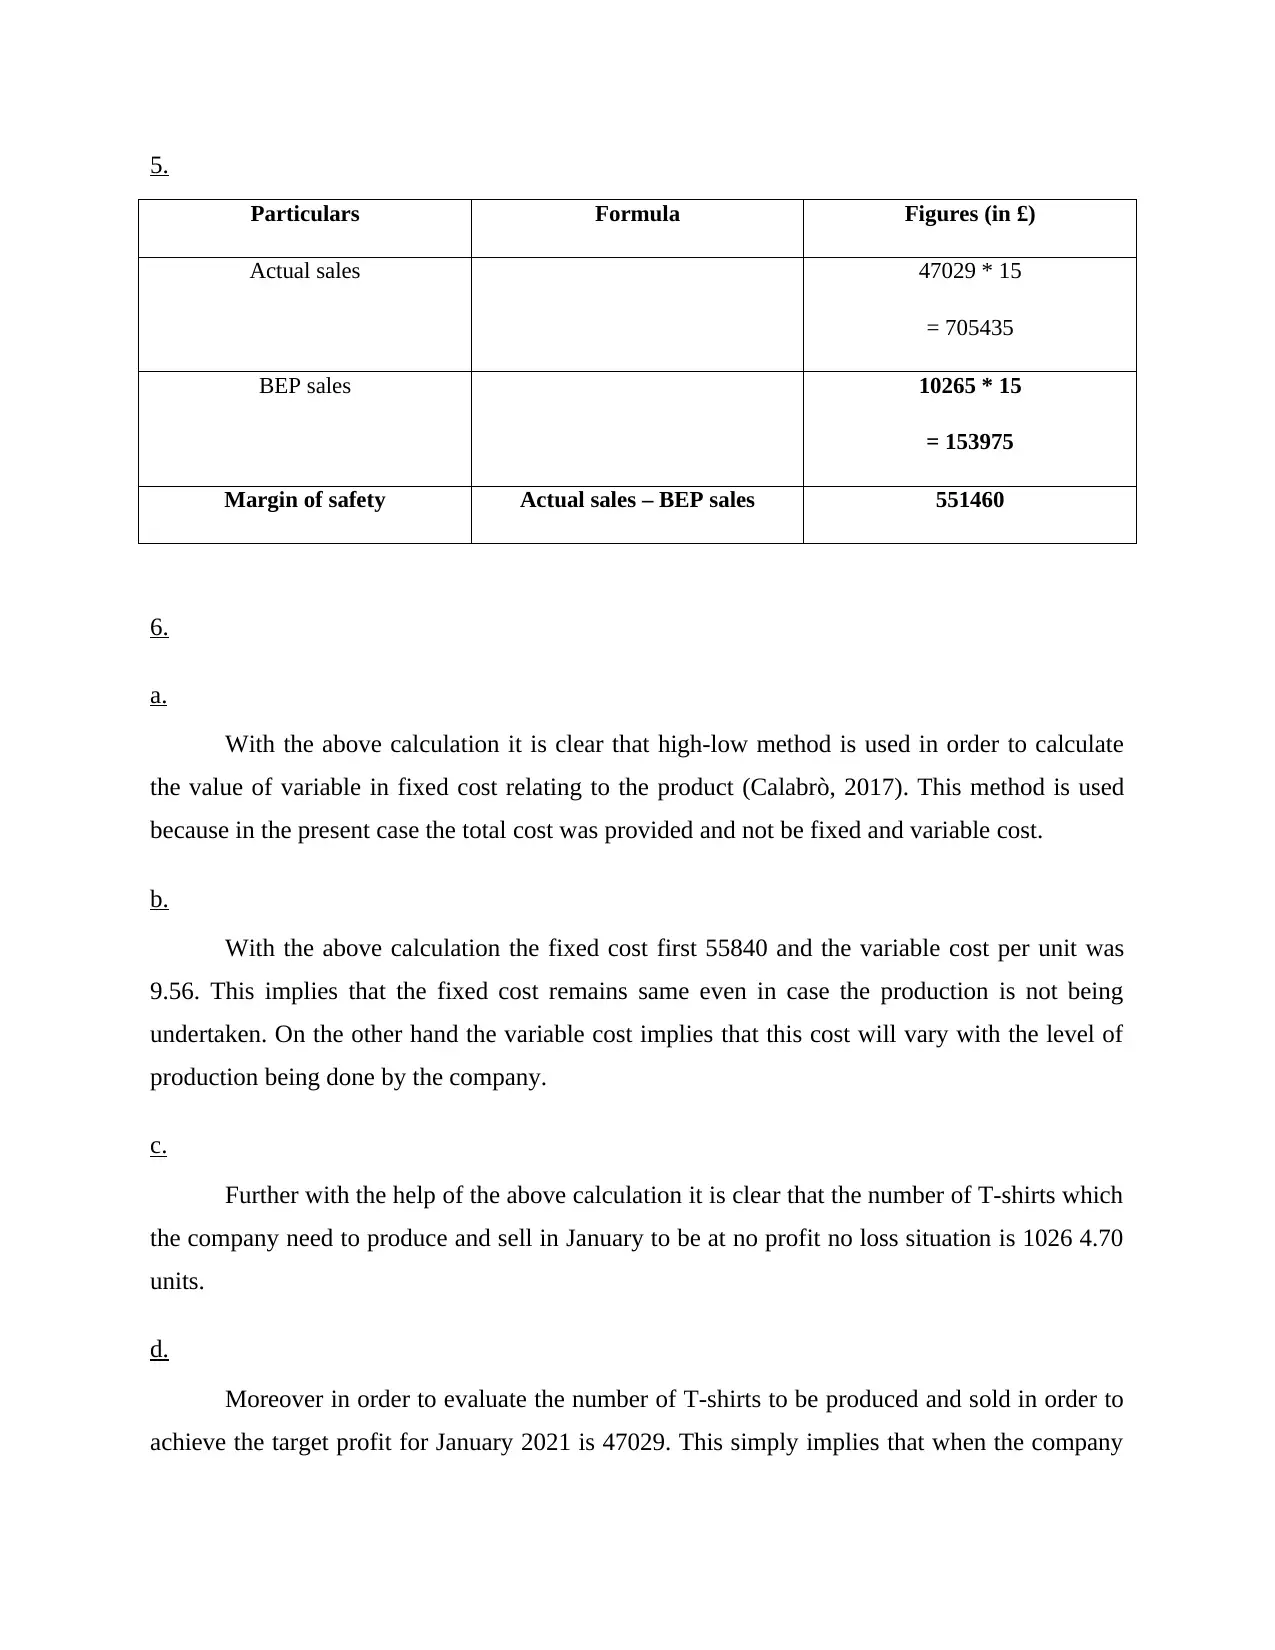
5.
Particulars Formula Figures (in £)
Actual sales 47029 * 15
= 705435
BEP sales 10265 * 15
= 153975
Margin of safety Actual sales – BEP sales 551460
6.
a.
With the above calculation it is clear that high-low method is used in order to calculate
the value of variable in fixed cost relating to the product (Calabrò, 2017). This method is used
because in the present case the total cost was provided and not be fixed and variable cost.
b.
With the above calculation the fixed cost first 55840 and the variable cost per unit was
9.56. This implies that the fixed cost remains same even in case the production is not being
undertaken. On the other hand the variable cost implies that this cost will vary with the level of
production being done by the company.
c.
Further with the help of the above calculation it is clear that the number of T-shirts which
the company need to produce and sell in January to be at no profit no loss situation is 1026 4.70
units.
d.
Moreover in order to evaluate the number of T-shirts to be produced and sold in order to
achieve the target profit for January 2021 is 47029. This simply implies that when the company
Paraphrase This Document
Need a fresh take? Get an instant paraphrase of this document with our AI Paraphraser
wants to earn the target profit of 20000 in the month of January 10 they need to produce at least
470229 t-shirt.
e.
In addition to this with the help of the margin of safety it is clearly evident that the
difference between the actual and the BEP sales is 551460. this margin of safety assist company
in evaluating the fact that how much cells can be decreased before it company reaches or
becomes unprofitable.
f.
In the present situation the major limitation of using break even analysis is that this
method assume that this fixed cost will remain constant at all levels of activities (Sintha, 2020).
But in actual it is not necessary that fixed cost remains fixed throughout the production process.
REFERENCES
Books and journal
Black, K., 2019. Business statistics: for contemporary decision making. John Wiley & Sons.
Gupta, A., 2021. Business Statistics. RAJEEV BANSAL.
Calabrò, F., 2017, July. Local communities and management of cultural heritage of the inner
areas. An application of break-even analysis. In International Conference on
Computational Science and Its Applications (pp. 516-531). Springer, Cham.
Sintha, L., 2020. Importance of Break-Even Analysis for the Micro, Small and Medium
Enterprises. International Journal of Research-Granthaalayah, 8(6).
1 out of 15
Related Documents


Your All-in-One AI-Powered Toolkit for Academic Success.
+13062052269
info@desklib.com
Available 24*7 on WhatsApp / Email
![[object Object]](/_next/static/media/star-bottom.7253800d.svg)
Unlock your academic potential
© 2024 | Zucol Services PVT LTD | All rights reserved.