Understanding and Managing Data: Analysis and Interpretation
Added on 2023-06-14
12 Pages1827 Words53 Views
MN4063QA
Understanding and
Managing Data
Understanding and
Managing Data
Contents
Main Body.......................................................................................................................................3
Task 1...............................................................................................................................................3
(a) Calculate variance and sum....................................................................................................3
(b) Interpret the mean and standard deviation from the given data.............................................3
Task 2...............................................................................................................................................4
(a) Fill in the following table by extracting value from the table................................................4
(b) State the reason of difference in standard deviation and mean of ungrouped and grouped
data...............................................................................................................................................5
(c) Comment on minimum spend by the consumer to spend......................................................5
TASK 3............................................................................................................................................5
Explain the difference between time series data and cross sectional data with references to the
examples by considering lifestyle and demographic nature of consumers..................................5
TASK 4............................................................................................................................................6
(a) Construct a network diagram that shows a backward and forward movement......................6
(b) Categorise critical path and time period of project................................................................7
(c) State the difference between non-critical and critical activities.............................................7
TASK 5............................................................................................................................................8
(a) Evolve a correlation matrix and also work out on coefficient between different variables
and quarterly revenue..................................................................................................................8
(b) Identify the predictor of quarterly sales and also explain its reasons....................................8
(c) Construct a scatter graph and also show the trend line of regression equation......................8
(d) Analyse the coefficient of correlation and its determination.................................................8
(e) Interpret the values and also state the equation......................................................................8
Task 6...............................................................................................................................................9
1. Calculate coefficient of variation for both the business A and B............................................9
2. By considering an assumption, and also the risk of the retailers, choose project accordingly.
.....................................................................................................................................................9
TASK 7............................................................................................................................................9
PART 2............................................................................................................................................9
1. Anticipate the variable cost with the help of high-low demand..............................................9
2. Compute monthly fixed cost....................................................................................................9
3. Compute break-even of January............................................................................................10
5. Compute margin of safety.....................................................................................................10
6. Interpret the calculation.........................................................................................................10
REFERENCES..............................................................................................................................11
Main Body
Task 1
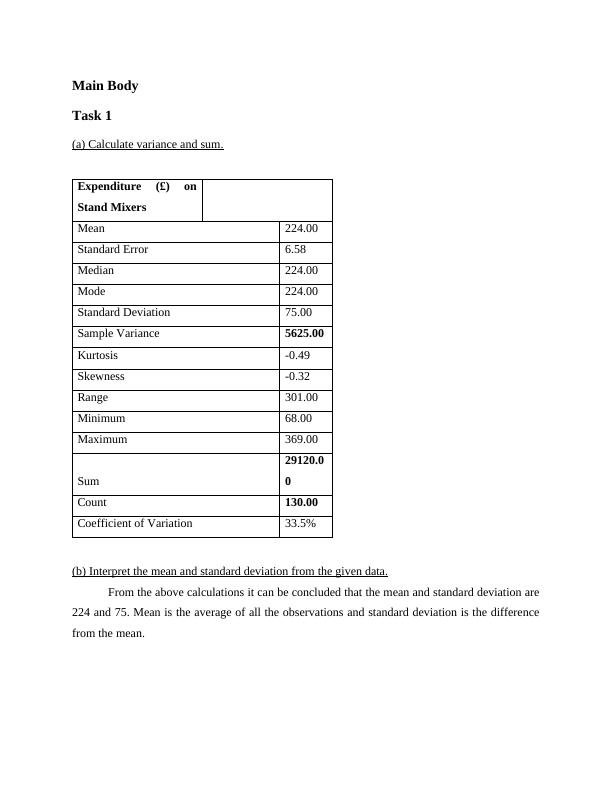
(a) Calculate variance and sum.
Expenditure (£) on
Stand Mixers
Mean 224.00
Standard Error 6.58
Median 224.00
Mode 224.00
Standard Deviation 75.00
Sample Variance 5625.00
Kurtosis -0.49
Skewness -0.32
Range 301.00
Minimum 68.00
Maximum 369.00
Sum
29120.0
0
Count 130.00
Coefficient of Variation 33.5%
(b) Interpret the mean and standard deviation from the given data.
From the above calculations it can be concluded that the mean and standard deviation are
224 and 75. Mean is the average of all the observations and standard deviation is the difference
from the mean.
Task 1
(a) Calculate variance and sum.
Expenditure (£) on
Stand Mixers
Mean 224.00
Standard Error 6.58
Median 224.00
Mode 224.00
Standard Deviation 75.00
Sample Variance 5625.00
Kurtosis -0.49
Skewness -0.32
Range 301.00
Minimum 68.00
Maximum 369.00
Sum
29120.0
0
Count 130.00
Coefficient of Variation 33.5%
(b) Interpret the mean and standard deviation from the given data.
From the above calculations it can be concluded that the mean and standard deviation are
224 and 75. Mean is the average of all the observations and standard deviation is the difference
from the mean.
End of preview
Want to access all the pages? Upload your documents or become a member.
Related Documents
MN4063QA Understanding and Managing Data - Deskliblg...
|14
|1677
|203
MN4063QA July21 Coursework 1 - Deskliblg...
|12
|2356
|338
Mathematics Questions and Solutions for Statistics and Analysislg...
|15
|2033
|51
Understanding and Managing Data - Deskliblg...
|11
|2118
|435
Understanding and Managing Data: Analysis and Interpretationlg...
|15
|2540
|111
Descriptive Statistics Coursework with Tasks and Analysislg...
|11
|1466
|331