MN4063QA July21 Coursework 1 - Desklib
VerifiedAdded on 2023/06/15
|12
|2356
|338
AI Summary
MN4063QA July21 Coursework 1 includes tasks on calculating sum and variance, difference between cross-sectional and time series data, critical and non-critical activities, correlation matrix, regression equation, coefficient of variation, break-even analysis, and margin of safety. The content mentions subject, course code, course name, and college/university.
Contribute Materials
Your contribution can guide someone’s learning journey. Share your
documents today.

MN4063QA July21
Coursework 1
Coursework 1
Secure Best Marks with AI Grader
Need help grading? Try our AI Grader for instant feedback on your assignments.
Contents
PART 1...................................................................................................................................................4
TASK 1....................................................................................................................................................4
(a) Calculate the sum and variance....................................................................................................4
(b) Infer the mean and standard deviation from the data given.......................................................4
TASK 2....................................................................................................................................................4
(a) Complete the following tables by extracting the values...............................................................4
(b) Give the reason of difference in mean and standard deviation of grouped and ungrouped data
and which one is more accurate?......................................................................................................5
(c) Comment on the minimum amount of the consumer needs estimated to spend........................5
TASK 3....................................................................................................................................................6
Give the difference between the cross – sectional data and time series data with reference to the
examples considering the demographic profile and lifestyle nature of the consumers....................6
TASK 4....................................................................................................................................................7
(a) Frame a network diagram which shows the movement of forwards and backward passes of the
activities.............................................................................................................................................7
(b) Classify the critical path and duration of the project...................................................................8
(c) Differentiate between critical and non – critical activities............................................................8
TASK 5....................................................................................................................................................9
(a) Develop a correlation matrix and work out the coefficients between quarterly revenues and
different variables..............................................................................................................................9
(b) Identify the best predictor of the quarterly sales, explain the reason.........................................9
(c) Draw a scatter graph and show a trend line of the regression equation......................................9
(d) Interpret the coefficient of correlation and determination........................................................10
(e) State the equation of regression and interpret the value of intercepts.....................................10
TASK 6..................................................................................................................................................10
1. Calculate the coefficients of variation for business A and B........................................................10
2. By taking an assumption, that the risk of retailer is adverse, choose a project...........................10
TASK 7..................................................................................................................................................10
Give a reflective learning through the project.................................................................................10
PART 2.................................................................................................................................................11
1. Estimate the variable cost through high – low method...............................................................11
2. Calculate the monthly fixed cost.................................................................................................11
3. Calculate break even of January 2021.........................................................................................11
4. How many t-shirts should be sold to achieve the target profit in January 2021..........................11
5. Calculate margin of safety...........................................................................................................11

6. Interpret the above calculations..................................................................................................11
REFERENCES........................................................................................................................................13
REFERENCES........................................................................................................................................13
PART 1
TASK 1
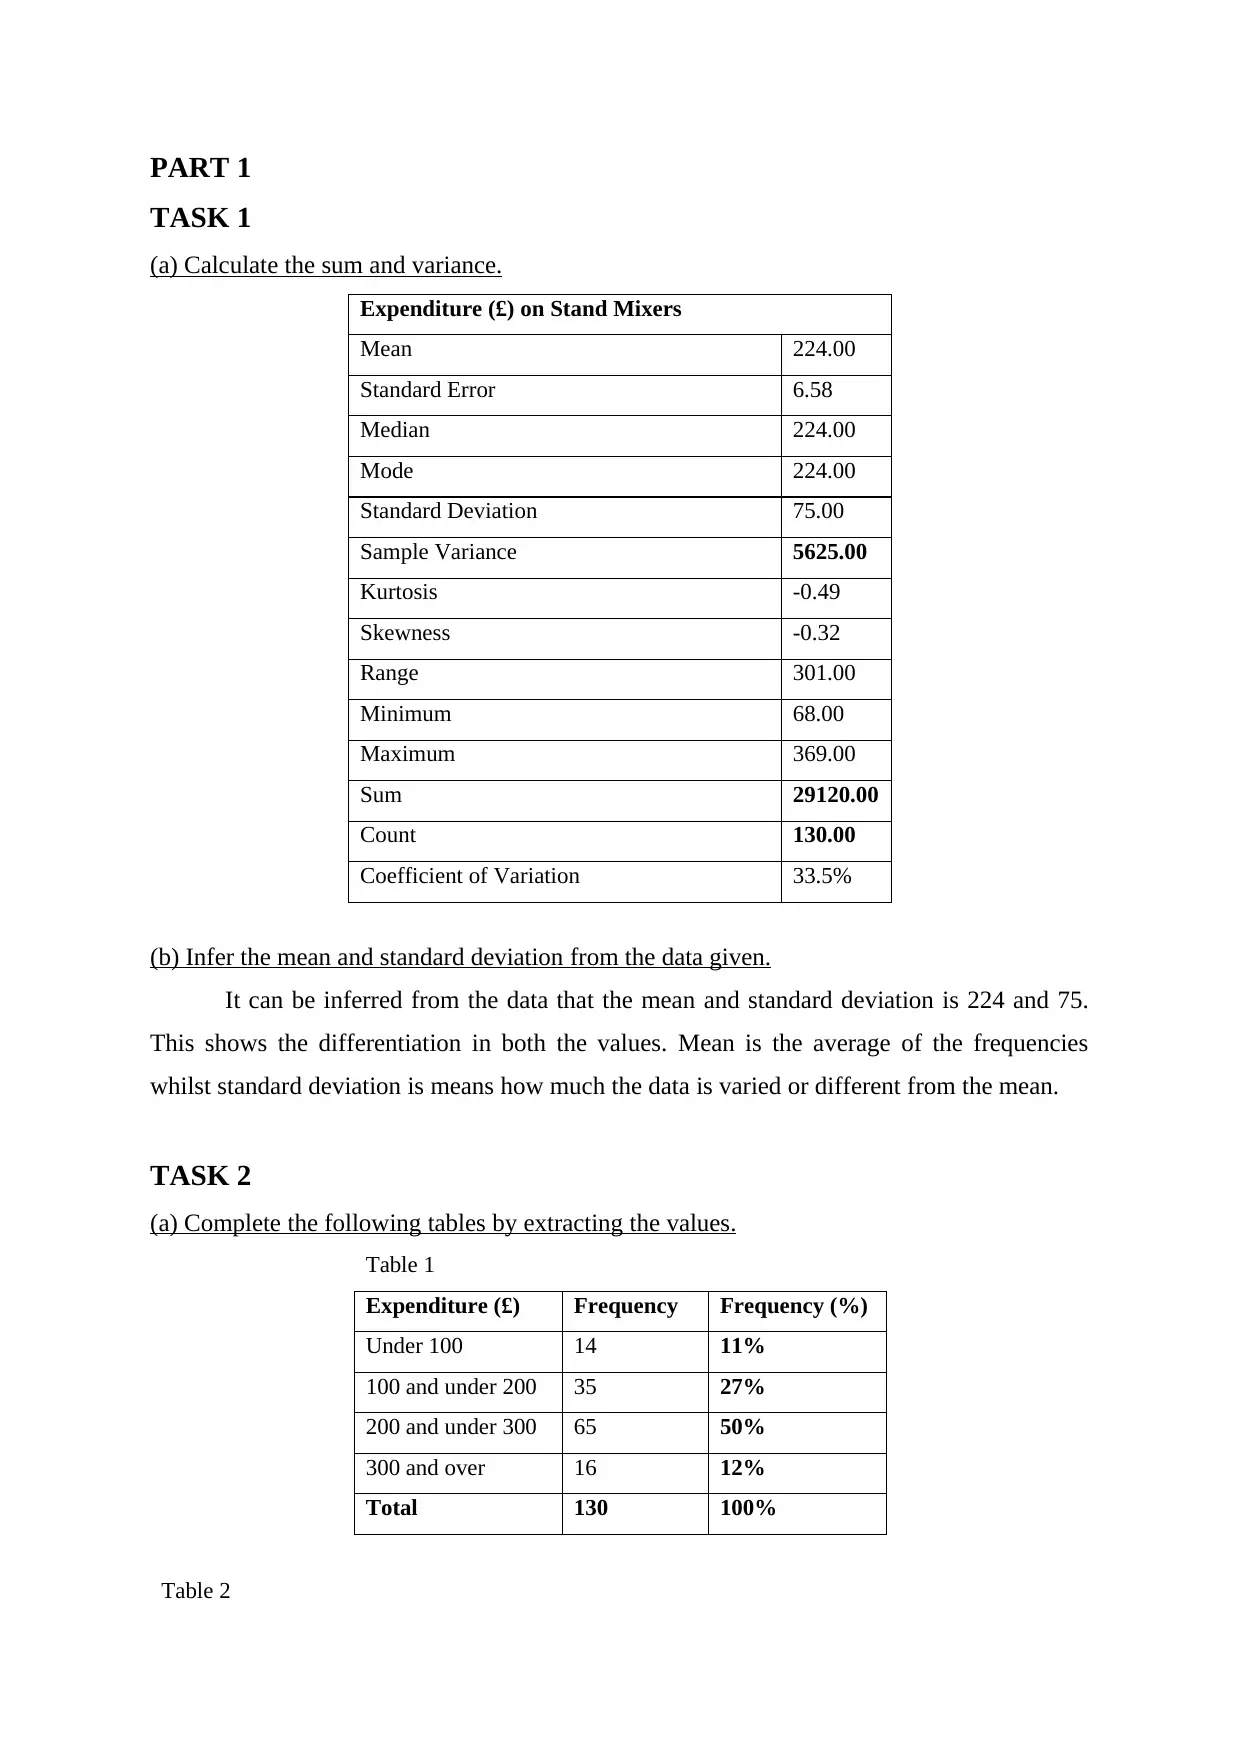
(a) Calculate the sum and variance.
Expenditure (£) on Stand Mixers
Mean 224.00
Standard Error 6.58
Median 224.00
Mode 224.00
Standard Deviation 75.00
Sample Variance 5625.00
Kurtosis -0.49
Skewness -0.32
Range 301.00
Minimum 68.00
Maximum 369.00
Sum 29120.00
Count 130.00
Coefficient of Variation 33.5%
(b) Infer the mean and standard deviation from the data given.
It can be inferred from the data that the mean and standard deviation is 224 and 75.
This shows the differentiation in both the values. Mean is the average of the frequencies
whilst standard deviation is means how much the data is varied or different from the mean.
TASK 2
(a) Complete the following tables by extracting the values.
Table 1
Expenditure (£) Frequency Frequency (%)
Under 100 14 11%
100 and under 200 35 27%
200 and under 300 65 50%
300 and over 16 12%
Total 130 100%
Table 2
TASK 1
(a) Calculate the sum and variance.
Expenditure (£) on Stand Mixers
Mean 224.00
Standard Error 6.58
Median 224.00
Mode 224.00
Standard Deviation 75.00
Sample Variance 5625.00
Kurtosis -0.49
Skewness -0.32
Range 301.00
Minimum 68.00
Maximum 369.00
Sum 29120.00
Count 130.00
Coefficient of Variation 33.5%
(b) Infer the mean and standard deviation from the data given.
It can be inferred from the data that the mean and standard deviation is 224 and 75.
This shows the differentiation in both the values. Mean is the average of the frequencies
whilst standard deviation is means how much the data is varied or different from the mean.
TASK 2
(a) Complete the following tables by extracting the values.
Table 1
Expenditure (£) Frequency Frequency (%)
Under 100 14 11%
100 and under 200 35 27%
200 and under 300 65 50%
300 and over 16 12%
Total 130 100%
Table 2
Secure Best Marks with AI Grader
Need help grading? Try our AI Grader for instant feedback on your assignments.
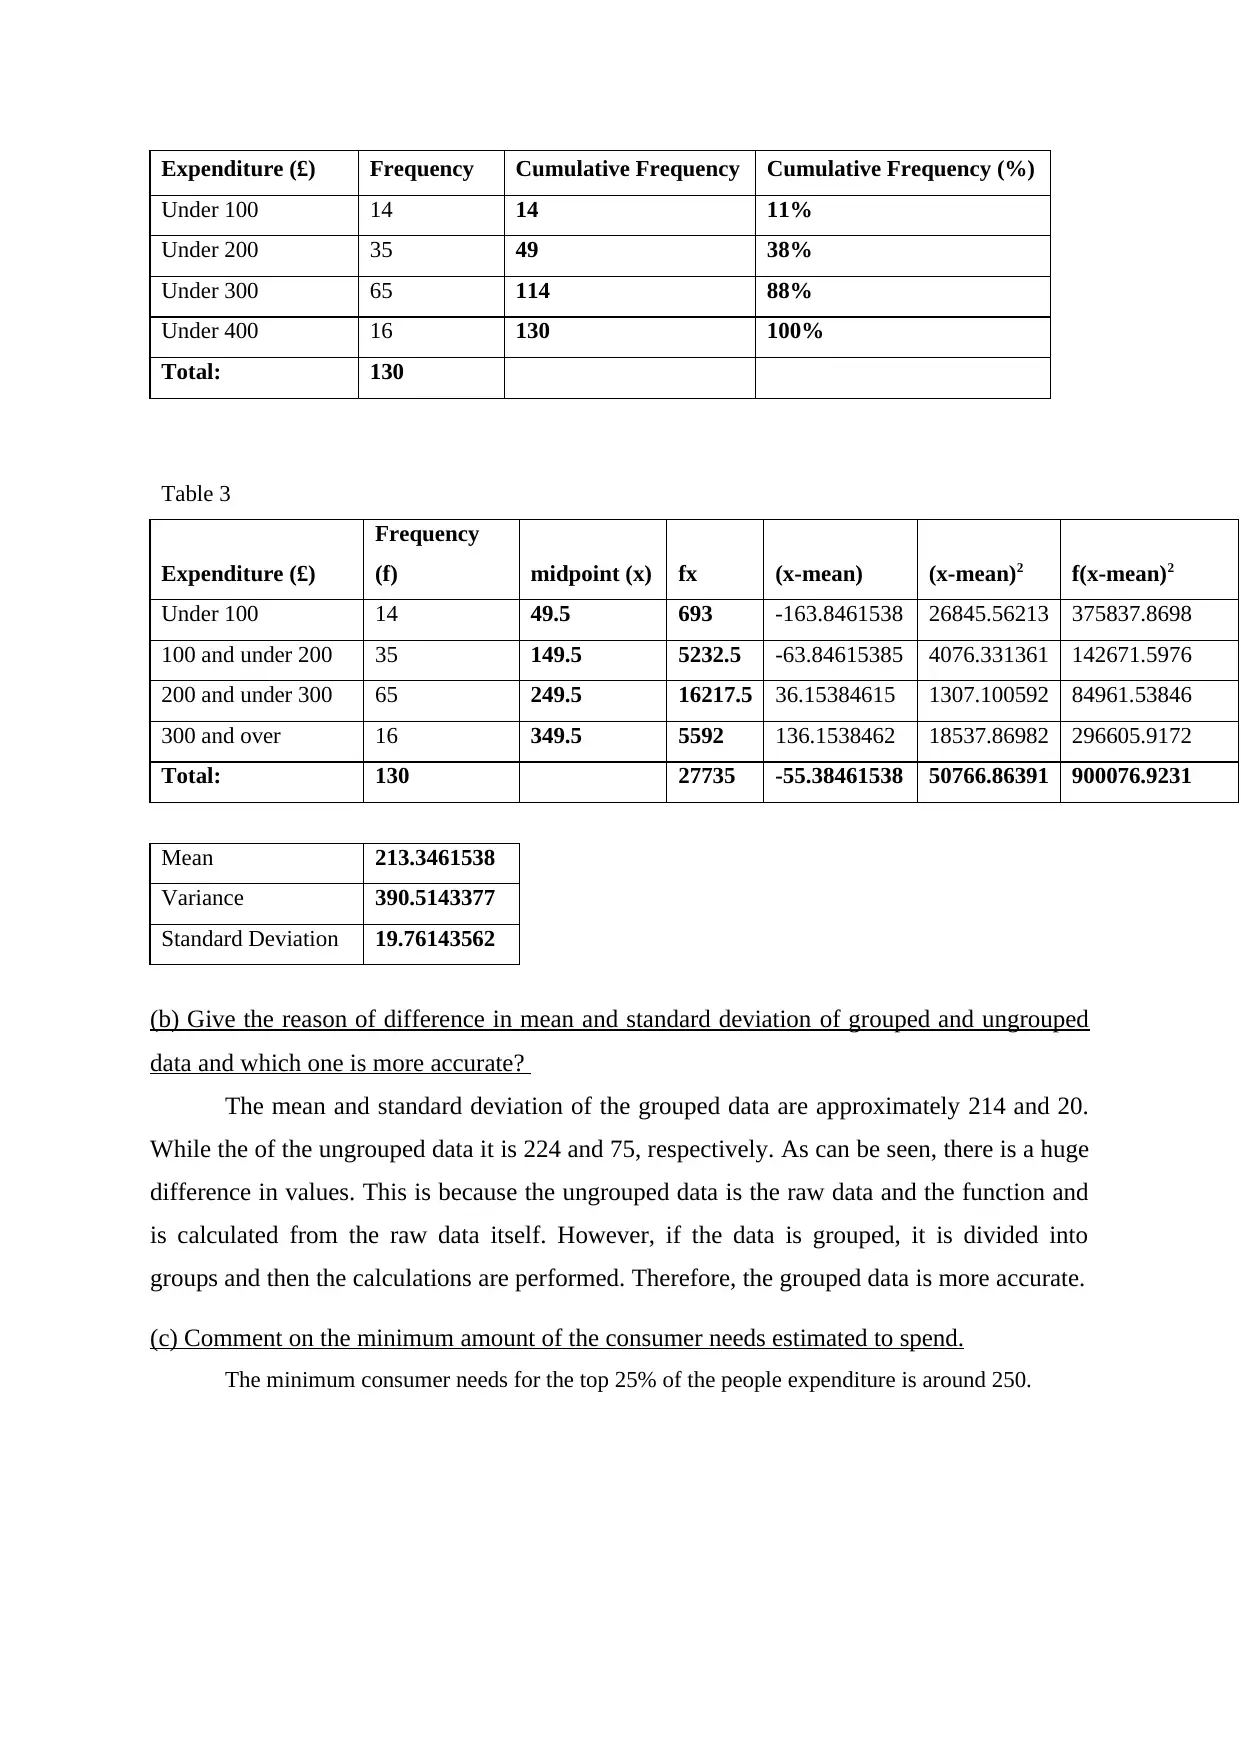
Expenditure (£) Frequency Cumulative Frequency Cumulative Frequency (%)
Under 100 14 14 11%
Under 200 35 49 38%
Under 300 65 114 88%
Under 400 16 130 100%
Total: 130
Table 3
Expenditure (£)
Frequency
(f) midpoint (x) fx (x-mean) (x-mean)2 f(x-mean)2
Under 100 14 49.5 693 -163.8461538 26845.56213 375837.8698
100 and under 200 35 149.5 5232.5 -63.84615385 4076.331361 142671.5976
200 and under 300 65 249.5 16217.5 36.15384615 1307.100592 84961.53846
300 and over 16 349.5 5592 136.1538462 18537.86982 296605.9172
Total: 130 27735 -55.38461538 50766.86391 900076.9231
Mean 213.3461538
Variance 390.5143377
Standard Deviation 19.76143562
(b) Give the reason of difference in mean and standard deviation of grouped and ungrouped
data and which one is more accurate?
The mean and standard deviation of the grouped data are approximately 214 and 20.
While the of the ungrouped data it is 224 and 75, respectively. As can be seen, there is a huge
difference in values. This is because the ungrouped data is the raw data and the function and
is calculated from the raw data itself. However, if the data is grouped, it is divided into
groups and then the calculations are performed. Therefore, the grouped data is more accurate.
(c) Comment on the minimum amount of the consumer needs estimated to spend.
The minimum consumer needs for the top 25% of the people expenditure is around 250.
TASK 3
Give the difference between the cross – sectional data and time series data with reference to
the examples considering the demographic profile and lifestyle nature of the consumers.
The following difference shows the insights gained with reference to the demographic
and lifestyle:
Cross – sectional Data Time Series Data
It collects the behavior of multiple projects
at a specific period of time.
For example, the sales which is done by the
organization of several products in a single
point of time.
It takes the behaviors of a single subject of
numerous time intervals and also focuses on
the same factor over the period of time
(Khan, Harris and Loxton, 2021).
For instance, the revenue observed is of
multiple years of a single product.
The retailer needs to consider the cross-sectional information strategy as it
accumulates the information of numerous factors like way of life inclinations and segment
profiles. Thus, this strategy will be skilful for the retailer to comprehend their target clients.
TASK 4
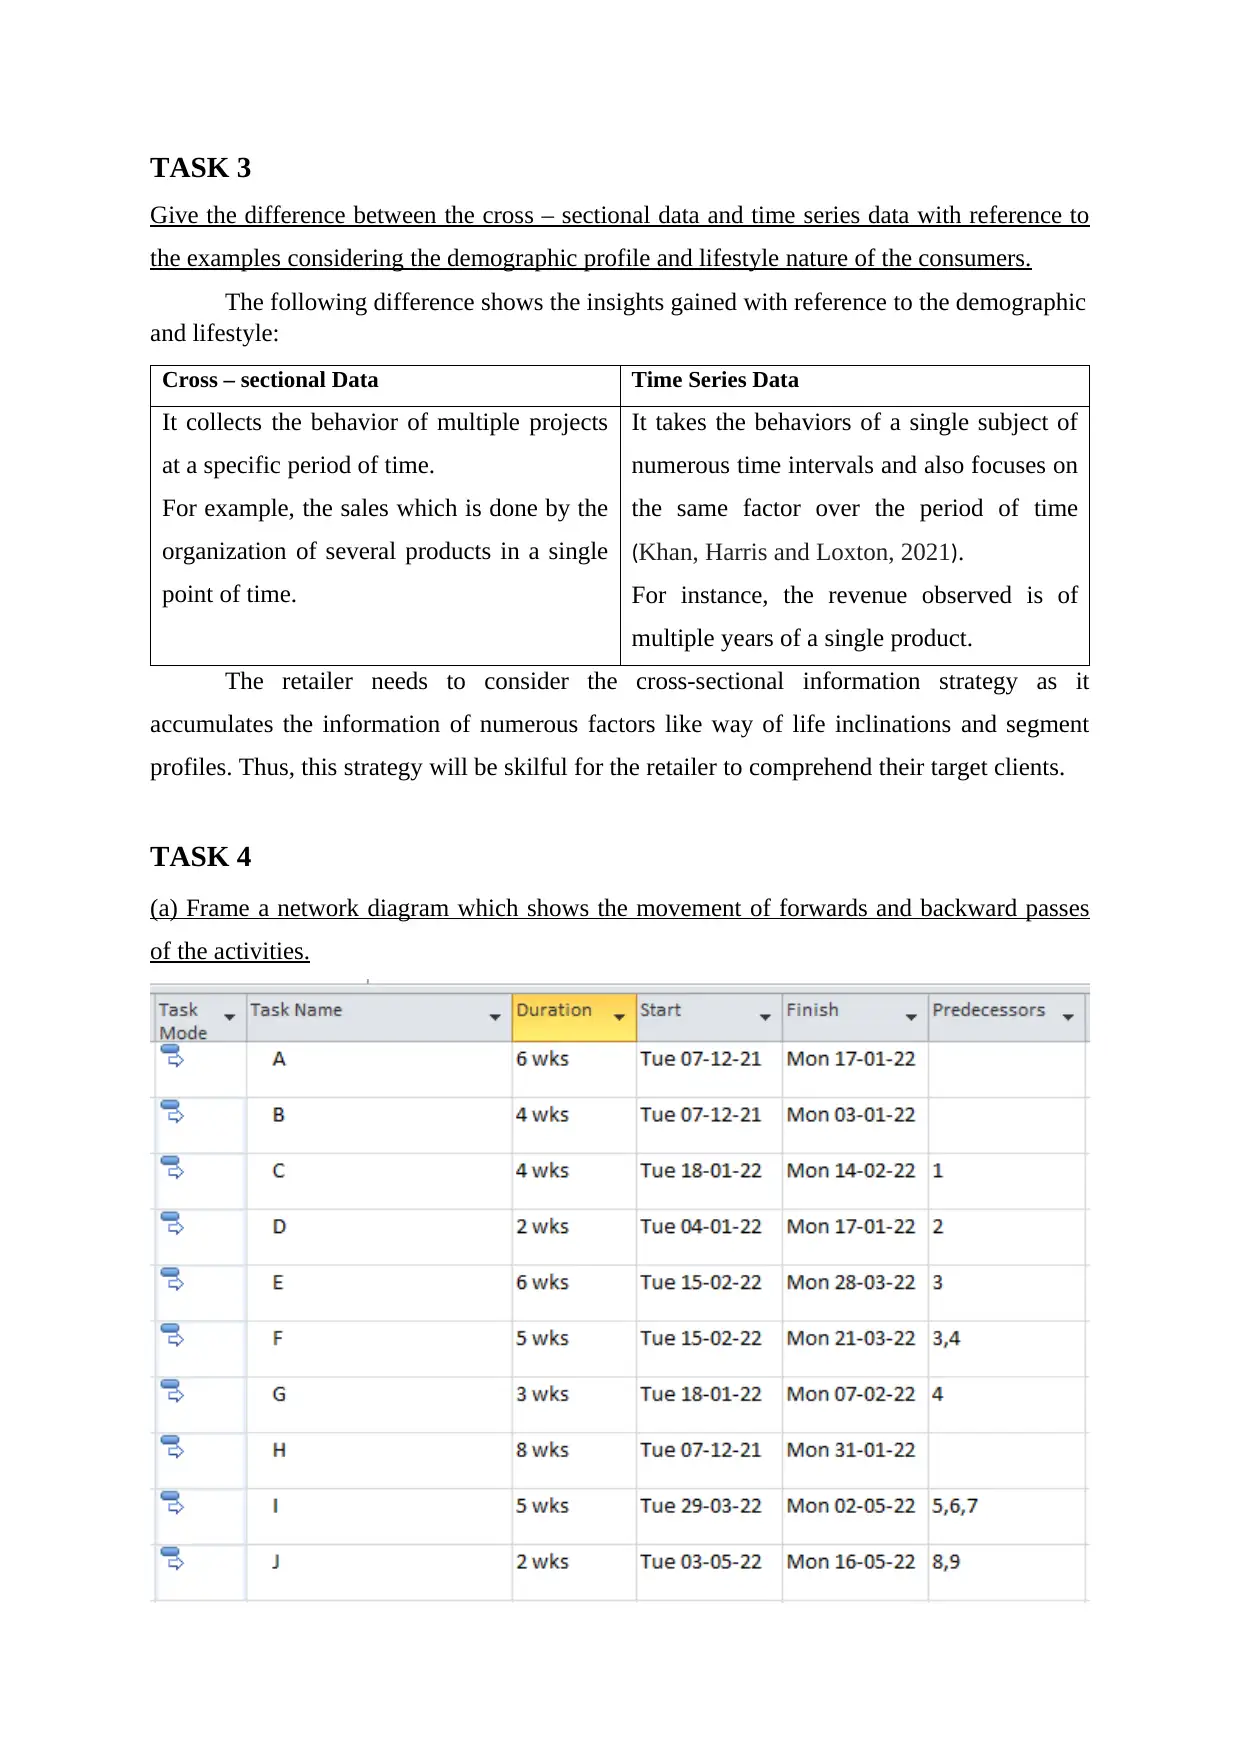
(a) Frame a network diagram which shows the movement of forwards and backward passes
of the activities.
Give the difference between the cross – sectional data and time series data with reference to
the examples considering the demographic profile and lifestyle nature of the consumers.
The following difference shows the insights gained with reference to the demographic
and lifestyle:
Cross – sectional Data Time Series Data
It collects the behavior of multiple projects
at a specific period of time.
For example, the sales which is done by the
organization of several products in a single
point of time.
It takes the behaviors of a single subject of
numerous time intervals and also focuses on
the same factor over the period of time
(Khan, Harris and Loxton, 2021).
For instance, the revenue observed is of
multiple years of a single product.
The retailer needs to consider the cross-sectional information strategy as it
accumulates the information of numerous factors like way of life inclinations and segment
profiles. Thus, this strategy will be skilful for the retailer to comprehend their target clients.
TASK 4
(a) Frame a network diagram which shows the movement of forwards and backward passes
of the activities.
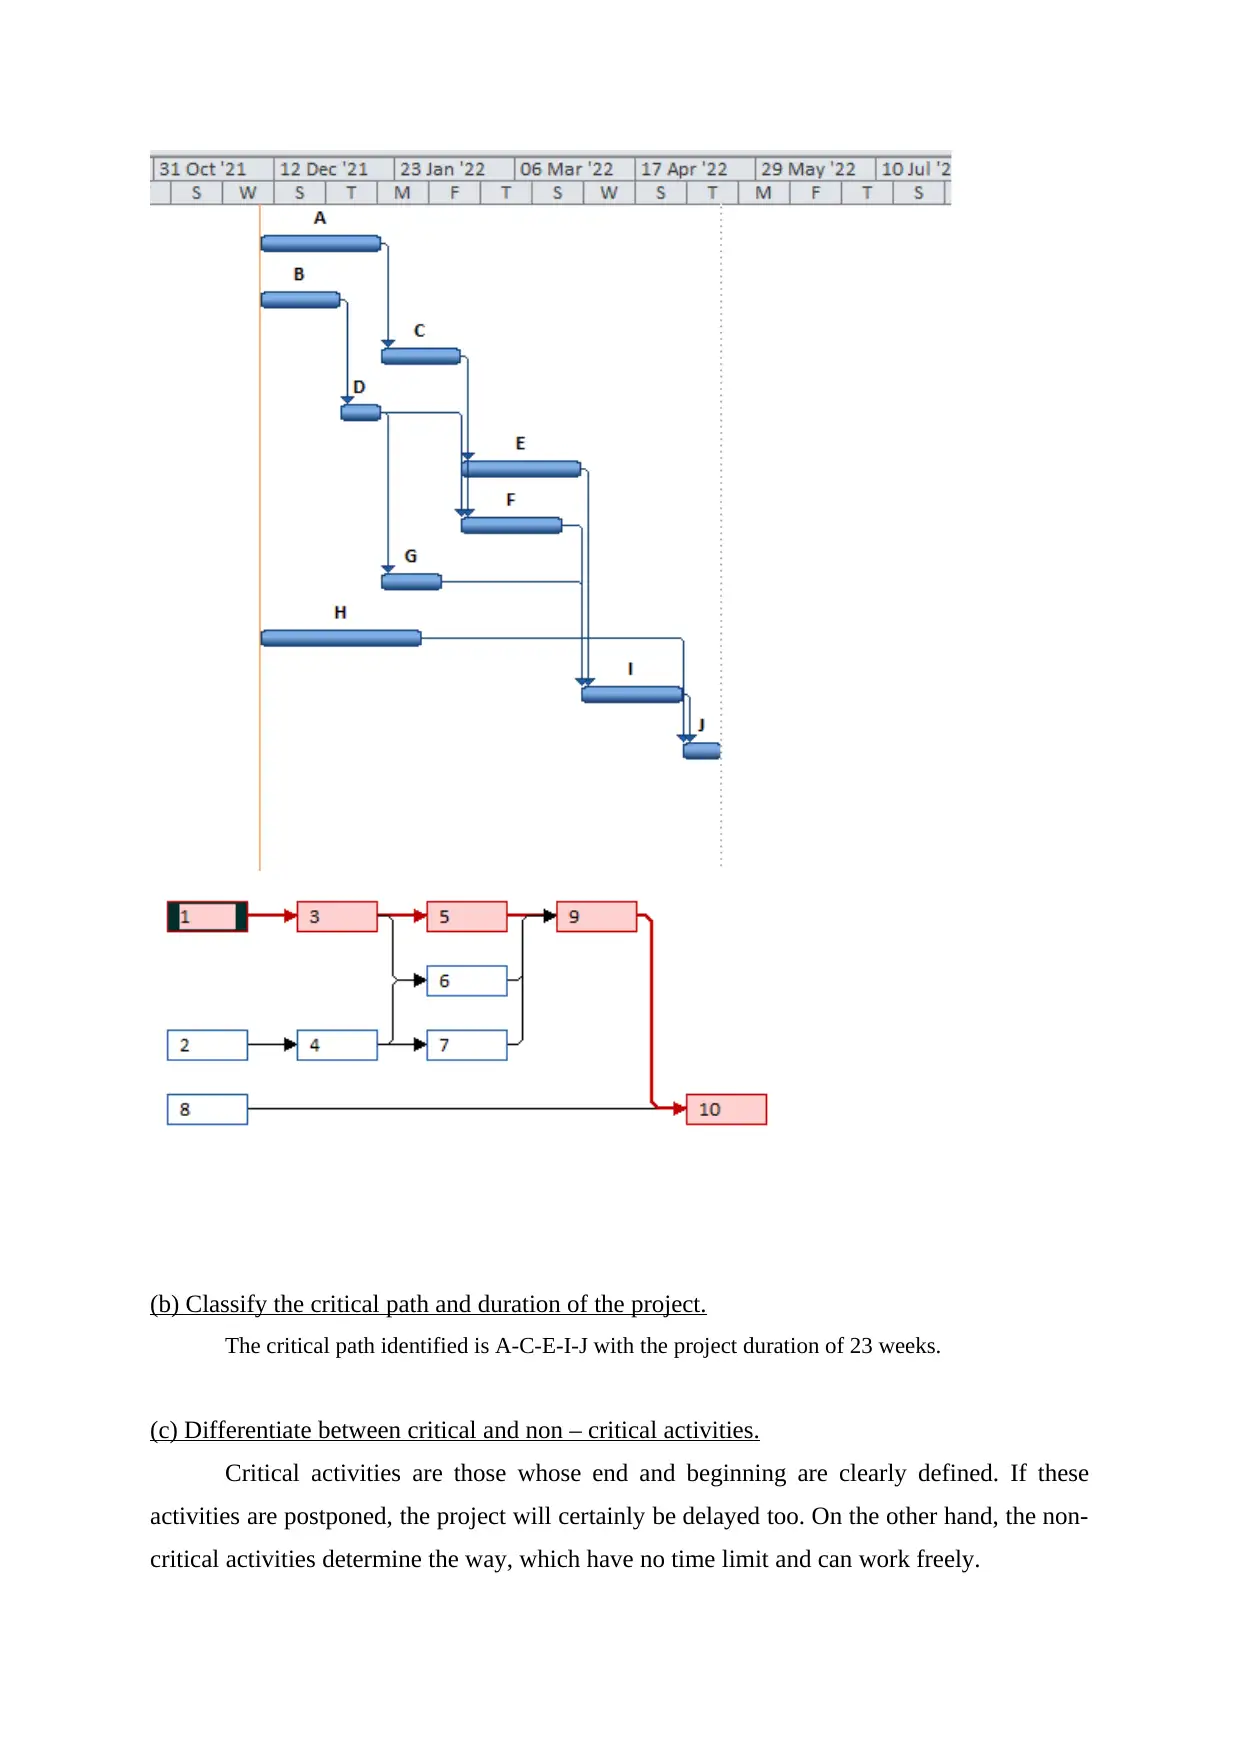
(b) Classify the critical path and duration of the project.
The critical path identified is A-C-E-I-J with the project duration of 23 weeks.
(c) Differentiate between critical and non – critical activities.
Critical activities are those whose end and beginning are clearly defined. If these
activities are postponed, the project will certainly be delayed too. On the other hand, the non-
critical activities determine the way, which have no time limit and can work freely.
Paraphrase This Document
Need a fresh take? Get an instant paraphrase of this document with our AI Paraphraser
TASK 5
(a) Develop a correlation matrix and work out the coefficients between quarterly revenues
and different variables.
Coefficient of correlation Coefficient of determination
Quarterly Sales Revenue and
total costs 0.54003673 0.29163967
Quarterly Sales Revenue and
Average order value 0.974847027 0.950326726
Quarterly Sales Revenue and
gross profit 0.423092657 0.179007396
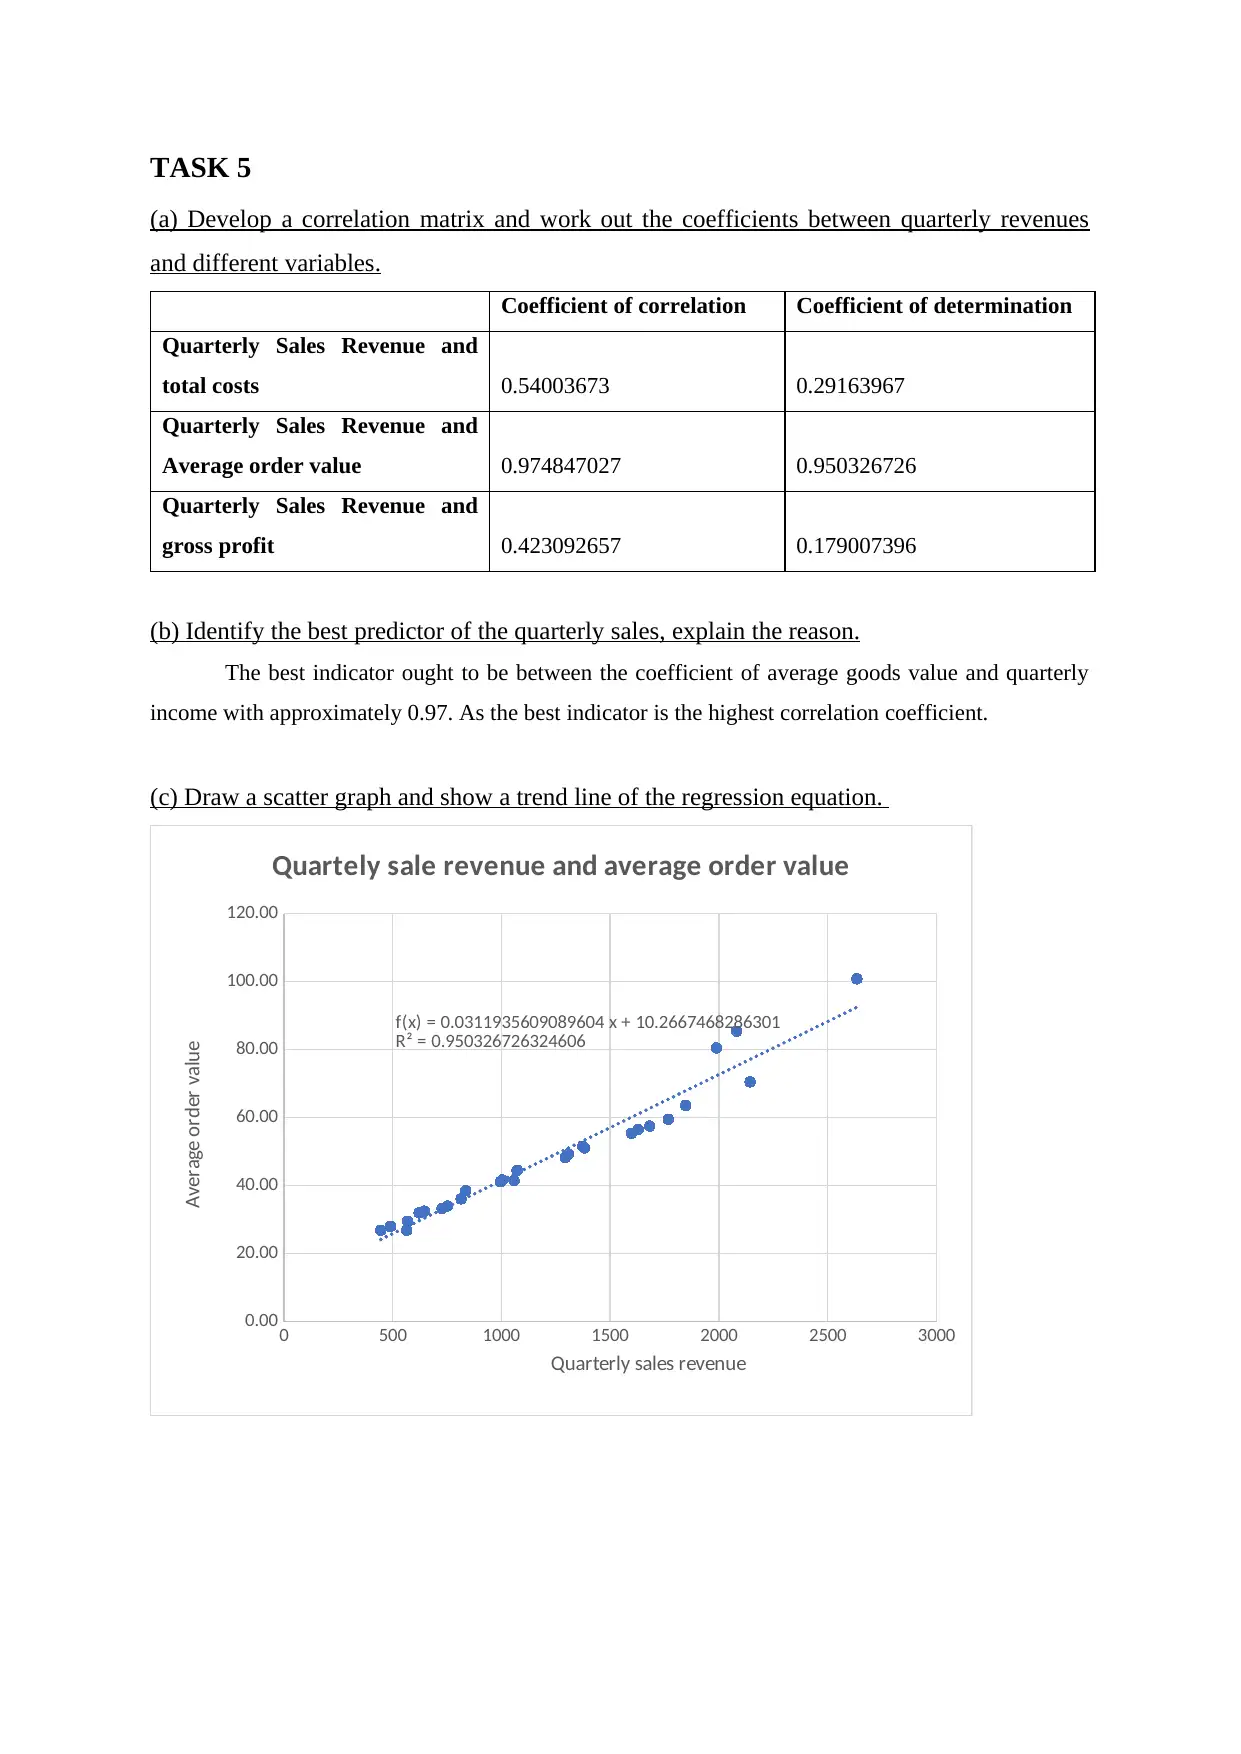
(b) Identify the best predictor of the quarterly sales, explain the reason.
The best indicator ought to be between the coefficient of average goods value and quarterly
income with approximately 0.97. As the best indicator is the highest correlation coefficient.
(c) Draw a scatter graph and show a trend line of the regression equation.
0 500 1000 1500 2000 2500 3000
0.00
20.00
40.00
60.00
80.00
100.00
120.00
f(x) = 0.0311935609089604 x + 10.2667468286301
R² = 0.950326726324606
Quartely sale revenue and average order value
Quarterly sales revenue
Average order value
(a) Develop a correlation matrix and work out the coefficients between quarterly revenues
and different variables.
Coefficient of correlation Coefficient of determination
Quarterly Sales Revenue and
total costs 0.54003673 0.29163967
Quarterly Sales Revenue and
Average order value 0.974847027 0.950326726
Quarterly Sales Revenue and
gross profit 0.423092657 0.179007396
(b) Identify the best predictor of the quarterly sales, explain the reason.
The best indicator ought to be between the coefficient of average goods value and quarterly
income with approximately 0.97. As the best indicator is the highest correlation coefficient.
(c) Draw a scatter graph and show a trend line of the regression equation.
0 500 1000 1500 2000 2500 3000
0.00
20.00
40.00
60.00
80.00
100.00
120.00
f(x) = 0.0311935609089604 x + 10.2667468286301
R² = 0.950326726324606
Quartely sale revenue and average order value
Quarterly sales revenue
Average order value
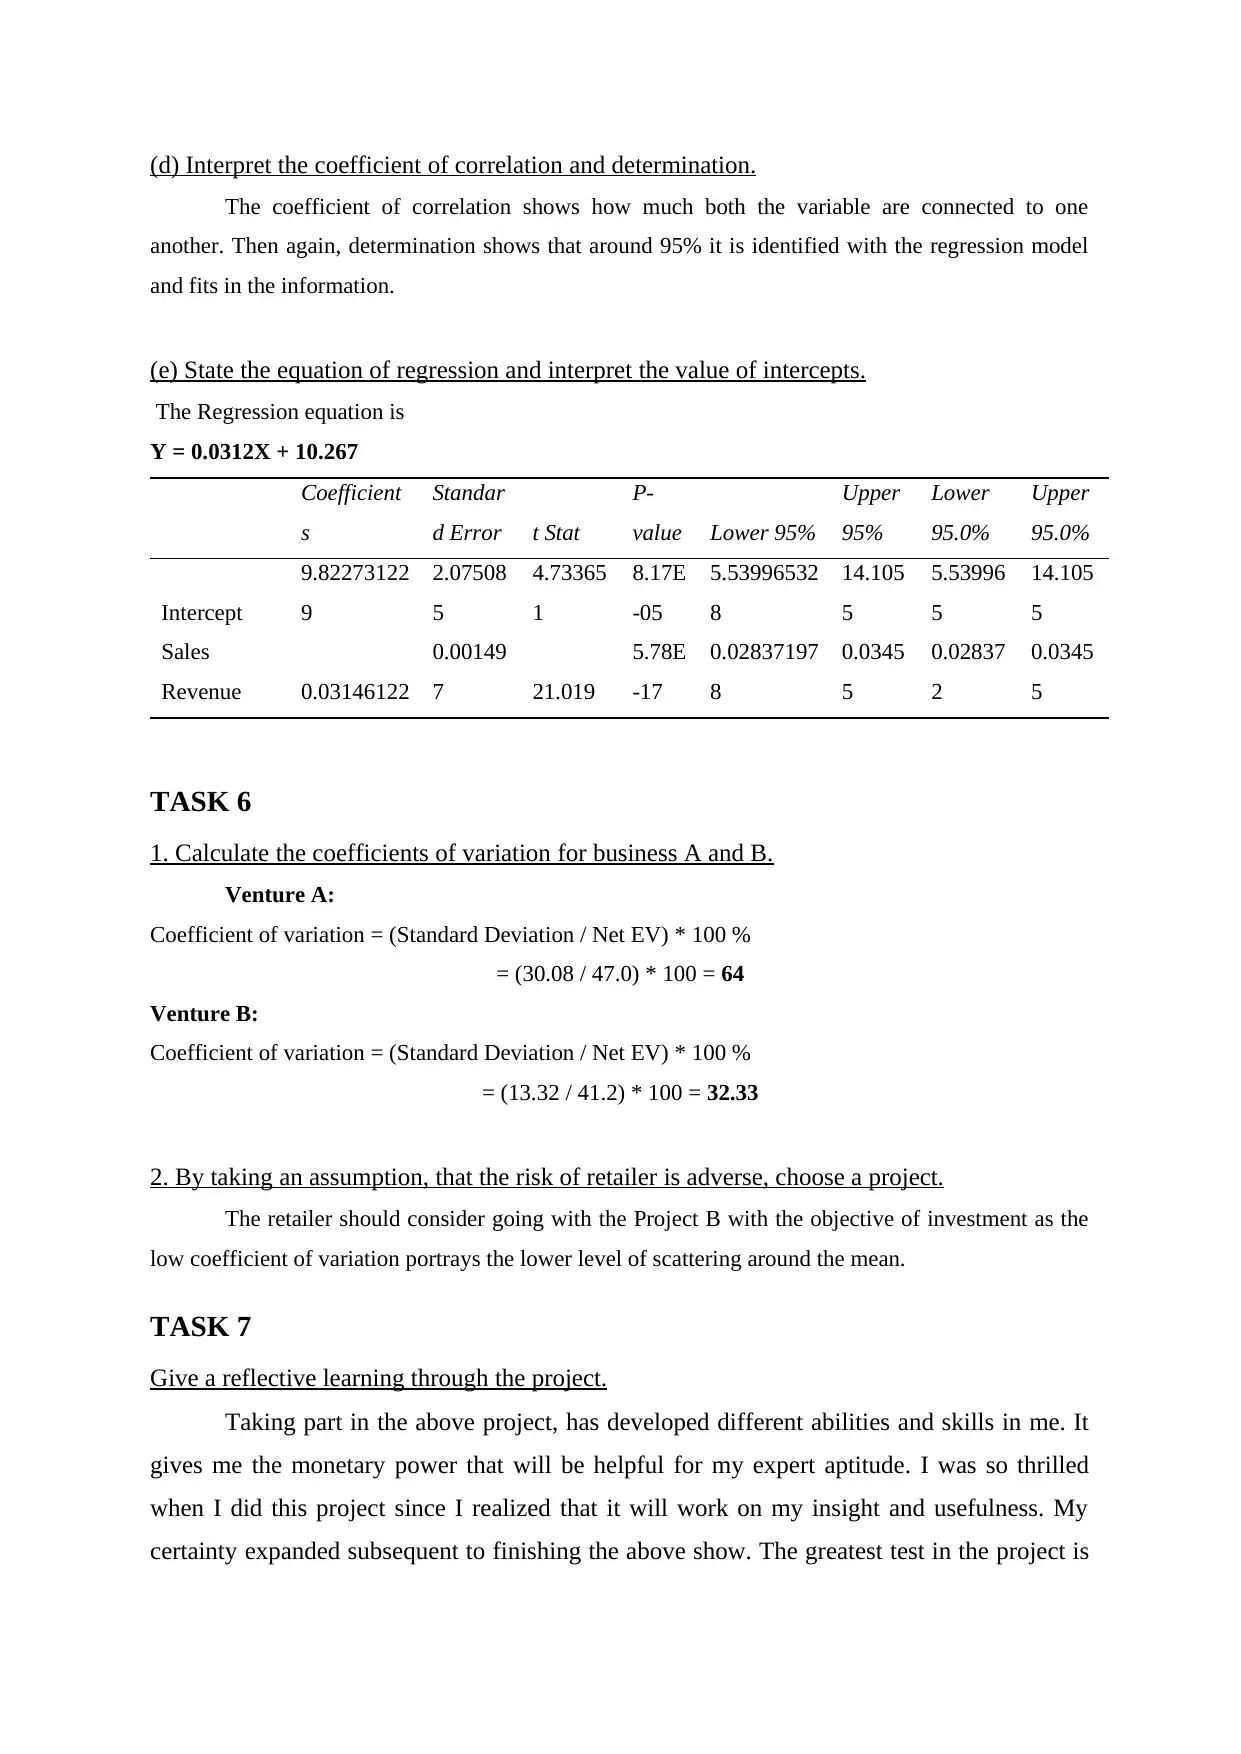
(d) Interpret the coefficient of correlation and determination.
The coefficient of correlation shows how much both the variable are connected to one
another. Then again, determination shows that around 95% it is identified with the regression model
and fits in the information.
(e) State the equation of regression and interpret the value of intercepts.
The Regression equation is
Y = 0.0312X + 10.267
Coefficient
s
Standar
d Error t Stat
P-
value Lower 95%
Upper
95%
Lower
95.0%
Upper
95.0%
Intercept
9.82273122
9
2.07508
5
4.73365
1
8.17E
-05
5.53996532
8
14.105
5
5.53996
5
14.105
5
Sales
Revenue 0.03146122
0.00149
7 21.019
5.78E
-17
0.02837197
8
0.0345
5
0.02837
2
0.0345
5
TASK 6
1. Calculate the coefficients of variation for business A and B.
Venture A:
Coefficient of variation = (Standard Deviation / Net EV) * 100 %
= (30.08 / 47.0) * 100 = 64
Venture B:
Coefficient of variation = (Standard Deviation / Net EV) * 100 %
= (13.32 / 41.2) * 100 = 32.33
2. By taking an assumption, that the risk of retailer is adverse, choose a project.
The retailer should consider going with the Project B with the objective of investment as the
low coefficient of variation portrays the lower level of scattering around the mean.
TASK 7
Give a reflective learning through the project.
Taking part in the above project, has developed different abilities and skills in me. It
gives me the monetary power that will be helpful for my expert aptitude. I was so thrilled
when I did this project since I realized that it will work on my insight and usefulness. My
certainty expanded subsequent to finishing the above show. The greatest test in the project is
missing numbers. Due to such issues, I experienced difficulty matching the figures. In the
future, I'll concentrate more and learn the methods of calculations that will make the figures
easier for me to interpret and analyse for my future projects.
PART 2
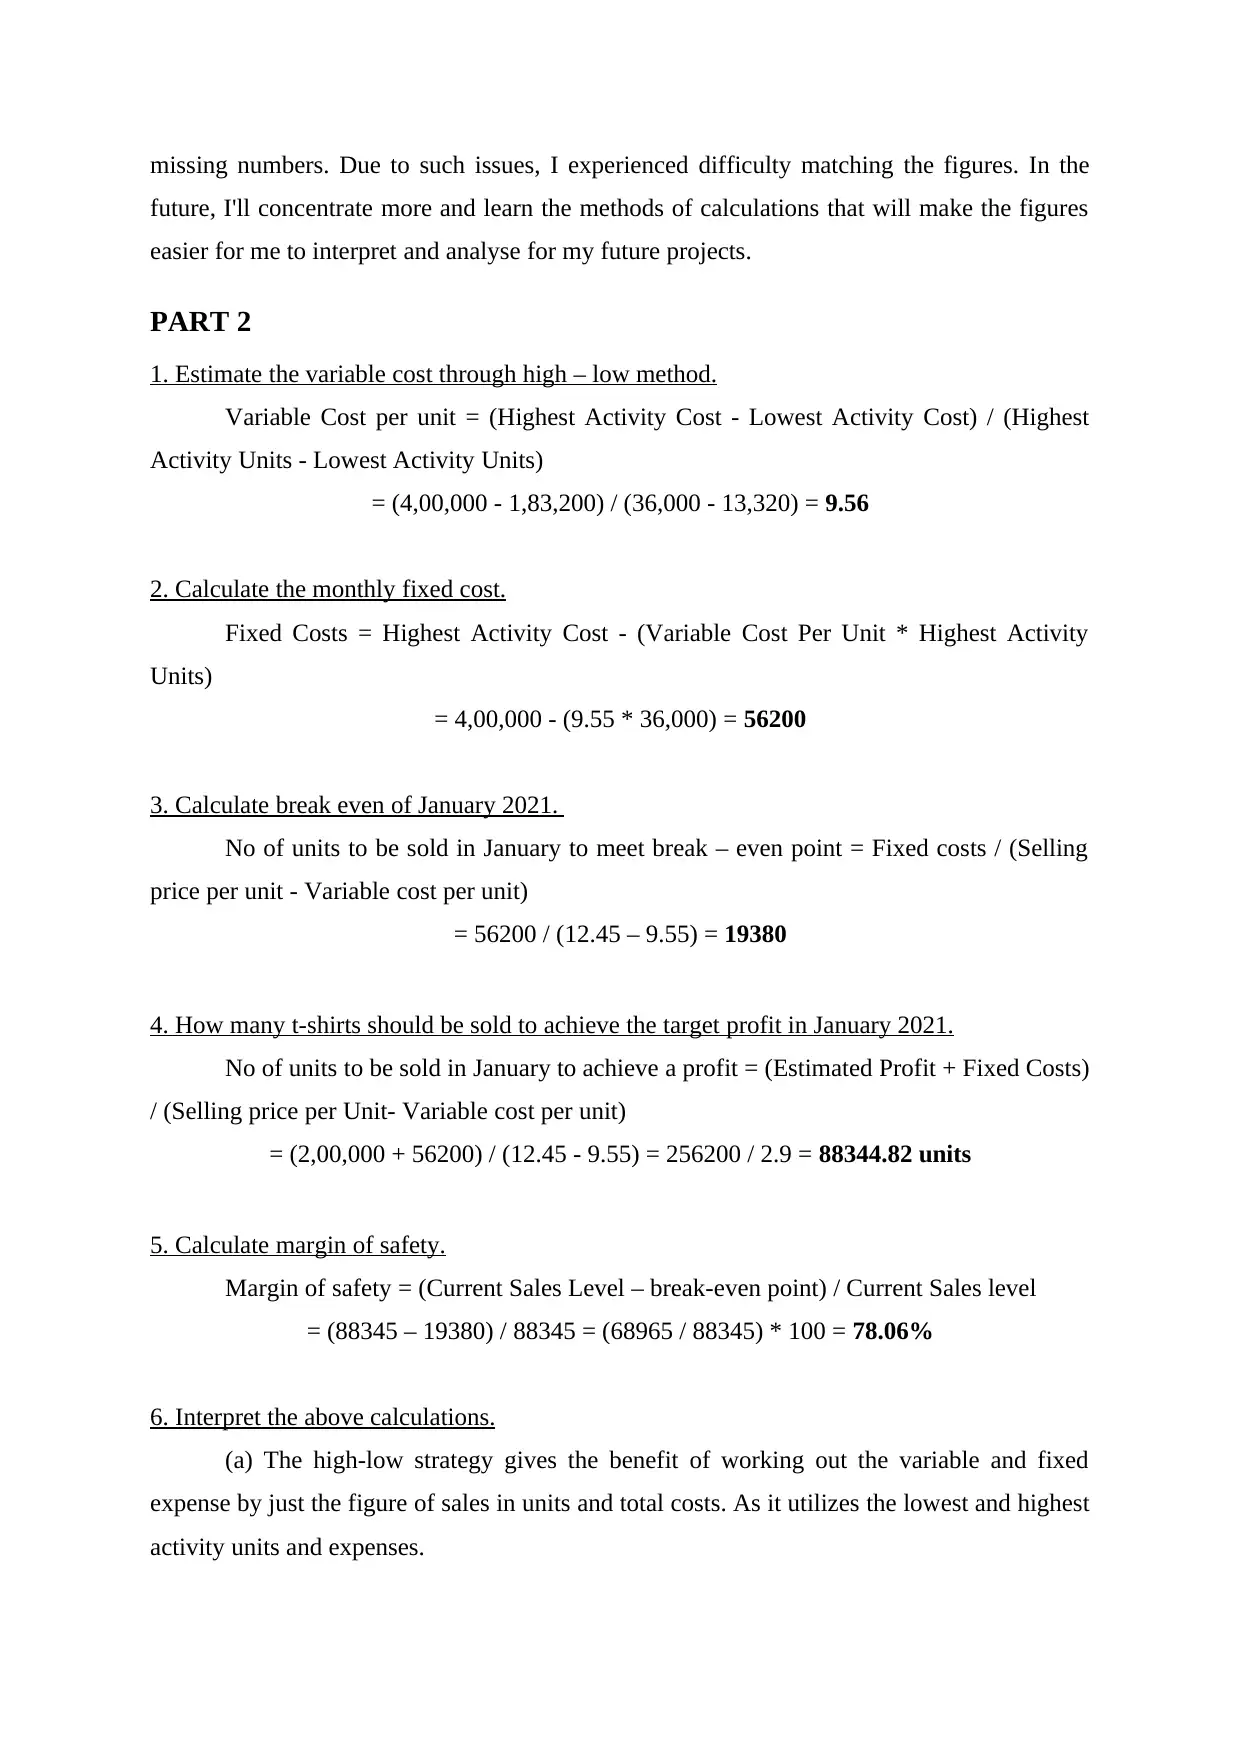
1. Estimate the variable cost through high – low method.
Variable Cost per unit = (Highest Activity Cost - Lowest Activity Cost) / (Highest
Activity Units - Lowest Activity Units)
= (4,00,000 - 1,83,200) / (36,000 - 13,320) = 9.56
2. Calculate the monthly fixed cost.
Fixed Costs = Highest Activity Cost - (Variable Cost Per Unit * Highest Activity
Units)
= 4,00,000 - (9.55 * 36,000) = 56200
3. Calculate break even of January 2021.
No of units to be sold in January to meet break – even point = Fixed costs / (Selling
price per unit - Variable cost per unit)
= 56200 / (12.45 – 9.55) = 19380
4. How many t-shirts should be sold to achieve the target profit in January 2021.
No of units to be sold in January to achieve a profit = (Estimated Profit + Fixed Costs)
/ (Selling price per Unit- Variable cost per unit)
= (2,00,000 + 56200) / (12.45 - 9.55) = 256200 / 2.9 = 88344.82 units
5. Calculate margin of safety.
Margin of safety = (Current Sales Level – break-even point) / Current Sales level
= (88345 – 19380) / 88345 = (68965 / 88345) * 100 = 78.06%
6. Interpret the above calculations.
(a) The high-low strategy gives the benefit of working out the variable and fixed
expense by just the figure of sales in units and total costs. As it utilizes the lowest and highest
activity units and expenses.
future, I'll concentrate more and learn the methods of calculations that will make the figures
easier for me to interpret and analyse for my future projects.
PART 2
1. Estimate the variable cost through high – low method.
Variable Cost per unit = (Highest Activity Cost - Lowest Activity Cost) / (Highest
Activity Units - Lowest Activity Units)
= (4,00,000 - 1,83,200) / (36,000 - 13,320) = 9.56
2. Calculate the monthly fixed cost.
Fixed Costs = Highest Activity Cost - (Variable Cost Per Unit * Highest Activity
Units)
= 4,00,000 - (9.55 * 36,000) = 56200
3. Calculate break even of January 2021.
No of units to be sold in January to meet break – even point = Fixed costs / (Selling
price per unit - Variable cost per unit)
= 56200 / (12.45 – 9.55) = 19380
4. How many t-shirts should be sold to achieve the target profit in January 2021.
No of units to be sold in January to achieve a profit = (Estimated Profit + Fixed Costs)
/ (Selling price per Unit- Variable cost per unit)
= (2,00,000 + 56200) / (12.45 - 9.55) = 256200 / 2.9 = 88344.82 units
5. Calculate margin of safety.
Margin of safety = (Current Sales Level – break-even point) / Current Sales level
= (88345 – 19380) / 88345 = (68965 / 88345) * 100 = 78.06%
6. Interpret the above calculations.
(a) The high-low strategy gives the benefit of working out the variable and fixed
expense by just the figure of sales in units and total costs. As it utilizes the lowest and highest
activity units and expenses.
Secure Best Marks with AI Grader
Need help grading? Try our AI Grader for instant feedback on your assignments.
(b) The fixed expense is determined in terms of the cost of overall units while the variable
expense is determined in per unit. The variable cost is 9.56 per unit while fixed expense is
56200 for all the unit that is sold and manufactured.
(c) The quantity of units that should be created accomplish a breakeven on around 19380
units. It is roughly the average number of units that the firm is selling in the months from July
to December.
(d) To accomplish an objective benefit of £200000, the association should sell least of 88345
units. It is large number thinking about the monthly sales of the firm. It implies that it needs
to expand its production process by setting up more machine and labour.
(e) The margin of safety is 78.06% on the revenue units with the target benefit which must be
accomplished.
(f) Disadvantages of Breakeven analysis:
The calculation accuracy depends on the authenticity of data.
The connection between the variable expenses and sales is not determined.
REFERENCES
Books and Journals
Khan, M.N., Harris, M.L. and Loxton, D., 2021. Does unintended pregnancy have an impact
on skilled delivery care use in Bangladesh? A nationally representative cross-
sectional study using Demography and Health Survey data. Journal of Biosocial
Science. 53(5). pp.773-789.
Noh, J.W and et. al., 2018. Gender differences and socioeconomic factors related to
osteoporosis: a cross-sectional analysis of nationally representative data. Journal of
Women's Health. 27(2). pp.196-202.
Qiao, H and et. al., 2019. Has China's coal consumption actually reached its peak? National
and regional analysis considering cross-sectional dependence and heterogeneity.
Energy Economics. 84. p.104509.
Ruf, S. and Bock, N.C., 2019. Long-term (≥ 15 years) effects of Class II treatment: a
longitudinal and cross-sectional study on signs and symptoms of
temporomandibular disorders. European journal of orthodontics. 41(2). pp.172-179.
Yu, T and et. al., 2021. Neighbourhood built environment and leisure-time physical activity:
A cross-sectional study in southern China. European journal of sport science. 21(2).
pp.285-292.
1 out of 12
Related Documents


Your All-in-One AI-Powered Toolkit for Academic Success.
+13062052269
info@desklib.com
Available 24*7 on WhatsApp / Email
![[object Object]](/_next/static/media/star-bottom.7253800d.svg)
Unlock your academic potential
© 2024 | Zucol Services PVT LTD | All rights reserved.