Data Analysis with R: Regression, Statistical Significance, and Models
VerifiedAdded on 2022/09/13
|14
|3949
|14
Homework Assignment
AI Summary
This R assignment delves into data analysis techniques, encompassing regression models, statistical significance, and multicollinearity analysis. The solution begins with an examination of the Phillips curve using a provided dataset, calculating the change in inflation rate and reproducing a figure with linear and reciprocal models. The assignment then progresses to model building and interpretation, exploring various regression models and assessing their statistical significance. Further, the analysis investigates the relationship between advertising expenditure and consumer expenditure, and explores the impact of multiple independent variables on a dependent variable through OLS regression. Finally, the assignment addresses multicollinearity in independent variables. The provided solution includes code, output, and interpretations, offering a comprehensive guide to the concepts and their application.

Data Analysis in R
Name
Course Name
4 - APR - 2020
Faculty Name
Name
Course Name
4 - APR - 2020
Faculty Name
Paraphrase This Document
Need a fresh take? Get an instant paraphrase of this document with our AI Paraphraser
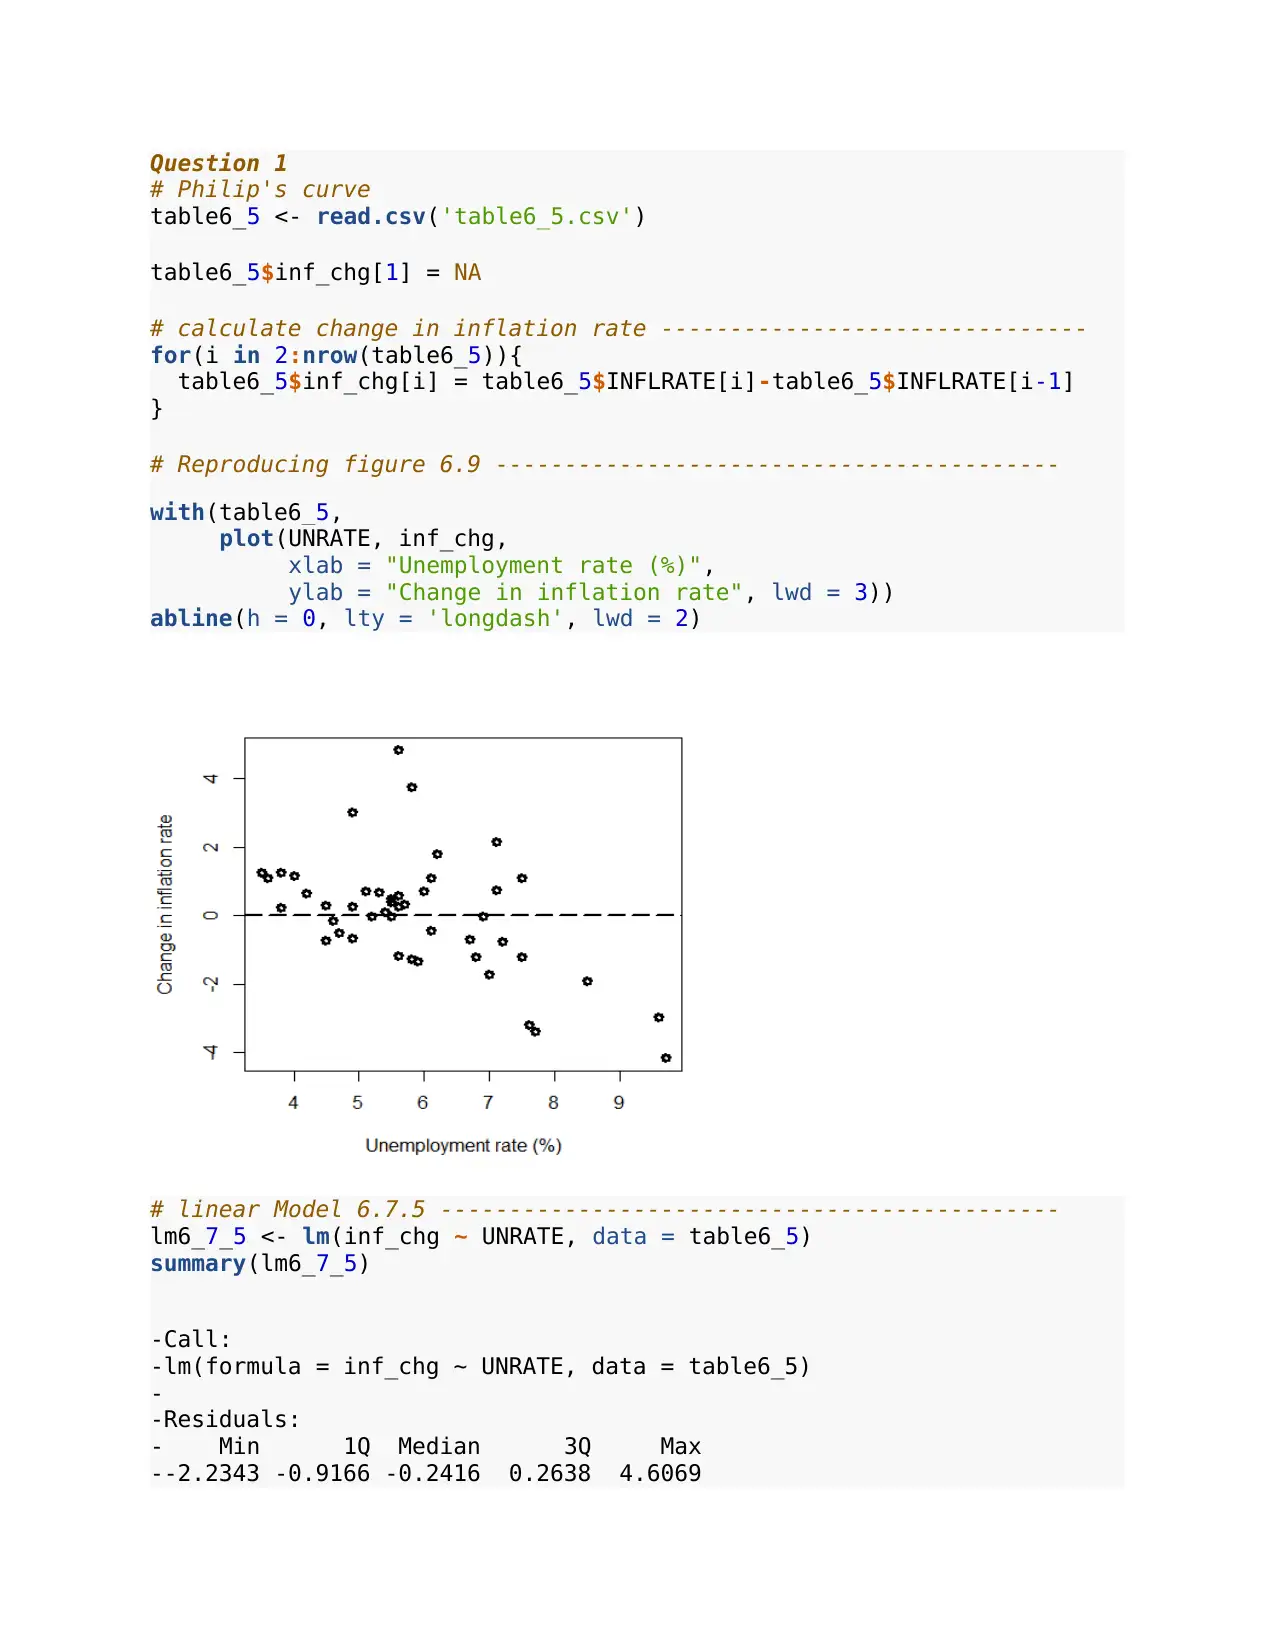
Question 1
# Philip's curve
table6_5 <- read.csv('table6_5.csv')
table6_5$inf_chg[1] = NA
# calculate change in inflation rate -------------------------------
for(i in 2:nrow(table6_5)){
table6_5$inf_chg[i] = table6_5$INFLRATE[i]-table6_5$INFLRATE[i-1]
}
# Reproducing figure 6.9 -----------------------------------------
with(table6_5,
plot(UNRATE, inf_chg,
xlab = "Unemployment rate (%)",
ylab = "Change in inflation rate", lwd = 3))
abline(h = 0, lty = 'longdash', lwd = 2)
# linear Model 6.7.5 ---------------------------------------------
lm6_7_5 <- lm(inf_chg ~ UNRATE, data = table6_5)
summary(lm6_7_5)
-Call:
-lm(formula = inf_chg ~ UNRATE, data = table6_5)
-
-Residuals:
- Min 1Q Median 3Q Max
--2.2343 -0.9166 -0.2416 0.2638 4.6069
-Coefficients:
- Estimate Std. Error t value Pr(>|t|)
-(Intercept) 3.7844 0.9030 4.191 0.000132 ***
-UNRATE -0.6385 0.1493 -4.276 0.000101 ***
----
-Signif. codes: 0 '***' 0.001 '**' 0.01 '*' 0.05 '.' 0.1 ' ' 1
-
-Residual standard error: 1.445 on 44 degrees of freedom
- (1 observation deleted due to missingness)
-Multiple R-squared: 0.2935, Adjusted R-squared: 0.2775
-F-statistic: 18.28 on 1 and 44 DF, p-value: 0.0001009
#Reciprocal model 6.7,6 ---------------------------------------
table6_5$rec_unrate <- with(table6_5, 1/UNRATE)
rec6_7_6 <- lm(inf_chg ~ rec_unrate, data = table6_5)
summary(rec6_7_6)
-
-Call:
-lm(formula = inf_chg ~ rec_unrate, data = table6_5)
-
-Residuals:
- Min 1Q Median 3Q Max
--2.8606 -1.0349 -0.1948 0.4836 4.8115
-
-Coefficients:
- Estimate Std. Error t value Pr(>|t|)
-(Intercept) -3.0683 0.9699 -3.163 0.00283 **
-rec_unrate 17.2075 5.2326 3.289 0.00199 **
----
-Signif. codes: 0 '***' 0.001 '**' 0.01 '*' 0.05 '.' 0.1 ' ' 1
-
-Residual standard error: 1.54 on 44 degrees of freedom
- (1 observation deleted due to missingness)
-Multiple R-squared: 0.1973, Adjusted R-squared: 0.1791
-F-statistic: 10.81 on 1 and 44 DF, p-value: 0.001986
# Natural Unemployment rate 6.7.7 ----------------------------
U_N <- c(lm6_7_5$coefficients[1]/(-lm6_7_5$coefficients[2]))
names(U_N) <- 'natural unemployment rate'
Question 3
table6_10 <- read.csv('table6_10.csv')
#model 1 --------------------------------------
mod_1 <- lm(Exp ~ Adexp, data = table6_10)
summary(mod_1)
-Call:
-lm(formula = Exp ~ Adexp, data = table6_10)
- Estimate Std. Error t value Pr(>|t|)
-(Intercept) 3.7844 0.9030 4.191 0.000132 ***
-UNRATE -0.6385 0.1493 -4.276 0.000101 ***
----
-Signif. codes: 0 '***' 0.001 '**' 0.01 '*' 0.05 '.' 0.1 ' ' 1
-
-Residual standard error: 1.445 on 44 degrees of freedom
- (1 observation deleted due to missingness)
-Multiple R-squared: 0.2935, Adjusted R-squared: 0.2775
-F-statistic: 18.28 on 1 and 44 DF, p-value: 0.0001009
#Reciprocal model 6.7,6 ---------------------------------------
table6_5$rec_unrate <- with(table6_5, 1/UNRATE)
rec6_7_6 <- lm(inf_chg ~ rec_unrate, data = table6_5)
summary(rec6_7_6)
-
-Call:
-lm(formula = inf_chg ~ rec_unrate, data = table6_5)
-
-Residuals:
- Min 1Q Median 3Q Max
--2.8606 -1.0349 -0.1948 0.4836 4.8115
-
-Coefficients:
- Estimate Std. Error t value Pr(>|t|)
-(Intercept) -3.0683 0.9699 -3.163 0.00283 **
-rec_unrate 17.2075 5.2326 3.289 0.00199 **
----
-Signif. codes: 0 '***' 0.001 '**' 0.01 '*' 0.05 '.' 0.1 ' ' 1
-
-Residual standard error: 1.54 on 44 degrees of freedom
- (1 observation deleted due to missingness)
-Multiple R-squared: 0.1973, Adjusted R-squared: 0.1791
-F-statistic: 10.81 on 1 and 44 DF, p-value: 0.001986
# Natural Unemployment rate 6.7.7 ----------------------------
U_N <- c(lm6_7_5$coefficients[1]/(-lm6_7_5$coefficients[2]))
names(U_N) <- 'natural unemployment rate'
Question 3
table6_10 <- read.csv('table6_10.csv')
#model 1 --------------------------------------
mod_1 <- lm(Exp ~ Adexp, data = table6_10)
summary(mod_1)
-Call:
-lm(formula = Exp ~ Adexp, data = table6_10)
⊘ This is a preview!⊘
Do you want full access?
Subscribe today to unlock all pages.
Trusted by 1+ million students worldwide
-
-Residuals:
- Min 1Q Median 3Q Max
--4444.5 -1390.8 -968.9 -199.1 8618.6
-
-Coefficients:
- Estimate Std. Error t value Pr(>|t|)
-(Intercept) 1.057e+03 5.959e+02 1.774 0.0873 .
-Adexp 4.460e-02 7.099e-03 6.283 1.01e-06 ***
-Signif. codes: 0 '***' 0.001 '**' 0.01 '*' 0.05 '.' 0.1 ' ' 1
-
-Residual standard error: 2915 on 27 degrees of freedom
-Multiple R-squared: 0.5938, Adjusted R-squared: 0.5788
-F-statistic: 39.47 on 1 and 27 DF, p-value: 1.008e-06
#model 2 ---------------------------------------
mod_2 <- lm(LNExp ~ LNAdexp, data = table6_10)
summary(mod_2)
-
-Call:
-lm(formula = LNExp ~ LNAdexp, data = table6_10)
-
-Residuals:
- Min 1Q Median 3Q Max
--2.2162 -0.9762 -0.3155 1.2048 2.5228
-
-Coefficients:
- Estimate Std. Error t value Pr(>|t|)
-(Intercept) 0.9864 1.5702 0.628 0.53517
-LNAdexp 0.6038 0.1658 3.642 0.00113 **
-Signif. codes: 0 '***' 0.001 '**' 0.01 '*' 0.05 '.' 0.1 ' ' 1
-
-Residual standard error: 1.358 on 27 degrees of freedom
-Multiple R-squared: 0.3294, Adjusted R-squared: 0.3046
-F-statistic: 13.26 on 1 and 27 DF, p-value: 0.001132
#model 3 ------------------------------------------------
mod_3 <- lm(Exp_inverse ~ Adexp_inverse, data = table6_10)
summary(mod_3)
-
-Call:
-lm(formula = Exp_inverse ~ Adexp_inverse, data = table6_10)
-
-Residuals:
- Min 1Q Median 3Q Max
--0.003370 -0.002774 -0.001858 0.001104 0.008824
-
-Residuals:
- Min 1Q Median 3Q Max
--4444.5 -1390.8 -968.9 -199.1 8618.6
-
-Coefficients:
- Estimate Std. Error t value Pr(>|t|)
-(Intercept) 1.057e+03 5.959e+02 1.774 0.0873 .
-Adexp 4.460e-02 7.099e-03 6.283 1.01e-06 ***
-Signif. codes: 0 '***' 0.001 '**' 0.01 '*' 0.05 '.' 0.1 ' ' 1
-
-Residual standard error: 2915 on 27 degrees of freedom
-Multiple R-squared: 0.5938, Adjusted R-squared: 0.5788
-F-statistic: 39.47 on 1 and 27 DF, p-value: 1.008e-06
#model 2 ---------------------------------------
mod_2 <- lm(LNExp ~ LNAdexp, data = table6_10)
summary(mod_2)
-
-Call:
-lm(formula = LNExp ~ LNAdexp, data = table6_10)
-
-Residuals:
- Min 1Q Median 3Q Max
--2.2162 -0.9762 -0.3155 1.2048 2.5228
-
-Coefficients:
- Estimate Std. Error t value Pr(>|t|)
-(Intercept) 0.9864 1.5702 0.628 0.53517
-LNAdexp 0.6038 0.1658 3.642 0.00113 **
-Signif. codes: 0 '***' 0.001 '**' 0.01 '*' 0.05 '.' 0.1 ' ' 1
-
-Residual standard error: 1.358 on 27 degrees of freedom
-Multiple R-squared: 0.3294, Adjusted R-squared: 0.3046
-F-statistic: 13.26 on 1 and 27 DF, p-value: 0.001132
#model 3 ------------------------------------------------
mod_3 <- lm(Exp_inverse ~ Adexp_inverse, data = table6_10)
summary(mod_3)
-
-Call:
-lm(formula = Exp_inverse ~ Adexp_inverse, data = table6_10)
-
-Residuals:
- Min 1Q Median 3Q Max
--0.003370 -0.002774 -0.001858 0.001104 0.008824
-
Paraphrase This Document
Need a fresh take? Get an instant paraphrase of this document with our AI Paraphraser
-Coefficients:
- Estimate Std. Error t value Pr(>|t|)
-(Intercept) 0.0029393 0.0007668 3.833 0.000687 ***
-Adexp_inverse 1.2494432 1.1971381 1.044 0.305883
----
-Signif. codes: 0 '***' 0.001 '**' 0.01 '*' 0.05 '.' 0.1 ' ' 1
-
-Residual standard error: 0.003722 on 27 degrees of freedom
-Multiple R-squared: 0.03878, Adjusted R-squared: 0.003179
-F-statistic: 1.089 on 1 and 27 DF, p-value: 0.3059
#model 4 -----------------------------------------------
mod_4 <- lm(Exp ~ LNAdexp, data = table6_10)
summary(mod_4)
-
-Call:
-lm(formula = Exp ~ LNAdexp, data = table6_10)
-
-Residuals:
- Min 1Q Median 3Q Max
--5082.7 -2470.6 -551.2 1248.4 10737.1
-
-Coefficients:
- Estimate Std. Error t value Pr(>|t|)
-(Intercept) -12585.0 4382.1 -2.872 0.00785 **
-LNAdexp 1626.6 462.7 3.516 0.00157 **
----
-Signif. codes: 0 '***' 0.001 '**' 0.01 '*' 0.05 '.' 0.1 ' ' 1
-
-Residual standard error: 3788 on 27 degrees of freedom
-Multiple R-squared: 0.314, Adjusted R-squared: 0.2886
-F-statistic: 12.36 on 1 and 27 DF, p-value: 0.001568
#model 5 --------------------------------------------
mod_5 <- lm(Exp ~ Adexp_inverse, data = table6_10)
summary(mod_5)
-
-Call:
-lm(formula = Exp ~ Adexp_inverse, data = table6_10)
-
-Residuals:
- Min 1Q Median 3Q Max
- -2868 -2516 -1873 1691 16127
-
-Coefficients:
- Estimate Std. Error t value Pr(>|t|)
-(Intercept) 3077.3 920.3 3.344 0.00244 **
-Adexp_inverse -1642056.1 1436933.9 -1.143 0.26317
----
- Estimate Std. Error t value Pr(>|t|)
-(Intercept) 0.0029393 0.0007668 3.833 0.000687 ***
-Adexp_inverse 1.2494432 1.1971381 1.044 0.305883
----
-Signif. codes: 0 '***' 0.001 '**' 0.01 '*' 0.05 '.' 0.1 ' ' 1
-
-Residual standard error: 0.003722 on 27 degrees of freedom
-Multiple R-squared: 0.03878, Adjusted R-squared: 0.003179
-F-statistic: 1.089 on 1 and 27 DF, p-value: 0.3059
#model 4 -----------------------------------------------
mod_4 <- lm(Exp ~ LNAdexp, data = table6_10)
summary(mod_4)
-
-Call:
-lm(formula = Exp ~ LNAdexp, data = table6_10)
-
-Residuals:
- Min 1Q Median 3Q Max
--5082.7 -2470.6 -551.2 1248.4 10737.1
-
-Coefficients:
- Estimate Std. Error t value Pr(>|t|)
-(Intercept) -12585.0 4382.1 -2.872 0.00785 **
-LNAdexp 1626.6 462.7 3.516 0.00157 **
----
-Signif. codes: 0 '***' 0.001 '**' 0.01 '*' 0.05 '.' 0.1 ' ' 1
-
-Residual standard error: 3788 on 27 degrees of freedom
-Multiple R-squared: 0.314, Adjusted R-squared: 0.2886
-F-statistic: 12.36 on 1 and 27 DF, p-value: 0.001568
#model 5 --------------------------------------------
mod_5 <- lm(Exp ~ Adexp_inverse, data = table6_10)
summary(mod_5)
-
-Call:
-lm(formula = Exp ~ Adexp_inverse, data = table6_10)
-
-Residuals:
- Min 1Q Median 3Q Max
- -2868 -2516 -1873 1691 16127
-
-Coefficients:
- Estimate Std. Error t value Pr(>|t|)
-(Intercept) 3077.3 920.3 3.344 0.00244 **
-Adexp_inverse -1642056.1 1436933.9 -1.143 0.26317
----
-Signif. codes: 0 '***' 0.001 '**' 0.01 '*' 0.05 '.' 0.1 ' ' 1
-
-Residual standard error: 4467 on 27 degrees of freedom
-Multiple R-squared: 0.04613, Adjusted R-squared: 0.01081
-F-statistic: 1.306 on 1 and 27 DF, p-value: 0.2632
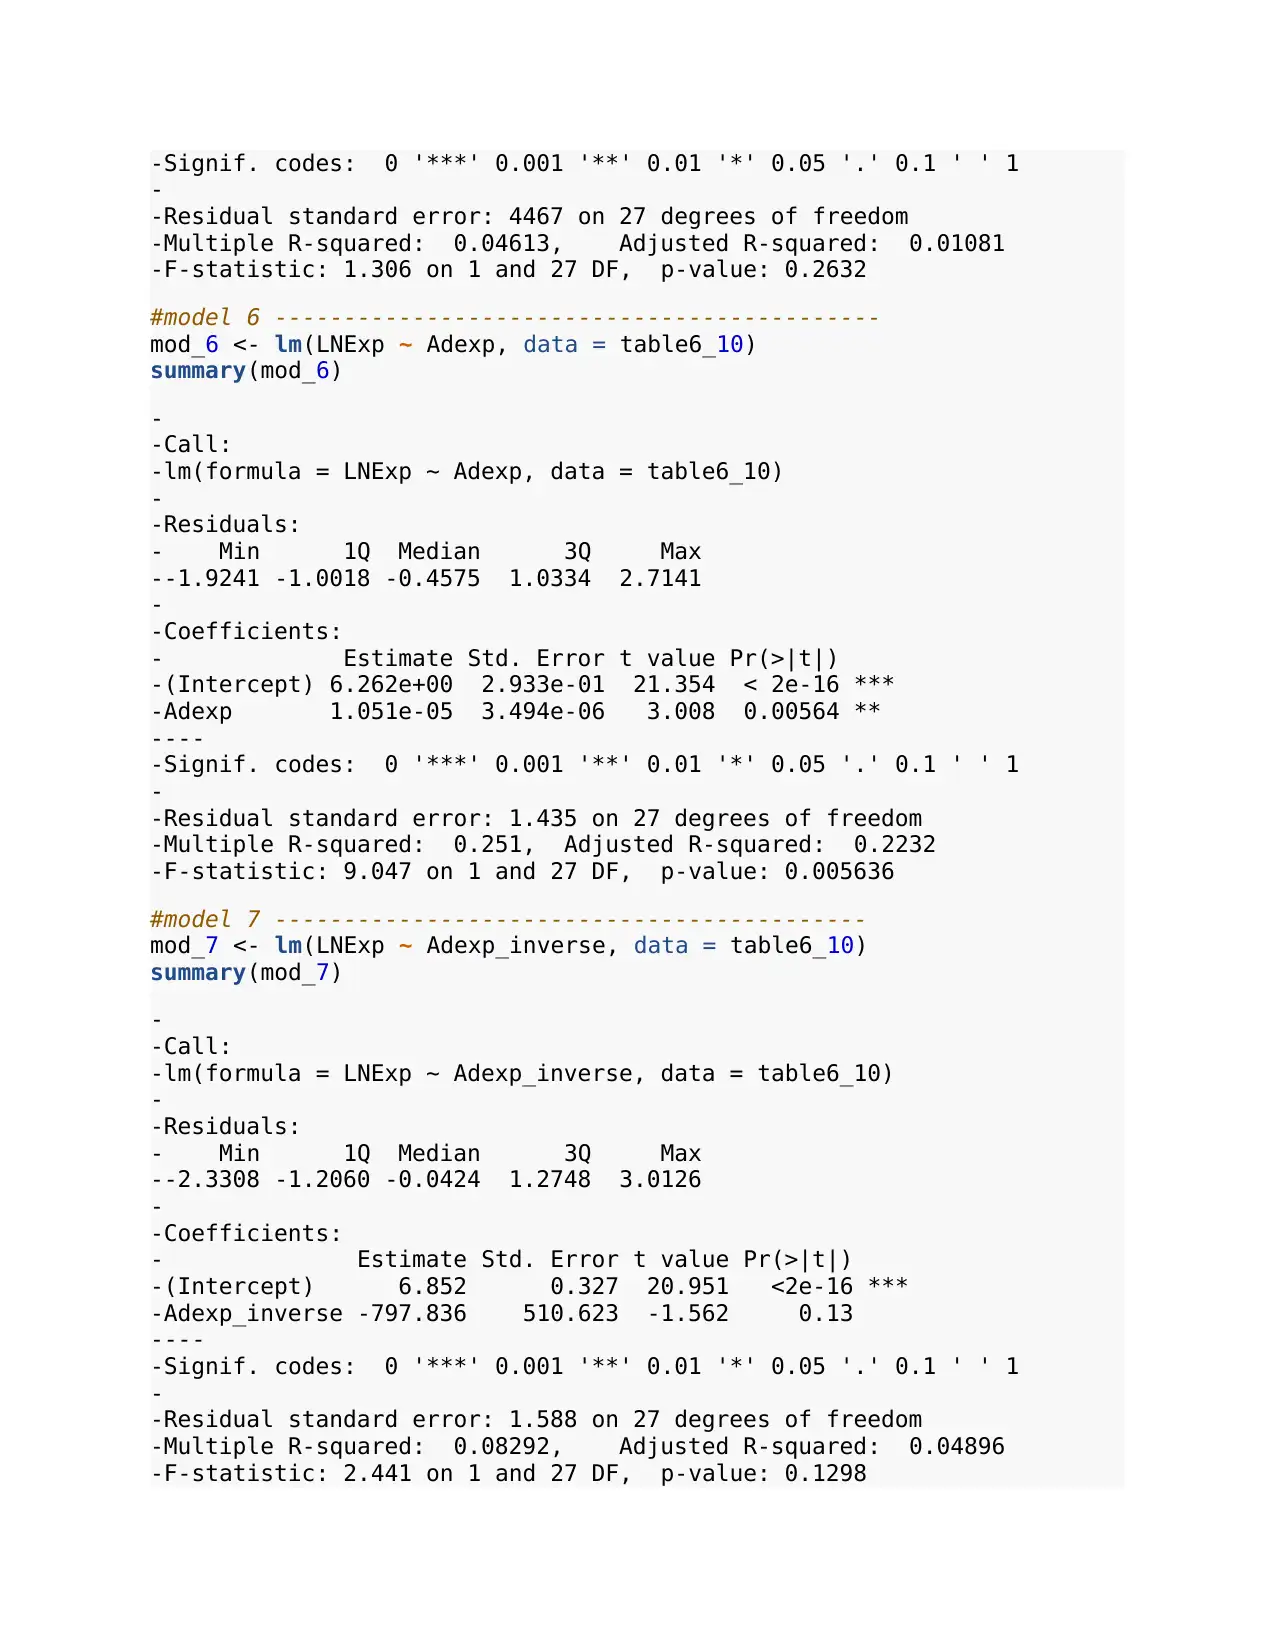
#model 6 --------------------------------------------
mod_6 <- lm(LNExp ~ Adexp, data = table6_10)
summary(mod_6)
-
-Call:
-lm(formula = LNExp ~ Adexp, data = table6_10)
-
-Residuals:
- Min 1Q Median 3Q Max
--1.9241 -1.0018 -0.4575 1.0334 2.7141
-
-Coefficients:
- Estimate Std. Error t value Pr(>|t|)
-(Intercept) 6.262e+00 2.933e-01 21.354 < 2e-16 ***
-Adexp 1.051e-05 3.494e-06 3.008 0.00564 **
----
-Signif. codes: 0 '***' 0.001 '**' 0.01 '*' 0.05 '.' 0.1 ' ' 1
-
-Residual standard error: 1.435 on 27 degrees of freedom
-Multiple R-squared: 0.251, Adjusted R-squared: 0.2232
-F-statistic: 9.047 on 1 and 27 DF, p-value: 0.005636
#model 7 -------------------------------------------
mod_7 <- lm(LNExp ~ Adexp_inverse, data = table6_10)
summary(mod_7)
-
-Call:
-lm(formula = LNExp ~ Adexp_inverse, data = table6_10)
-
-Residuals:
- Min 1Q Median 3Q Max
--2.3308 -1.2060 -0.0424 1.2748 3.0126
-
-Coefficients:
- Estimate Std. Error t value Pr(>|t|)
-(Intercept) 6.852 0.327 20.951 <2e-16 ***
-Adexp_inverse -797.836 510.623 -1.562 0.13
----
-Signif. codes: 0 '***' 0.001 '**' 0.01 '*' 0.05 '.' 0.1 ' ' 1
-
-Residual standard error: 1.588 on 27 degrees of freedom
-Multiple R-squared: 0.08292, Adjusted R-squared: 0.04896
-F-statistic: 2.441 on 1 and 27 DF, p-value: 0.1298
-
-Residual standard error: 4467 on 27 degrees of freedom
-Multiple R-squared: 0.04613, Adjusted R-squared: 0.01081
-F-statistic: 1.306 on 1 and 27 DF, p-value: 0.2632
#model 6 --------------------------------------------
mod_6 <- lm(LNExp ~ Adexp, data = table6_10)
summary(mod_6)
-
-Call:
-lm(formula = LNExp ~ Adexp, data = table6_10)
-
-Residuals:
- Min 1Q Median 3Q Max
--1.9241 -1.0018 -0.4575 1.0334 2.7141
-
-Coefficients:
- Estimate Std. Error t value Pr(>|t|)
-(Intercept) 6.262e+00 2.933e-01 21.354 < 2e-16 ***
-Adexp 1.051e-05 3.494e-06 3.008 0.00564 **
----
-Signif. codes: 0 '***' 0.001 '**' 0.01 '*' 0.05 '.' 0.1 ' ' 1
-
-Residual standard error: 1.435 on 27 degrees of freedom
-Multiple R-squared: 0.251, Adjusted R-squared: 0.2232
-F-statistic: 9.047 on 1 and 27 DF, p-value: 0.005636
#model 7 -------------------------------------------
mod_7 <- lm(LNExp ~ Adexp_inverse, data = table6_10)
summary(mod_7)
-
-Call:
-lm(formula = LNExp ~ Adexp_inverse, data = table6_10)
-
-Residuals:
- Min 1Q Median 3Q Max
--2.3308 -1.2060 -0.0424 1.2748 3.0126
-
-Coefficients:
- Estimate Std. Error t value Pr(>|t|)
-(Intercept) 6.852 0.327 20.951 <2e-16 ***
-Adexp_inverse -797.836 510.623 -1.562 0.13
----
-Signif. codes: 0 '***' 0.001 '**' 0.01 '*' 0.05 '.' 0.1 ' ' 1
-
-Residual standard error: 1.588 on 27 degrees of freedom
-Multiple R-squared: 0.08292, Adjusted R-squared: 0.04896
-F-statistic: 2.441 on 1 and 27 DF, p-value: 0.1298
⊘ This is a preview!⊘
Do you want full access?
Subscribe today to unlock all pages.
Trusted by 1+ million students worldwide
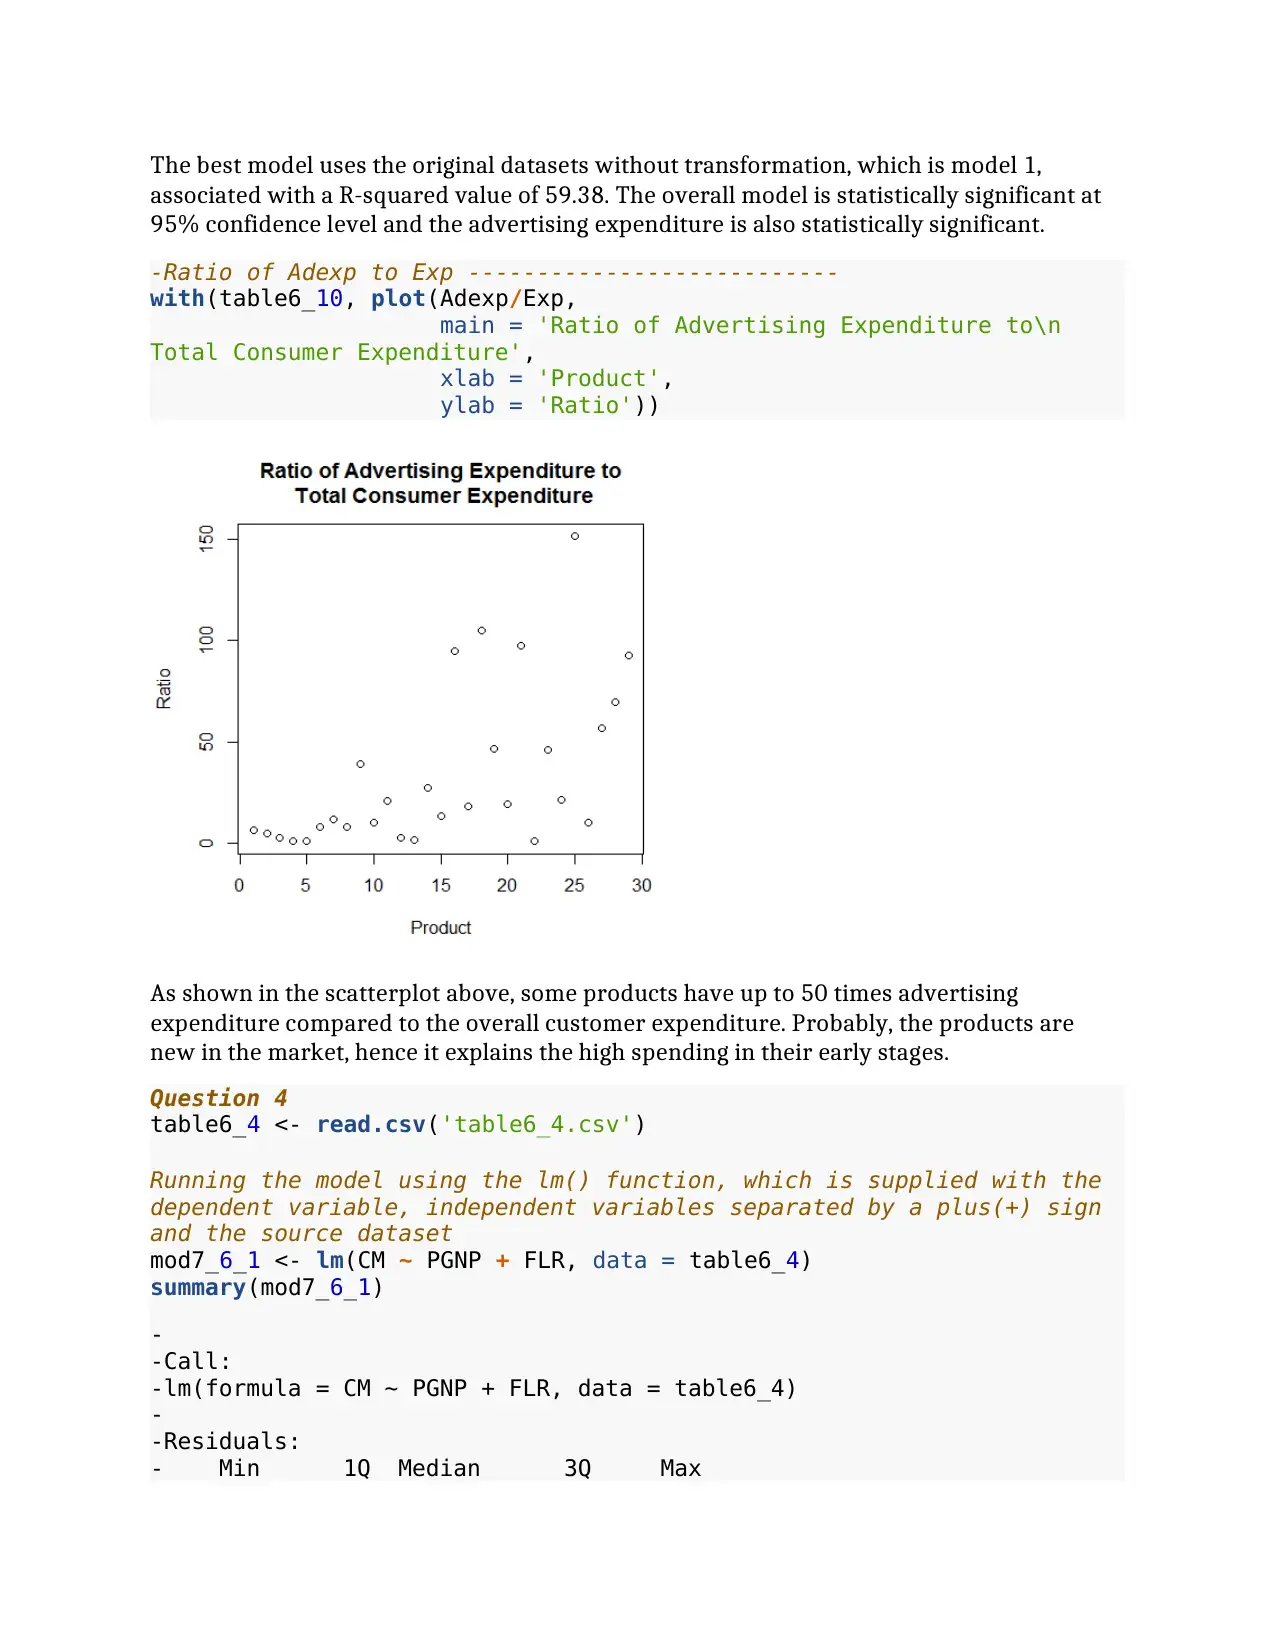
The best model uses the original datasets without transformation, which is model 1,
associated with a R-squared value of 59.38. The overall model is statistically significant at
95% confidence level and the advertising expenditure is also statistically significant.
-Ratio of Adexp to Exp ---------------------------
with(table6_10, plot(Adexp/Exp,
main = 'Ratio of Advertising Expenditure to\n
Total Consumer Expenditure',
xlab = 'Product',
ylab = 'Ratio'))
As shown in the scatterplot above, some products have up to 50 times advertising
expenditure compared to the overall customer expenditure. Probably, the products are
new in the market, hence it explains the high spending in their early stages.
Question 4
table6_4 <- read.csv('table6_4.csv')
Running the model using the lm() function, which is supplied with the
dependent variable, independent variables separated by a plus(+) sign
and the source dataset
mod7_6_1 <- lm(CM ~ PGNP + FLR, data = table6_4)
summary(mod7_6_1)
-
-Call:
-lm(formula = CM ~ PGNP + FLR, data = table6_4)
-
-Residuals:
- Min 1Q Median 3Q Max
Paraphrase This Document
Need a fresh take? Get an instant paraphrase of this document with our AI Paraphraser
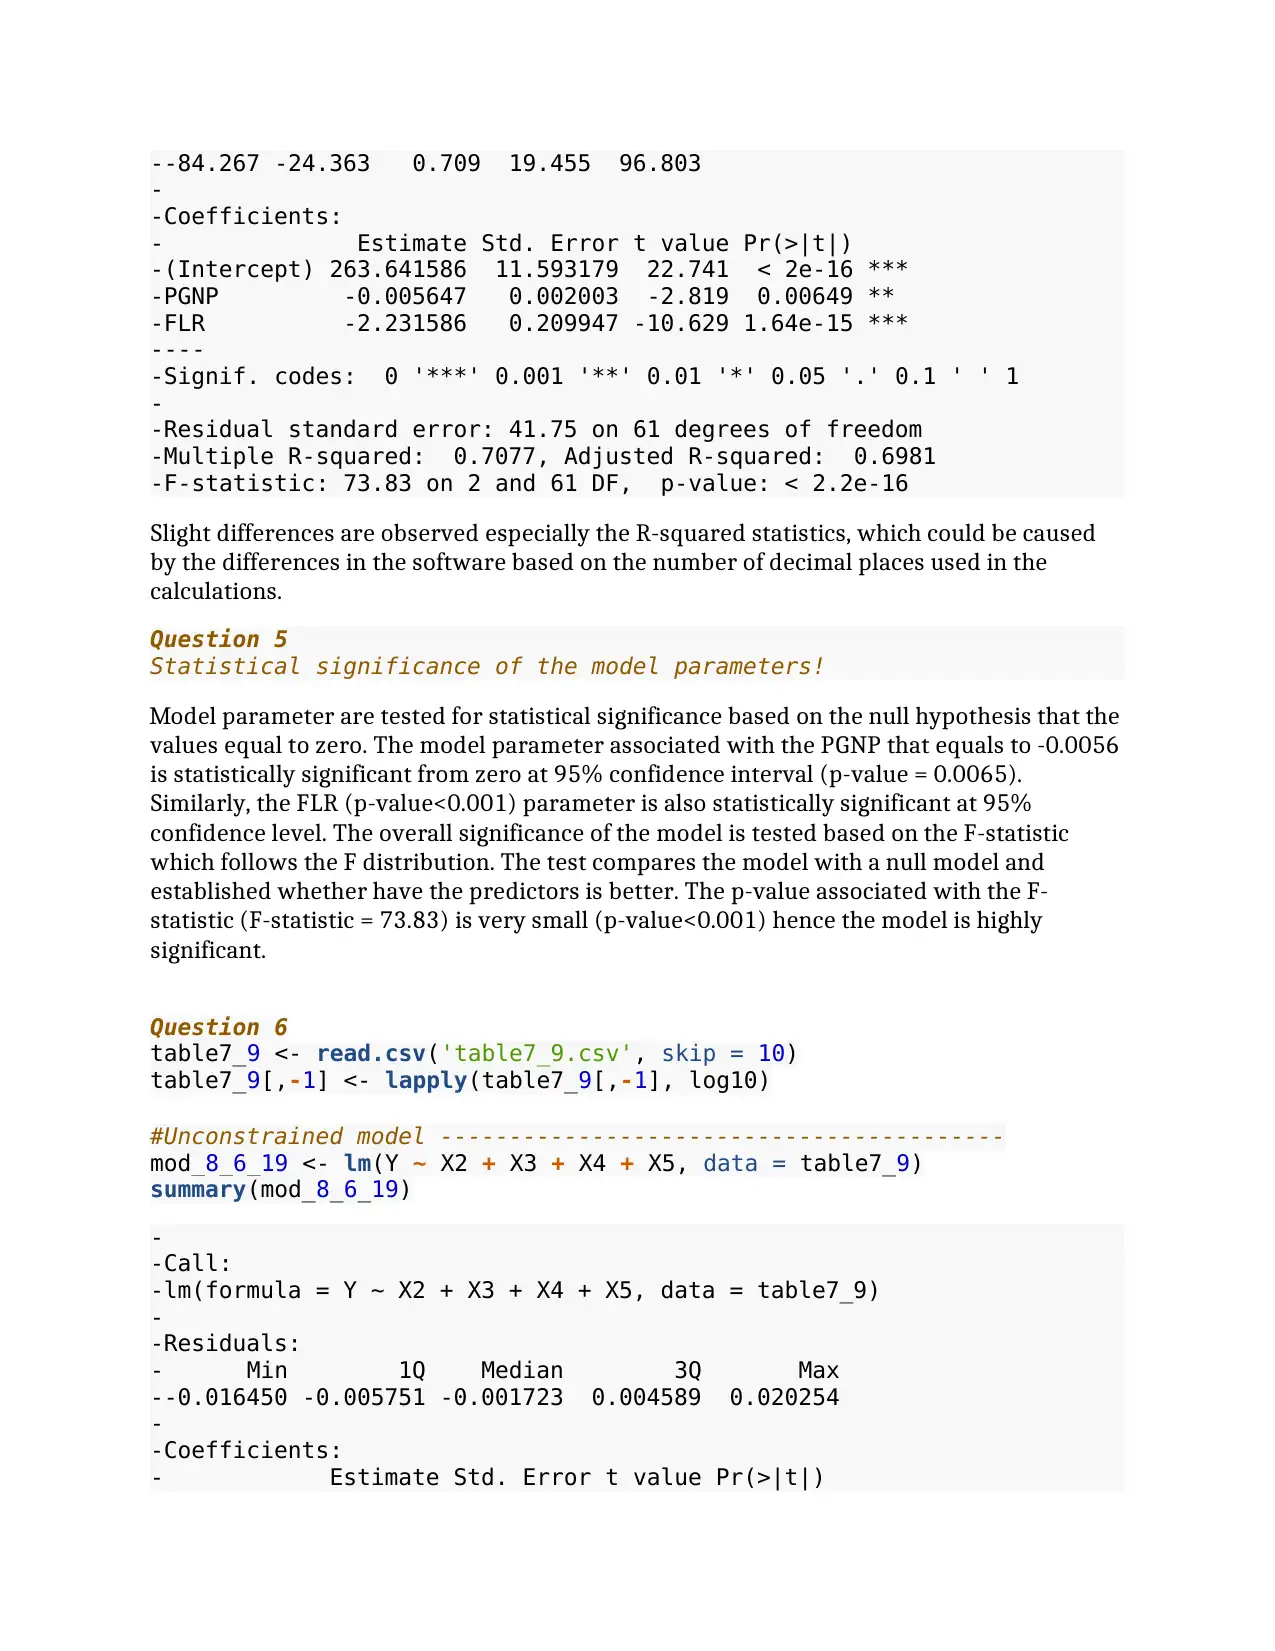
--84.267 -24.363 0.709 19.455 96.803
-
-Coefficients:
- Estimate Std. Error t value Pr(>|t|)
-(Intercept) 263.641586 11.593179 22.741 < 2e-16 ***
-PGNP -0.005647 0.002003 -2.819 0.00649 **
-FLR -2.231586 0.209947 -10.629 1.64e-15 ***
----
-Signif. codes: 0 '***' 0.001 '**' 0.01 '*' 0.05 '.' 0.1 ' ' 1
-
-Residual standard error: 41.75 on 61 degrees of freedom
-Multiple R-squared: 0.7077, Adjusted R-squared: 0.6981
-F-statistic: 73.83 on 2 and 61 DF, p-value: < 2.2e-16
Slight differences are observed especially the R-squared statistics, which could be caused
by the differences in the software based on the number of decimal places used in the
calculations.
Question 5
Statistical significance of the model parameters!
Model parameter are tested for statistical significance based on the null hypothesis that the
values equal to zero. The model parameter associated with the PGNP that equals to -0.0056
is statistically significant from zero at 95% confidence interval (p-value = 0.0065).
Similarly, the FLR (p-value<0.001) parameter is also statistically significant at 95%
confidence level. The overall significance of the model is tested based on the F-statistic
which follows the F distribution. The test compares the model with a null model and
established whether have the predictors is better. The p-value associated with the F-
statistic (F-statistic = 73.83) is very small (p-value<0.001) hence the model is highly
significant.
Question 6
table7_9 <- read.csv('table7_9.csv', skip = 10)
table7_9[,-1] <- lapply(table7_9[,-1], log10)
#Unconstrained model -----------------------------------------
mod_8_6_19 <- lm(Y ~ X2 + X3 + X4 + X5, data = table7_9)
summary(mod_8_6_19)
-
-Call:
-lm(formula = Y ~ X2 + X3 + X4 + X5, data = table7_9)
-
-Residuals:
- Min 1Q Median 3Q Max
--0.016450 -0.005751 -0.001723 0.004589 0.020254
-
-Coefficients:
- Estimate Std. Error t value Pr(>|t|)
-
-Coefficients:
- Estimate Std. Error t value Pr(>|t|)
-(Intercept) 263.641586 11.593179 22.741 < 2e-16 ***
-PGNP -0.005647 0.002003 -2.819 0.00649 **
-FLR -2.231586 0.209947 -10.629 1.64e-15 ***
----
-Signif. codes: 0 '***' 0.001 '**' 0.01 '*' 0.05 '.' 0.1 ' ' 1
-
-Residual standard error: 41.75 on 61 degrees of freedom
-Multiple R-squared: 0.7077, Adjusted R-squared: 0.6981
-F-statistic: 73.83 on 2 and 61 DF, p-value: < 2.2e-16
Slight differences are observed especially the R-squared statistics, which could be caused
by the differences in the software based on the number of decimal places used in the
calculations.
Question 5
Statistical significance of the model parameters!
Model parameter are tested for statistical significance based on the null hypothesis that the
values equal to zero. The model parameter associated with the PGNP that equals to -0.0056
is statistically significant from zero at 95% confidence interval (p-value = 0.0065).
Similarly, the FLR (p-value<0.001) parameter is also statistically significant at 95%
confidence level. The overall significance of the model is tested based on the F-statistic
which follows the F distribution. The test compares the model with a null model and
established whether have the predictors is better. The p-value associated with the F-
statistic (F-statistic = 73.83) is very small (p-value<0.001) hence the model is highly
significant.
Question 6
table7_9 <- read.csv('table7_9.csv', skip = 10)
table7_9[,-1] <- lapply(table7_9[,-1], log10)
#Unconstrained model -----------------------------------------
mod_8_6_19 <- lm(Y ~ X2 + X3 + X4 + X5, data = table7_9)
summary(mod_8_6_19)
-
-Call:
-lm(formula = Y ~ X2 + X3 + X4 + X5, data = table7_9)
-
-Residuals:
- Min 1Q Median 3Q Max
--0.016450 -0.005751 -0.001723 0.004589 0.020254
-
-Coefficients:
- Estimate Std. Error t value Pr(>|t|)
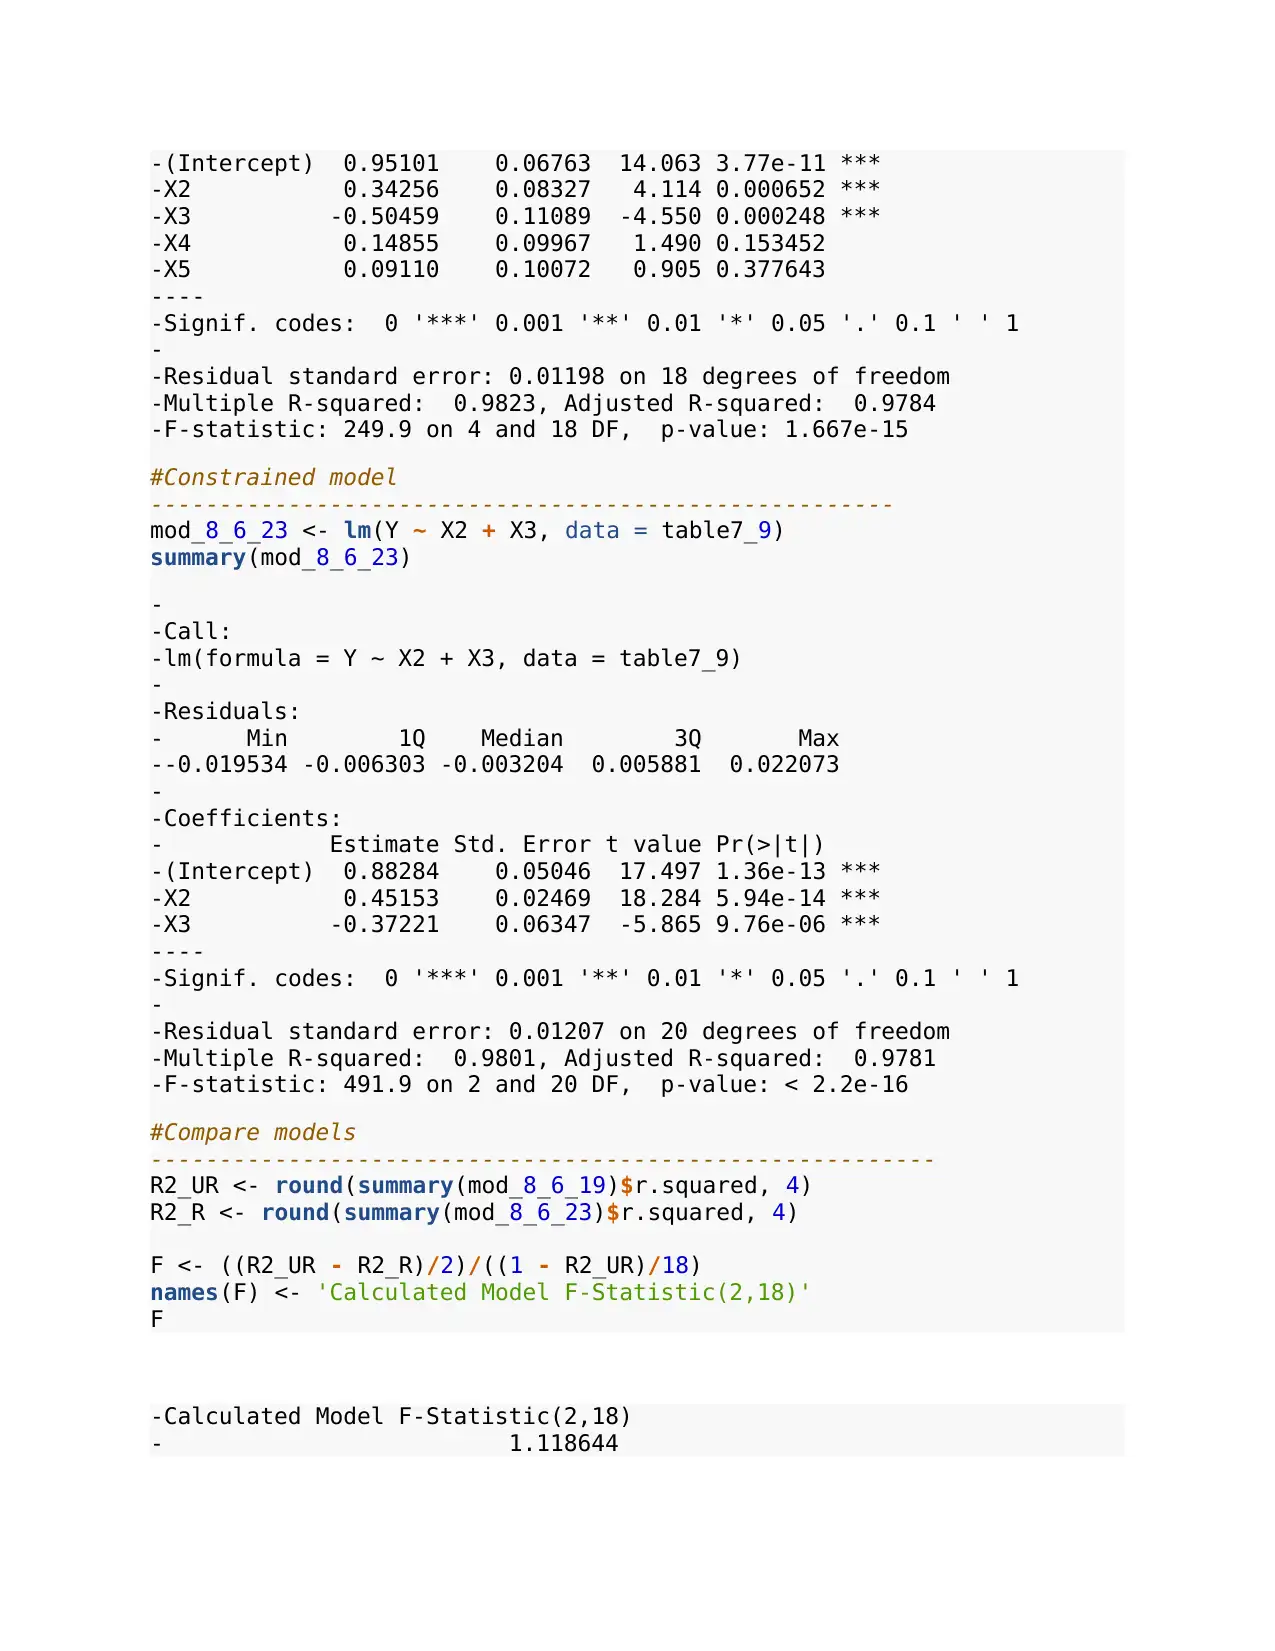
-(Intercept) 0.95101 0.06763 14.063 3.77e-11 ***
-X2 0.34256 0.08327 4.114 0.000652 ***
-X3 -0.50459 0.11089 -4.550 0.000248 ***
-X4 0.14855 0.09967 1.490 0.153452
-X5 0.09110 0.10072 0.905 0.377643
----
-Signif. codes: 0 '***' 0.001 '**' 0.01 '*' 0.05 '.' 0.1 ' ' 1
-
-Residual standard error: 0.01198 on 18 degrees of freedom
-Multiple R-squared: 0.9823, Adjusted R-squared: 0.9784
-F-statistic: 249.9 on 4 and 18 DF, p-value: 1.667e-15
#Constrained model
------------------------------------------------------
mod_8_6_23 <- lm(Y ~ X2 + X3, data = table7_9)
summary(mod_8_6_23)
-
-Call:
-lm(formula = Y ~ X2 + X3, data = table7_9)
-
-Residuals:
- Min 1Q Median 3Q Max
--0.019534 -0.006303 -0.003204 0.005881 0.022073
-
-Coefficients:
- Estimate Std. Error t value Pr(>|t|)
-(Intercept) 0.88284 0.05046 17.497 1.36e-13 ***
-X2 0.45153 0.02469 18.284 5.94e-14 ***
-X3 -0.37221 0.06347 -5.865 9.76e-06 ***
----
-Signif. codes: 0 '***' 0.001 '**' 0.01 '*' 0.05 '.' 0.1 ' ' 1
-
-Residual standard error: 0.01207 on 20 degrees of freedom
-Multiple R-squared: 0.9801, Adjusted R-squared: 0.9781
-F-statistic: 491.9 on 2 and 20 DF, p-value: < 2.2e-16
#Compare models
---------------------------------------------------------
R2_UR <- round(summary(mod_8_6_19)$r.squared, 4)
R2_R <- round(summary(mod_8_6_23)$r.squared, 4)
F <- ((R2_UR - R2_R)/2)/((1 - R2_UR)/18)
names(F) <- 'Calculated Model F-Statistic(2,18)'
F
-Calculated Model F-Statistic(2,18)
- 1.118644
⊘ This is a preview!⊘
Do you want full access?
Subscribe today to unlock all pages.
Trusted by 1+ million students worldwide
Question 7
table10_8 <- read.csv('table10_8.csv')
table10_10 <- data.frame()
lm_mod_10_8 <- list()
# Creating table 10.10
---------------------------------------------------------------
for(i in 1:6){
lm_mod_10_8[[i]] = lm(Y ~ table10_8[,i+2], data = table10_8)
r.squared = round(summary(lm_mod_10_8[[i]])$r.squared, 4)
tol = round((1-r.squared), 4)
table10_10[i,c('Dependent Variable', 'R^2 Value', 'Tolerance(TOL)=1-
R^2')] = c(paste0('X_', i), r.squared, tol)
}
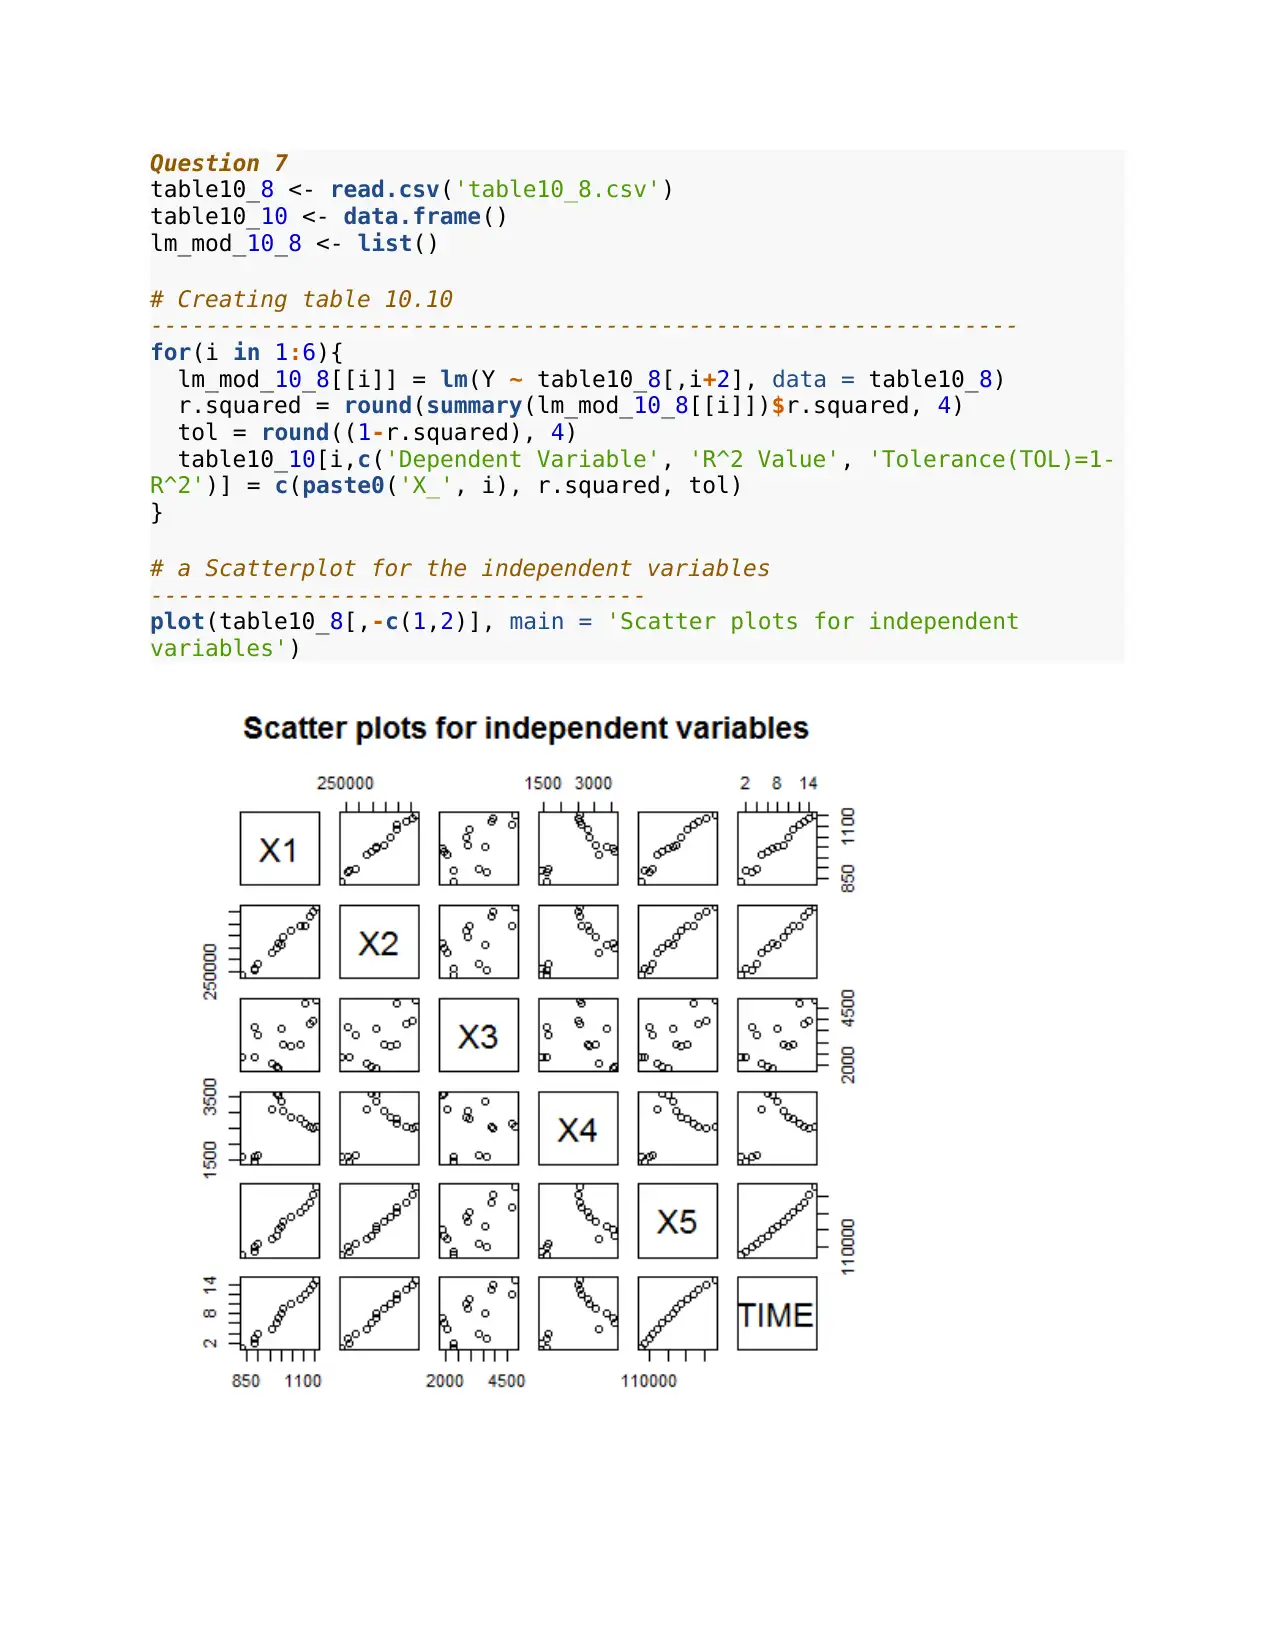
# a Scatterplot for the independent variables
------------------------------------
plot(table10_8[,-c(1,2)], main = 'Scatter plots for independent
variables')
table10_8 <- read.csv('table10_8.csv')
table10_10 <- data.frame()
lm_mod_10_8 <- list()
# Creating table 10.10
---------------------------------------------------------------
for(i in 1:6){
lm_mod_10_8[[i]] = lm(Y ~ table10_8[,i+2], data = table10_8)
r.squared = round(summary(lm_mod_10_8[[i]])$r.squared, 4)
tol = round((1-r.squared), 4)
table10_10[i,c('Dependent Variable', 'R^2 Value', 'Tolerance(TOL)=1-
R^2')] = c(paste0('X_', i), r.squared, tol)
}
# a Scatterplot for the independent variables
------------------------------------
plot(table10_8[,-c(1,2)], main = 'Scatter plots for independent
variables')
Paraphrase This Document
Need a fresh take? Get an instant paraphrase of this document with our AI Paraphraser
There are some strong relationships between the independent variables. Some of the
relationships are very strong. The relationships seem to be linear, for example, X1 and X2.
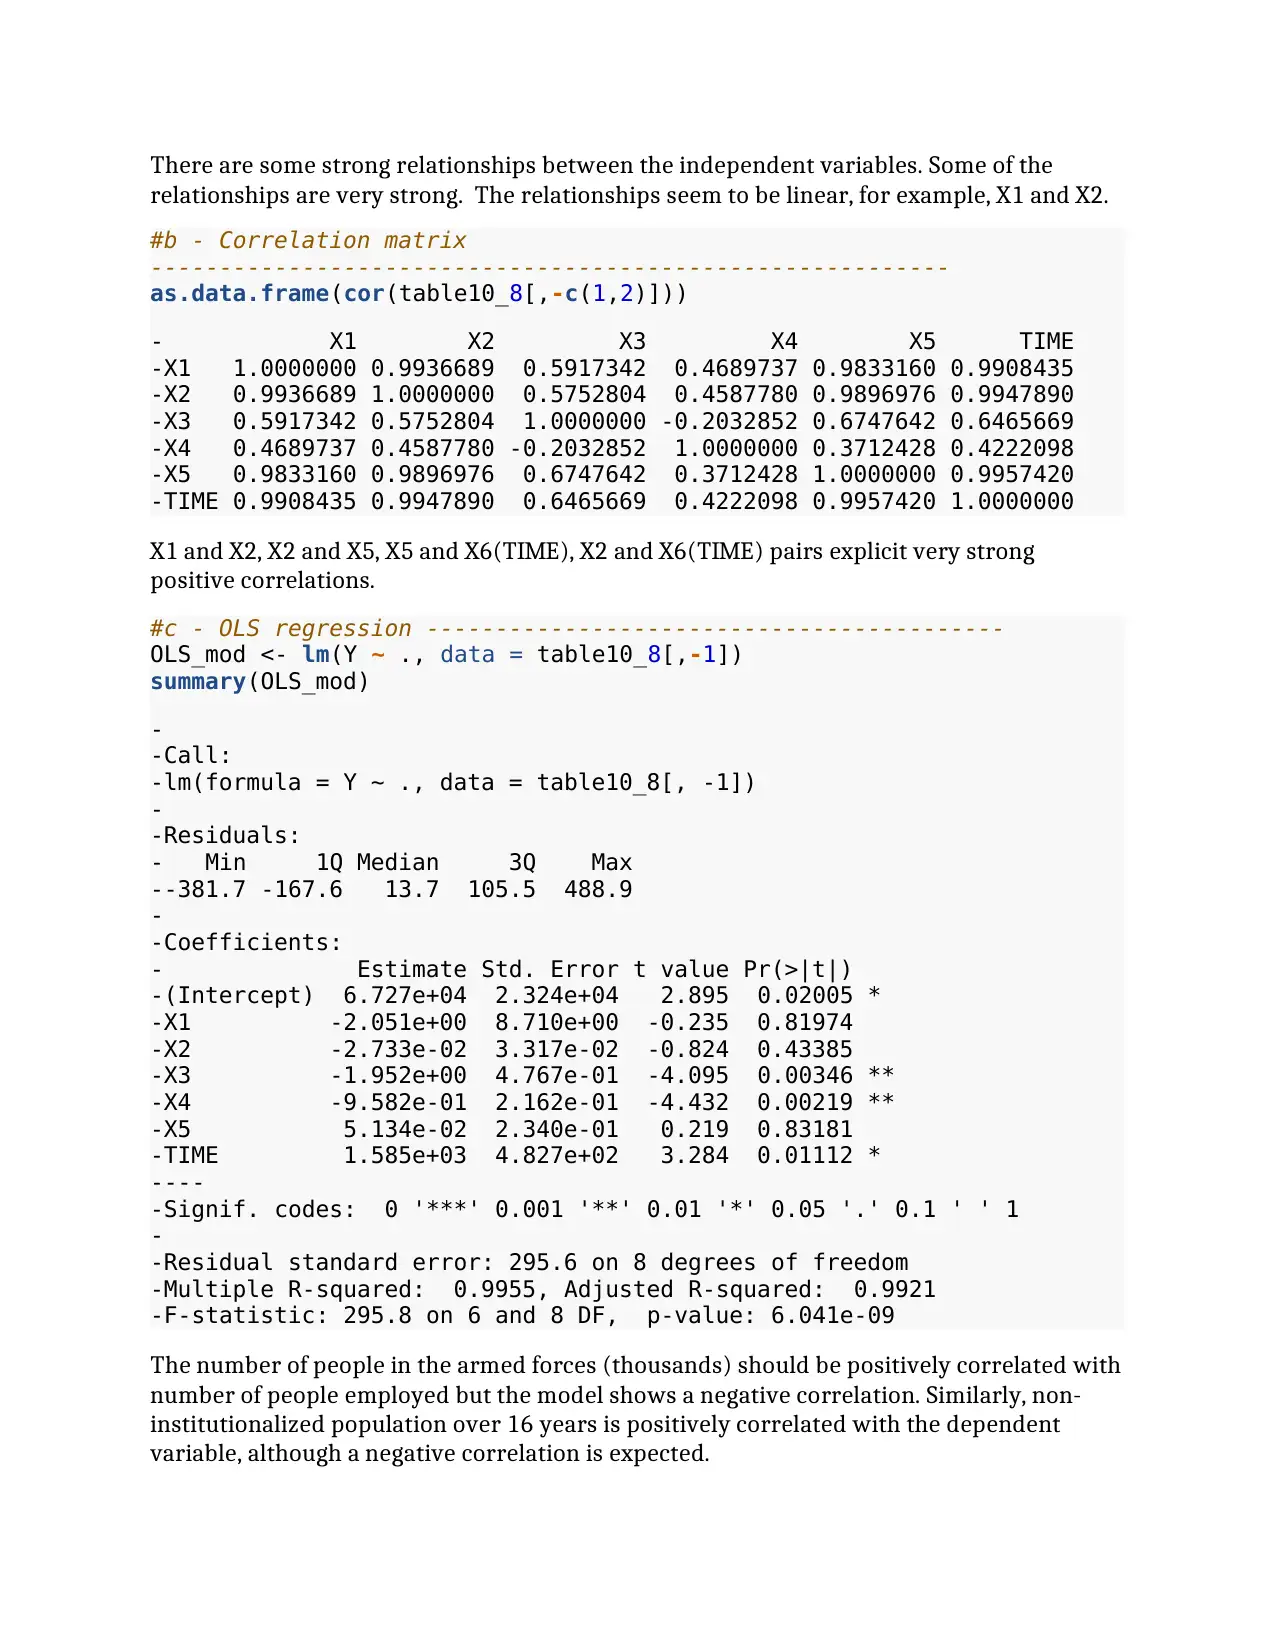
#b - Correlation matrix
----------------------------------------------------------
as.data.frame(cor(table10_8[,-c(1,2)]))
- X1 X2 X3 X4 X5 TIME
-X1 1.0000000 0.9936689 0.5917342 0.4689737 0.9833160 0.9908435
-X2 0.9936689 1.0000000 0.5752804 0.4587780 0.9896976 0.9947890
-X3 0.5917342 0.5752804 1.0000000 -0.2032852 0.6747642 0.6465669
-X4 0.4689737 0.4587780 -0.2032852 1.0000000 0.3712428 0.4222098
-X5 0.9833160 0.9896976 0.6747642 0.3712428 1.0000000 0.9957420
-TIME 0.9908435 0.9947890 0.6465669 0.4222098 0.9957420 1.0000000
X1 and X2, X2 and X5, X5 and X6(TIME), X2 and X6(TIME) pairs explicit very strong
positive correlations.
#c - OLS regression ------------------------------------------
OLS_mod <- lm(Y ~ ., data = table10_8[,-1])
summary(OLS_mod)
-
-Call:
-lm(formula = Y ~ ., data = table10_8[, -1])
-
-Residuals:
- Min 1Q Median 3Q Max
--381.7 -167.6 13.7 105.5 488.9
-
-Coefficients:
- Estimate Std. Error t value Pr(>|t|)
-(Intercept) 6.727e+04 2.324e+04 2.895 0.02005 *
-X1 -2.051e+00 8.710e+00 -0.235 0.81974
-X2 -2.733e-02 3.317e-02 -0.824 0.43385
-X3 -1.952e+00 4.767e-01 -4.095 0.00346 **
-X4 -9.582e-01 2.162e-01 -4.432 0.00219 **
-X5 5.134e-02 2.340e-01 0.219 0.83181
-TIME 1.585e+03 4.827e+02 3.284 0.01112 *
----
-Signif. codes: 0 '***' 0.001 '**' 0.01 '*' 0.05 '.' 0.1 ' ' 1
-
-Residual standard error: 295.6 on 8 degrees of freedom
-Multiple R-squared: 0.9955, Adjusted R-squared: 0.9921
-F-statistic: 295.8 on 6 and 8 DF, p-value: 6.041e-09
The number of people in the armed forces (thousands) should be positively correlated with
number of people employed but the model shows a negative correlation. Similarly, non-
institutionalized population over 16 years is positively correlated with the dependent
variable, although a negative correlation is expected.
relationships are very strong. The relationships seem to be linear, for example, X1 and X2.
#b - Correlation matrix
----------------------------------------------------------
as.data.frame(cor(table10_8[,-c(1,2)]))
- X1 X2 X3 X4 X5 TIME
-X1 1.0000000 0.9936689 0.5917342 0.4689737 0.9833160 0.9908435
-X2 0.9936689 1.0000000 0.5752804 0.4587780 0.9896976 0.9947890
-X3 0.5917342 0.5752804 1.0000000 -0.2032852 0.6747642 0.6465669
-X4 0.4689737 0.4587780 -0.2032852 1.0000000 0.3712428 0.4222098
-X5 0.9833160 0.9896976 0.6747642 0.3712428 1.0000000 0.9957420
-TIME 0.9908435 0.9947890 0.6465669 0.4222098 0.9957420 1.0000000
X1 and X2, X2 and X5, X5 and X6(TIME), X2 and X6(TIME) pairs explicit very strong
positive correlations.
#c - OLS regression ------------------------------------------
OLS_mod <- lm(Y ~ ., data = table10_8[,-1])
summary(OLS_mod)
-
-Call:
-lm(formula = Y ~ ., data = table10_8[, -1])
-
-Residuals:
- Min 1Q Median 3Q Max
--381.7 -167.6 13.7 105.5 488.9
-
-Coefficients:
- Estimate Std. Error t value Pr(>|t|)
-(Intercept) 6.727e+04 2.324e+04 2.895 0.02005 *
-X1 -2.051e+00 8.710e+00 -0.235 0.81974
-X2 -2.733e-02 3.317e-02 -0.824 0.43385
-X3 -1.952e+00 4.767e-01 -4.095 0.00346 **
-X4 -9.582e-01 2.162e-01 -4.432 0.00219 **
-X5 5.134e-02 2.340e-01 0.219 0.83181
-TIME 1.585e+03 4.827e+02 3.284 0.01112 *
----
-Signif. codes: 0 '***' 0.001 '**' 0.01 '*' 0.05 '.' 0.1 ' ' 1
-
-Residual standard error: 295.6 on 8 degrees of freedom
-Multiple R-squared: 0.9955, Adjusted R-squared: 0.9921
-F-statistic: 295.8 on 6 and 8 DF, p-value: 6.041e-09
The number of people in the armed forces (thousands) should be positively correlated with
number of people employed but the model shows a negative correlation. Similarly, non-
institutionalized population over 16 years is positively correlated with the dependent
variable, although a negative correlation is expected.
#c -prove to multicollinearity
According to the OLS regression model, there is multicollinearity in the independent
variables.
################-Same analysis for table 10.17 as table 10.8
################
table10_17 <- read.csv('table10_17.csv')
table10_10.17 <- data.frame()
lm_mod_10_17 <- list()
# Creating table 10.10
---------------------------------------------------------------
for(i in 1:6){
lm_mod_10_17[[i]] = lm(Y ~ table10_17[,i+2], data = table10_17)
r.squared = round(summary(lm_mod_10_17[[i]])$r.squared, 4)
tol = round((1-r.squared), 4)
table10_10.17[i,c('Dependent Variable', 'R^2 Value',
'Tolerance(TOL)=1-R^2')] = c(paste0('X_', i), r.squared, tol)
}
# a Scatterplot for the independent variables
------------------------------------
plot(table10_17[,-c(1,2)], main = 'Scatter plots for independent
variables')
⊘ This is a preview!⊘
Do you want full access?
Subscribe today to unlock all pages.
Trusted by 1+ million students worldwide
1 out of 14
Related Documents


Your All-in-One AI-Powered Toolkit for Academic Success.
+13062052269
info@desklib.com
Available 24*7 on WhatsApp / Email
![[object Object]](/_next/static/media/star-bottom.7253800d.svg)
Unlock your academic potential
Copyright © 2020–2026 A2Z Services. All Rights Reserved. Developed and managed by ZUCOL.