logo

Frequency Analysis of Regenerate Vegetative or by Seed and Cross-Classified Plant Species

This assignment is about research methodology in the natural sciences, specifically focusing on statistics. It covers topics such as the scientific method, the need for statistics, experimental design, and various statistical tests and analyses.

9 Pages1580 Words251 Views
   

Added on  2022-12-15

About This Document

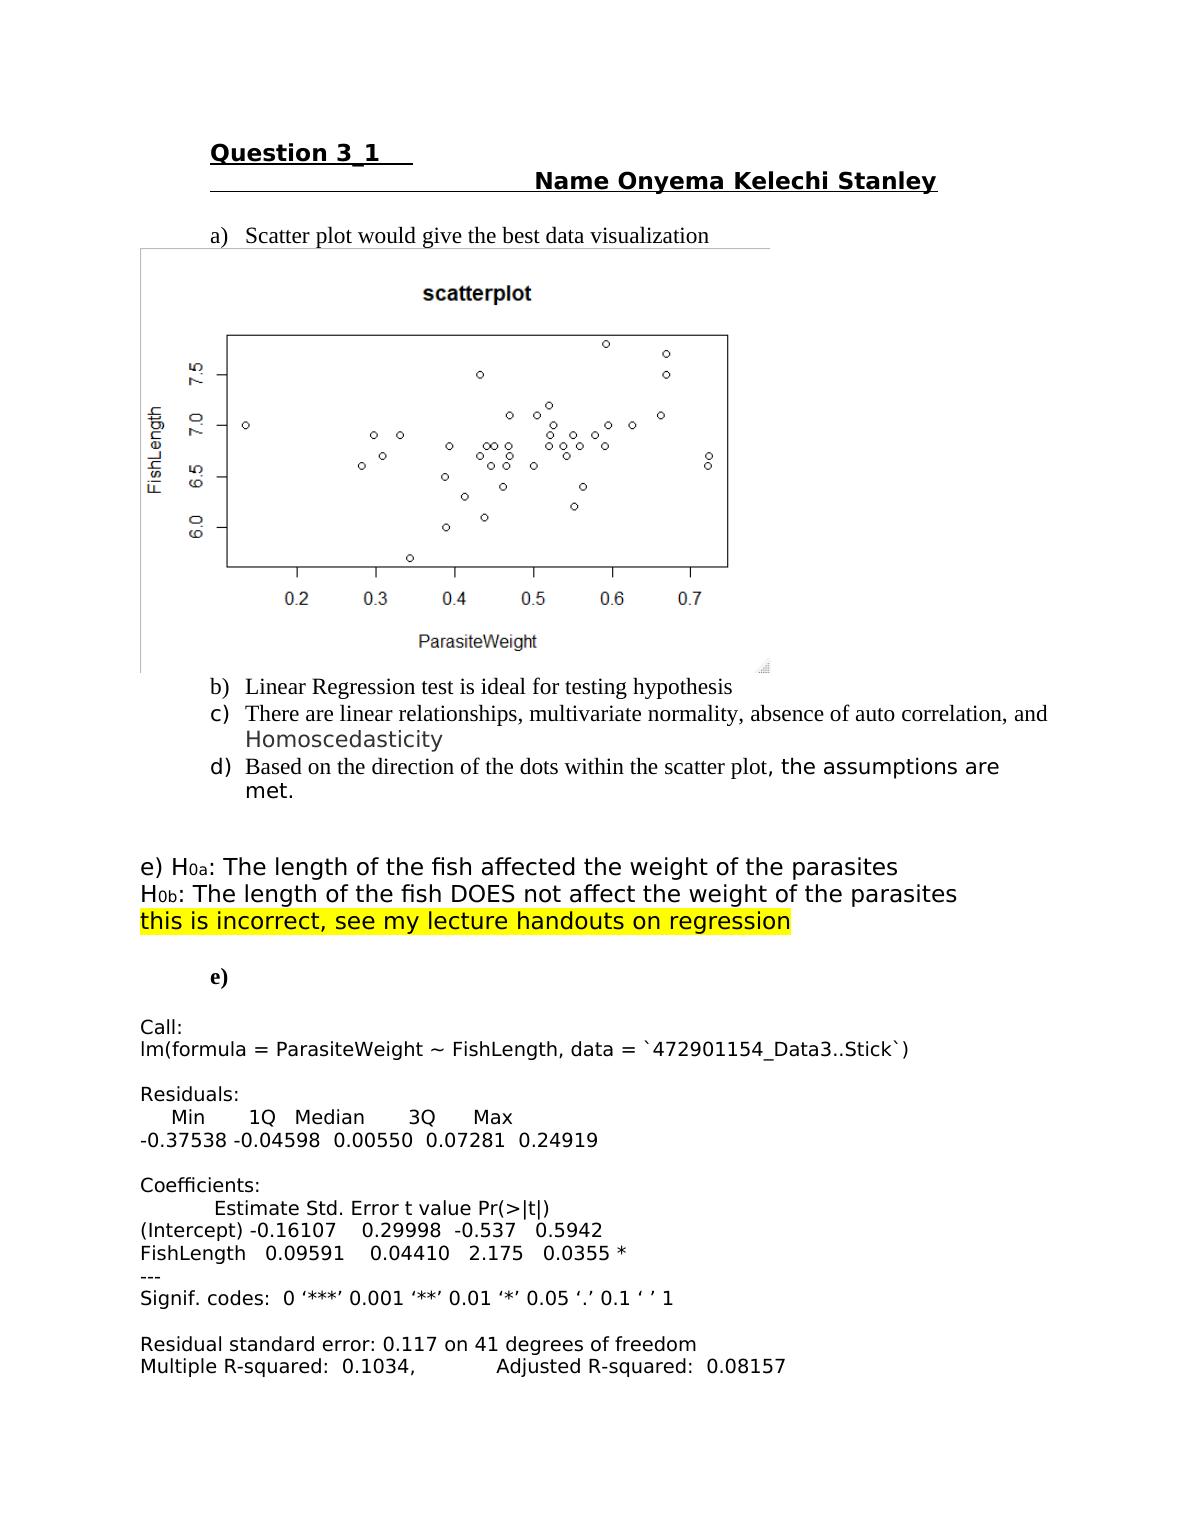
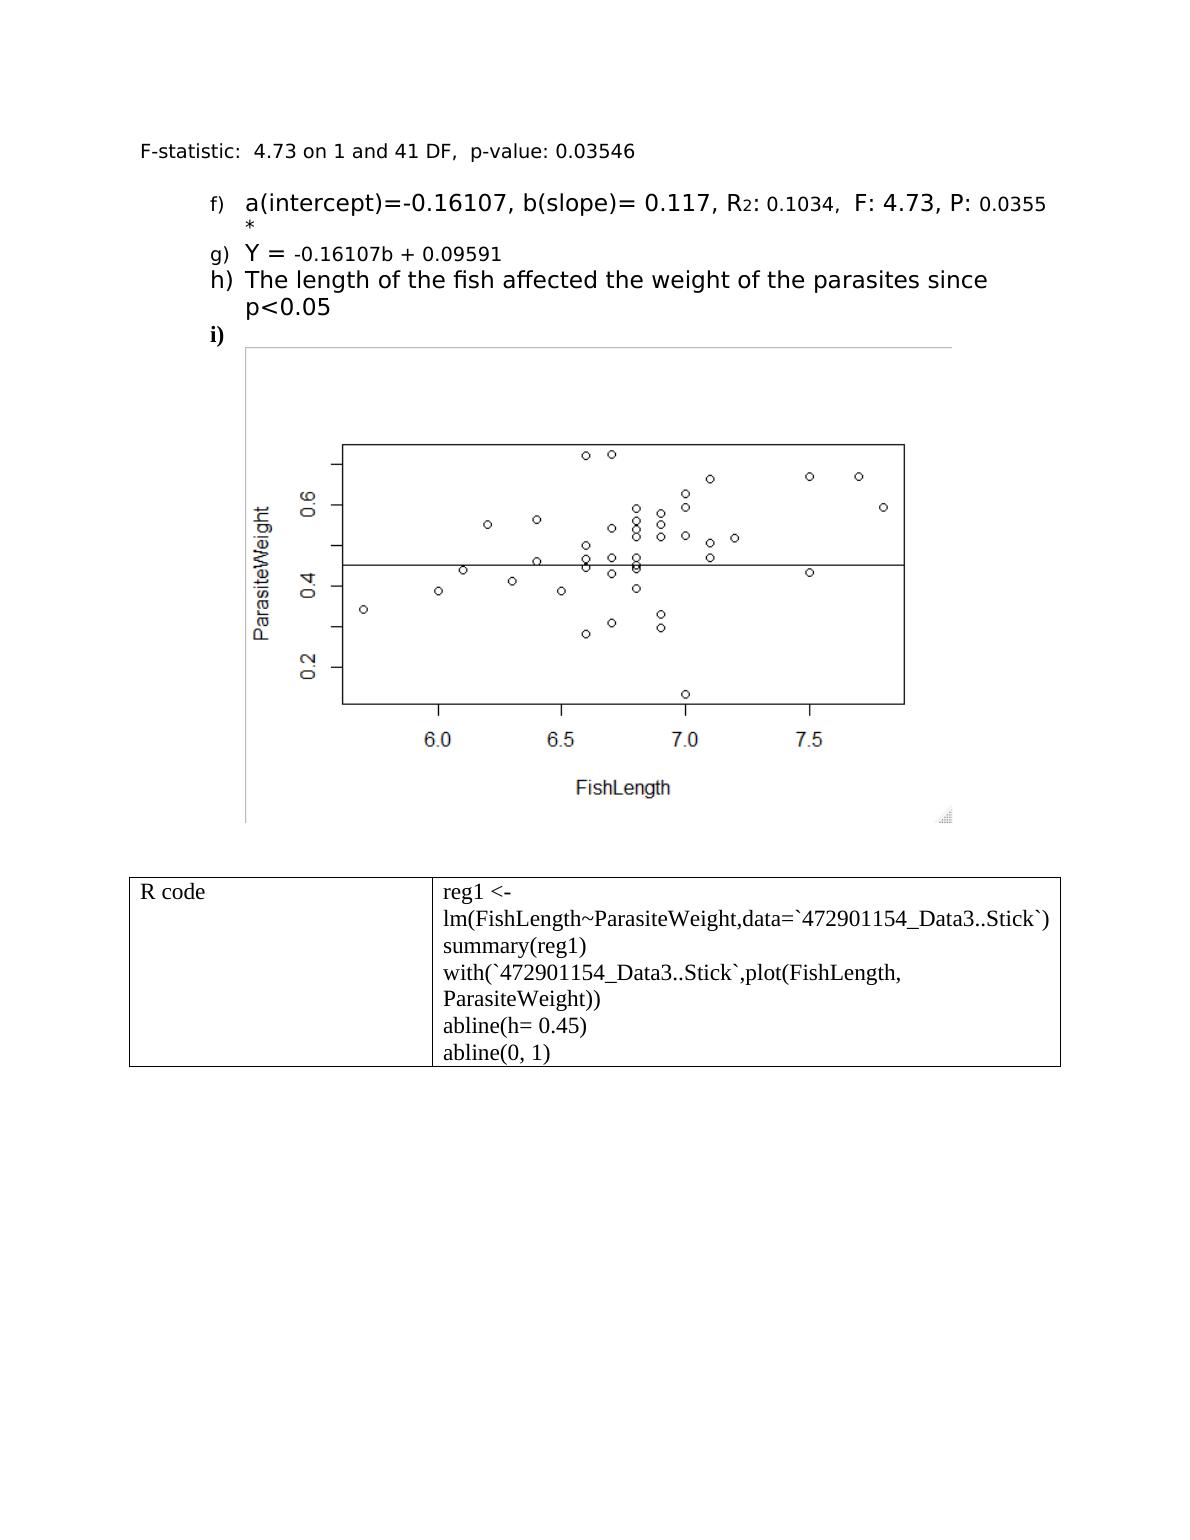
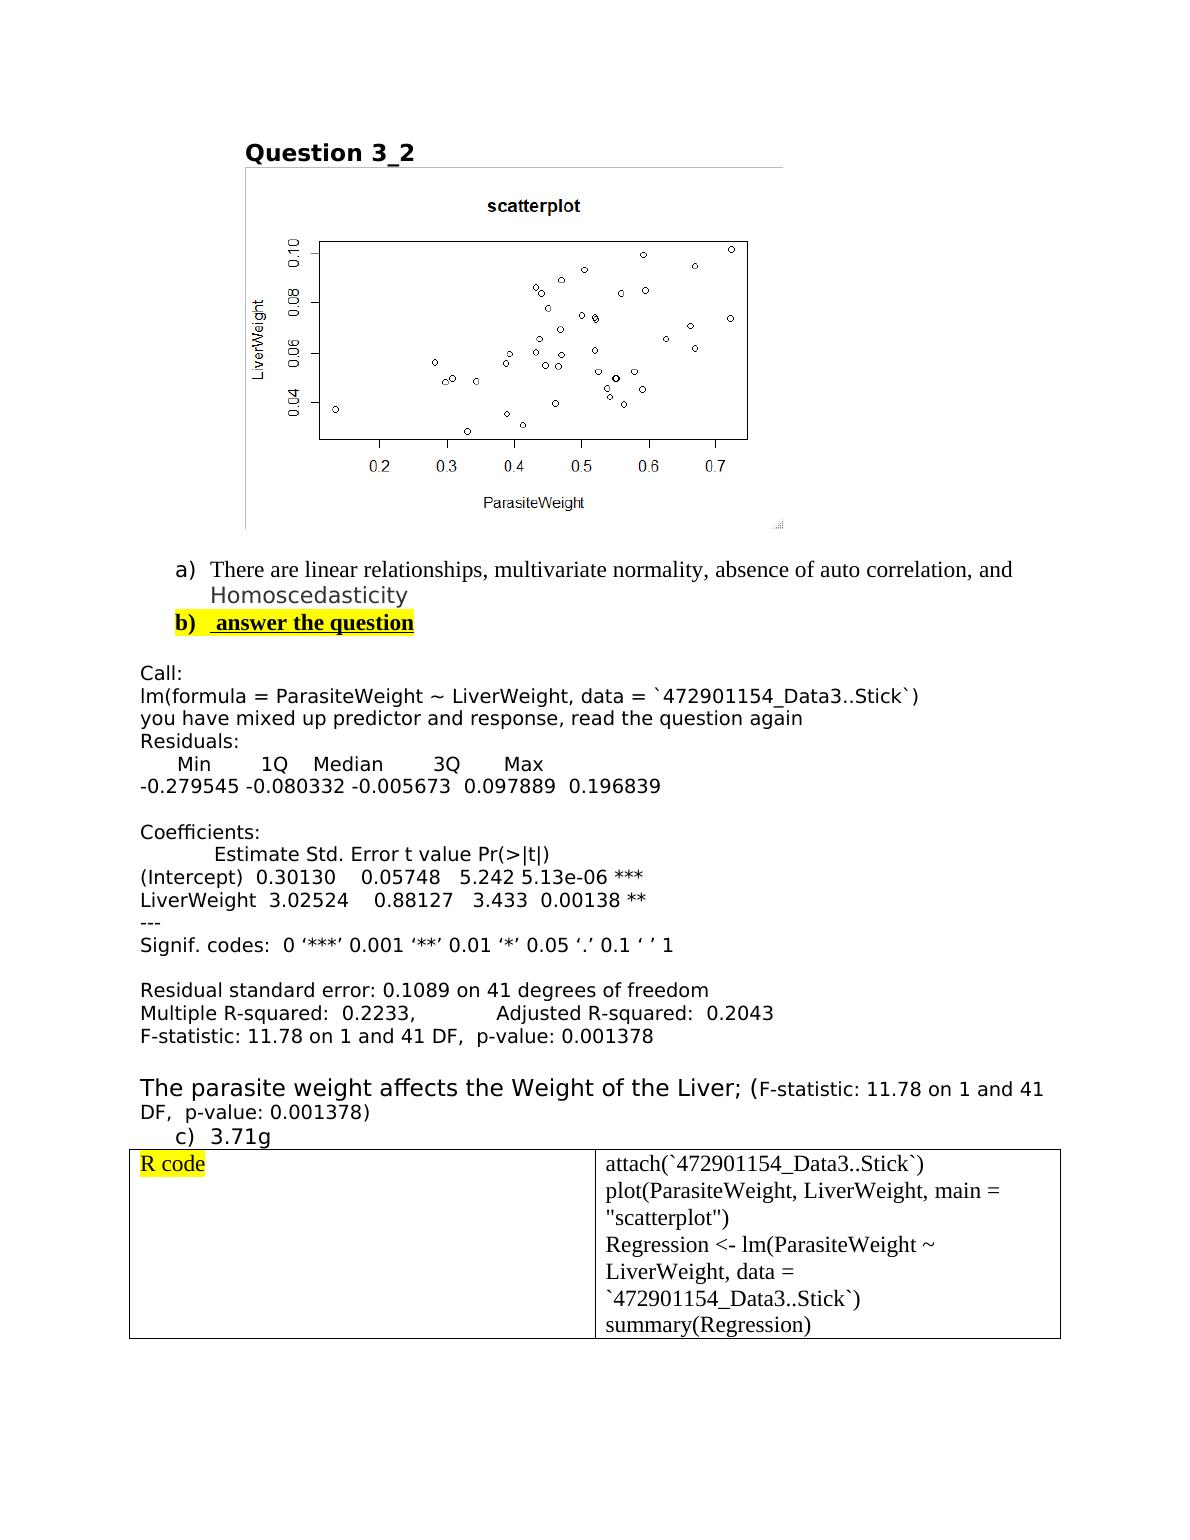
There is no relationship between regenerate vegetative or by seed, and cross-classified plant species. Chi-square test; goodness of fit test. The chi-square statistic is 0.484. The p-value is .486621.

Frequency Analysis of Regenerate Vegetative or by Seed and Cross-Classified Plant Species

This assignment is about research methodology in the natural sciences, specifically focusing on statistics. It covers topics such as the scientific method, the need for statistics, experimental design, and various statistical tests and analyses.

   Added on 2022-12-15

ShareRelated Documents
Question 3_1
Name Onyema Kelechi Stanley
a) Scatter plot would give the best data visualization
b) Linear Regression test is ideal for testing hypothesis
c) There are linear relationships, multivariate normality, absence of auto correlation, and
Homoscedasticity
d) Based on the direction of the dots within the scatter plot, the assumptions are
met.
e) H0a: The length of the fish affected the weight of the parasites
H0b: The length of the fish DOES not affect the weight of the parasites
this is incorrect, see my lecture handouts on regression
e)
Call:
lm(formula = ParasiteWeight ~ FishLength, data = `472901154_Data3..Stick`)
Residuals:
Min 1Q Median 3Q Max
-0.37538 -0.04598 0.00550 0.07281 0.24919
Coefficients:
Estimate Std. Error t value Pr(>|t|)
(Intercept) -0.16107 0.29998 -0.537 0.5942
FishLength 0.09591 0.04410 2.175 0.0355 *
---
Signif. codes: 0 ‘***’ 0.001 ‘**’ 0.01 ‘*’ 0.05 ‘.’ 0.1 ‘ ’ 1
Residual standard error: 0.117 on 41 degrees of freedom
Multiple R-squared: 0.1034, Adjusted R-squared: 0.08157
Frequency Analysis of Regenerate Vegetative or by Seed and Cross-Classified Plant Species_1
F-statistic: 4.73 on 1 and 41 DF, p-value: 0.03546
f) a(intercept)=-0.16107, b(slope)= 0.117, R2: 0.1034, F: 4.73, P: 0.0355
*
g) Y = -0.16107b + 0.09591
h) The length of the fish affected the weight of the parasites since
p<0.05
i)
R code reg1 <-
lm(FishLength~ParasiteWeight,data=`472901154_Data3..Stick`)
summary(reg1)
with(`472901154_Data3..Stick`,plot(FishLength,
ParasiteWeight))
abline(h= 0.45)
abline(0, 1)
Frequency Analysis of Regenerate Vegetative or by Seed and Cross-Classified Plant Species_2
Question 3_2
a) There are linear relationships, multivariate normality, absence of auto correlation, and
Homoscedasticity
b) answer the question
Call:
lm(formula = ParasiteWeight ~ LiverWeight, data = `472901154_Data3..Stick`)
you have mixed up predictor and response, read the question again
Residuals:
Min 1Q Median 3Q Max
-0.279545 -0.080332 -0.005673 0.097889 0.196839
Coefficients:
Estimate Std. Error t value Pr(>|t|)
(Intercept) 0.30130 0.05748 5.242 5.13e-06 ***
LiverWeight 3.02524 0.88127 3.433 0.00138 **
---
Signif. codes: 0 ‘***’ 0.001 ‘**’ 0.01 ‘*’ 0.05 ‘.’ 0.1 ‘ ’ 1
Residual standard error: 0.1089 on 41 degrees of freedom
Multiple R-squared: 0.2233, Adjusted R-squared: 0.2043
F-statistic: 11.78 on 1 and 41 DF, p-value: 0.001378
The parasite weight affects the Weight of the Liver; (F-statistic: 11.78 on 1 and 41
DF, p-value: 0.001378)
c) 3.71g
R code attach(`472901154_Data3..Stick`)
plot(ParasiteWeight, LiverWeight, main =
"scatterplot")
Regression <- lm(ParasiteWeight ~
LiverWeight, data =
`472901154_Data3..Stick`)
summary(Regression)
Frequency Analysis of Regenerate Vegetative or by Seed and Cross-Classified Plant Species_3

End of preview

Want to access all the pages? Upload your documents or become a member.

Related Documents
Model parameter are tested for statistical
|14
|3949
|14

Linear Regression and Correlation Analysis Assignment
|13
|1372
|109

Model 1 Call: lm(formula = age ~ proportion.black) Residuals:
|2
|151
|260

Data Analysis: Assignment
|16
|2057
|325

Data Analysis Project for Desklib
|9
|2087
|218

Analyzing Registered and Casual Users: Linear Regression, T-Test, and ANOVA Results
|7
|970
|418