DATA 25: Comparative Analysis of Classification Models in Data Mining
VerifiedAdded on 2022/09/28
|25
|1821
|23
Report
AI Summary
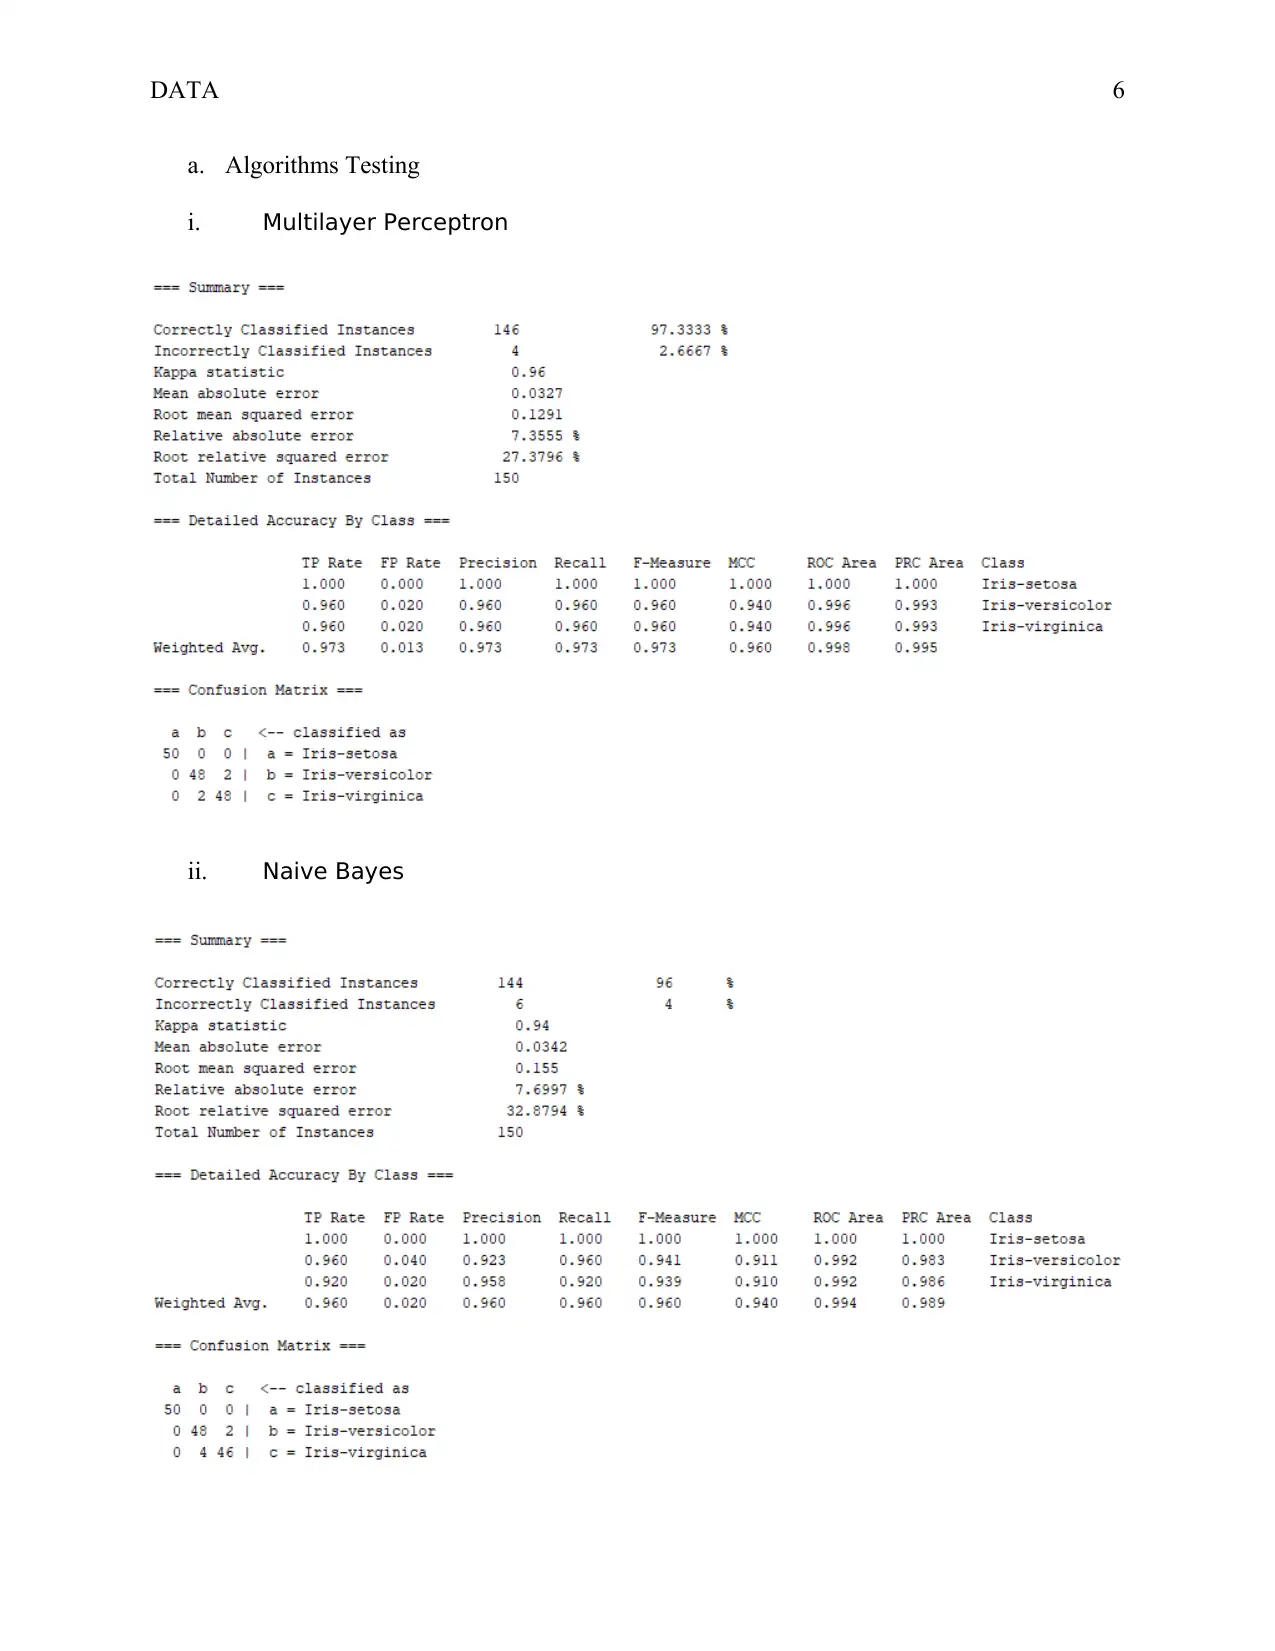
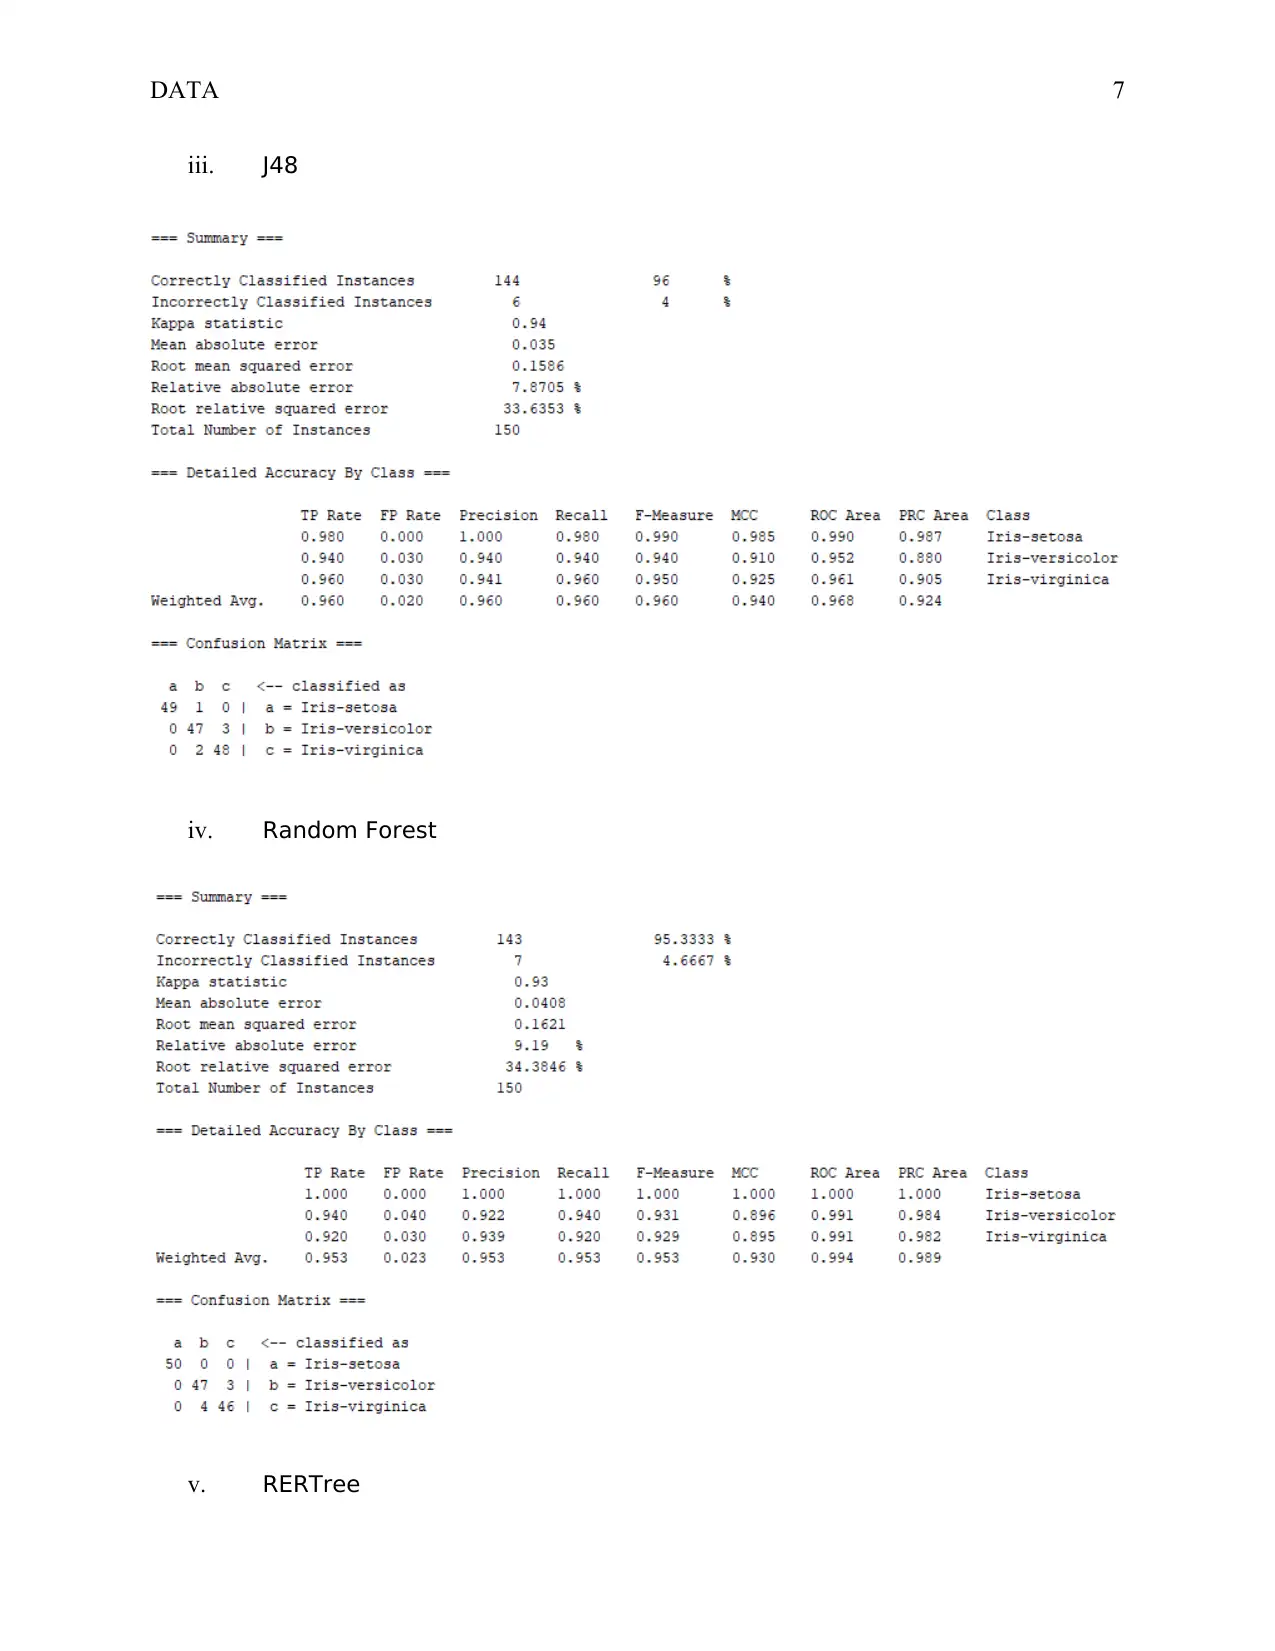
This report, created for DATA 25, provides a comparative analysis of five classification algorithms: Multilayer Perceptron, Naive Bayes, J48, Random Forest, and REPtree. The algorithms were tested on three datasets: Iris, Breast Cancer, and Diabetes, using the Weka data mining tool. The report includes descriptive statistics, graphical representations, and performance evaluations based on 10-fold cross-validation, focusing on classification accuracy and confusion matrices. Task 2 explores data mining applications, discussing its role in business decision-making, customer relationships, and product development, including a case study on the development of electric cars. The report also outlines the stages of data mining, from data source to deployment, and highlights key parameters like classification, sequence analysis, clustering, and forecasting. References to relevant literature are also included.

1 out of 25
Related Documents


Your All-in-One AI-Powered Toolkit for Academic Success.
+13062052269
info@desklib.com
Available 24*7 on WhatsApp / Email
![[object Object]](/_next/static/media/star-bottom.7253800d.svg)
Copyright © 2020–2026 A2Z Services. All Rights Reserved. Developed and managed by ZUCOL.