Analysis of Alcohol Consumption Trends and Health Impact in the UK
VerifiedAdded on 2023/01/19
|1
|745
|48
Report
AI Summary
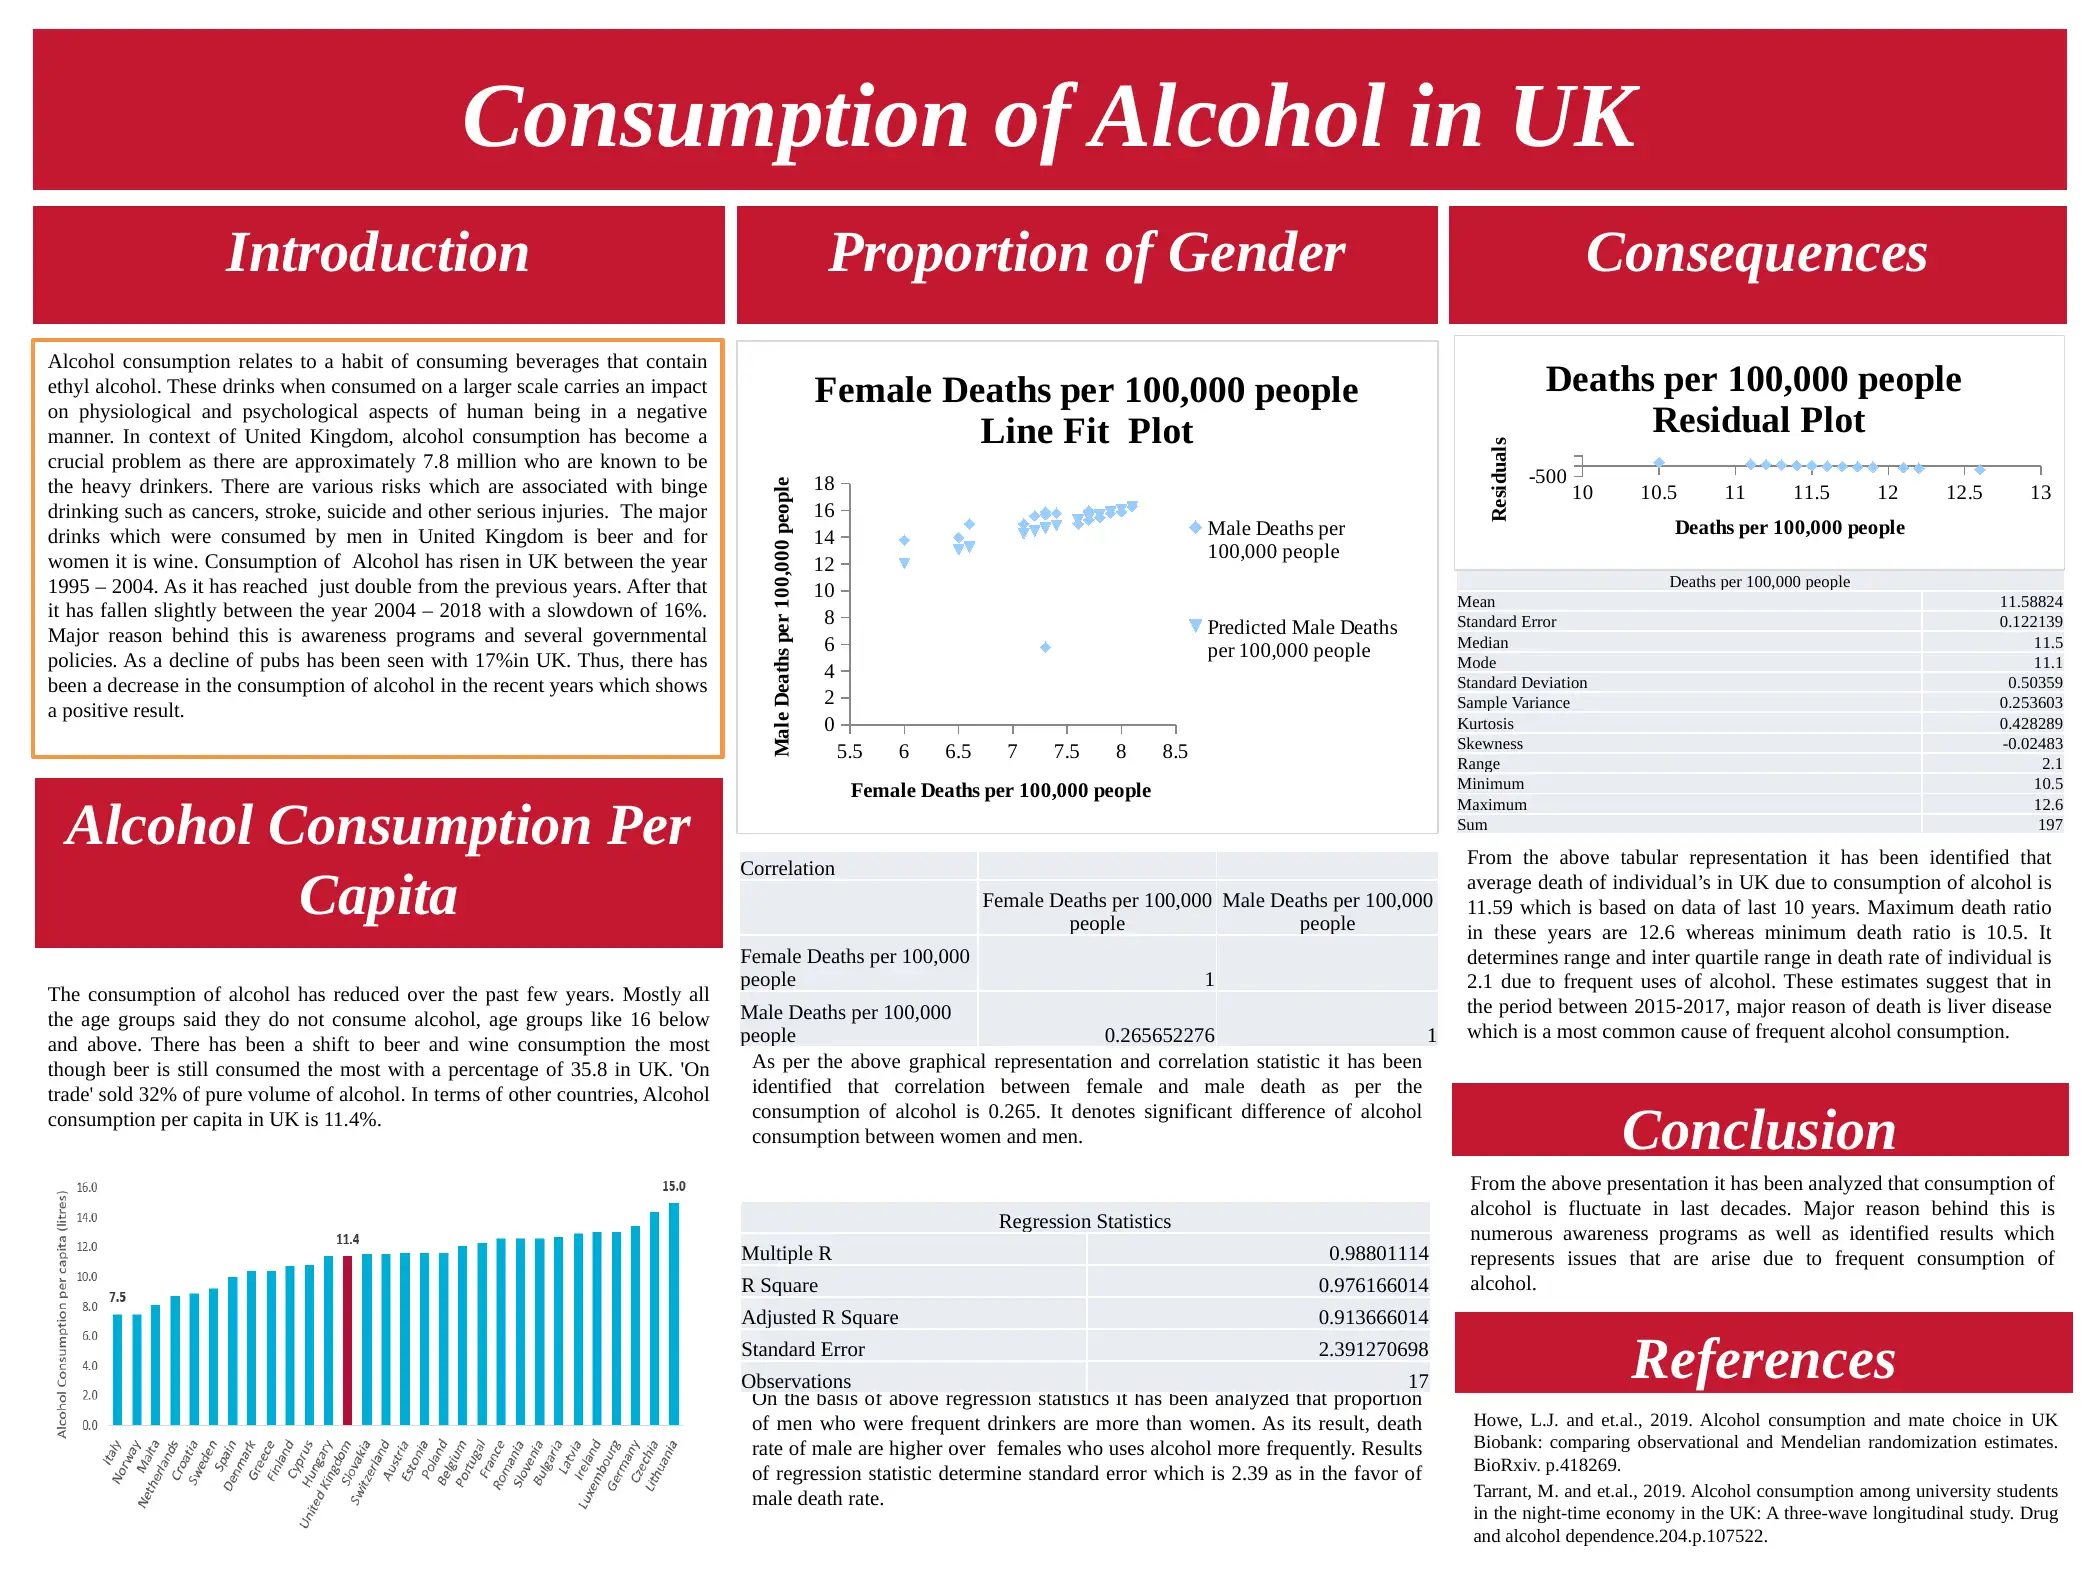
This report examines alcohol consumption trends in the United Kingdom, highlighting a recent decrease in overall consumption despite fluctuations over the past few decades. The analysis reveals shifts in preferred beverages, with beer and wine being popular choices, while also providing statistics on gender disparities in alcohol-related deaths. The report utilizes graphical representations, correlation statistics, and regression analysis to illustrate the impact of alcohol consumption on public health, including the risks associated with binge drinking. Key findings include the correlation between male and female deaths, the identification of liver disease as a major cause of alcohol-related mortality, and the influence of awareness programs and governmental policies on consumption patterns. The report concludes by summarizing the trends and emphasizing the importance of addressing the public health issues related to alcohol consumption in the UK, supported by references to relevant research.
Related Documents


Your All-in-One AI-Powered Toolkit for Academic Success.
+13062052269
info@desklib.com
Available 24*7 on WhatsApp / Email
![[object Object]](/_next/static/media/star-bottom.7253800d.svg)
Copyright © 2020–2025 A2Z Services. All Rights Reserved. Developed and managed by ZUCOL.