Statistics Assignment: Problem Analysis
Added on 2020-05-28
35 Pages10020 Words44 Views
Problem Analysis and StatisticsName of the Student:Name of the University:Author’s note:

PROBLEM ANALYSIS AND STATISTICSTable of Contents1. Section 1: Introduction............................................................................................................................................................................3a) Brief introduction about the assignment:.............................................................................................................................................3b) Dataset 1:............................................................................................................................................................................................3c) Dataset 2:.............................................................................................................................................................................................32. Section 2: Lodgement Method-Dataset 1...............................................................................................................................................3A) Part a...................................................................................................................................................................................................3B) Part b...................................................................................................................................................................................................4C) Part c...................................................................................................................................................................................................43. Section 3: Lodgement Method-Dataset2.................................................................................................................................................4A) Part a...................................................................................................................................................................................................4B) Part b...................................................................................................................................................................................................5C) Part c...................................................................................................................................................................................................54. Section 4: Lodgement Method and Age group-Dataset1:.......................................................................................................................6A) Part a...................................................................................................................................................................................................6B) Part b.................................................................................................................................................................................................10C) Part c.................................................................................................................................................................................................115. Section 5: Lodgement Method and Total Income Amount-Dataset1:...................................................................................................11A) Part a.................................................................................................................................................................................................11B) Part b.................................................................................................................................................................................................136. Section 6: Total Income Amount and Deduction Amount-Data set 1:..................................................................................................16A) Part a.................................................................................................................................................................................................16B) Part b.................................................................................................................................................................................................19Correlation:........................................................................................................................................................................................19Regression:........................................................................................................................................................................................197. Section7: Conclusion.............................................................................................................................................................................20A) Part a.................................................................................................................................................................................................20B) Part b: Further Research...................................................................................................................................................................20References:................................................................................................................................................................................................21Appendices:...............................................................................................................................................................................................22Dataset 1:...............................................................................................................................................................................................22Dataset 2:...............................................................................................................................................................................................36
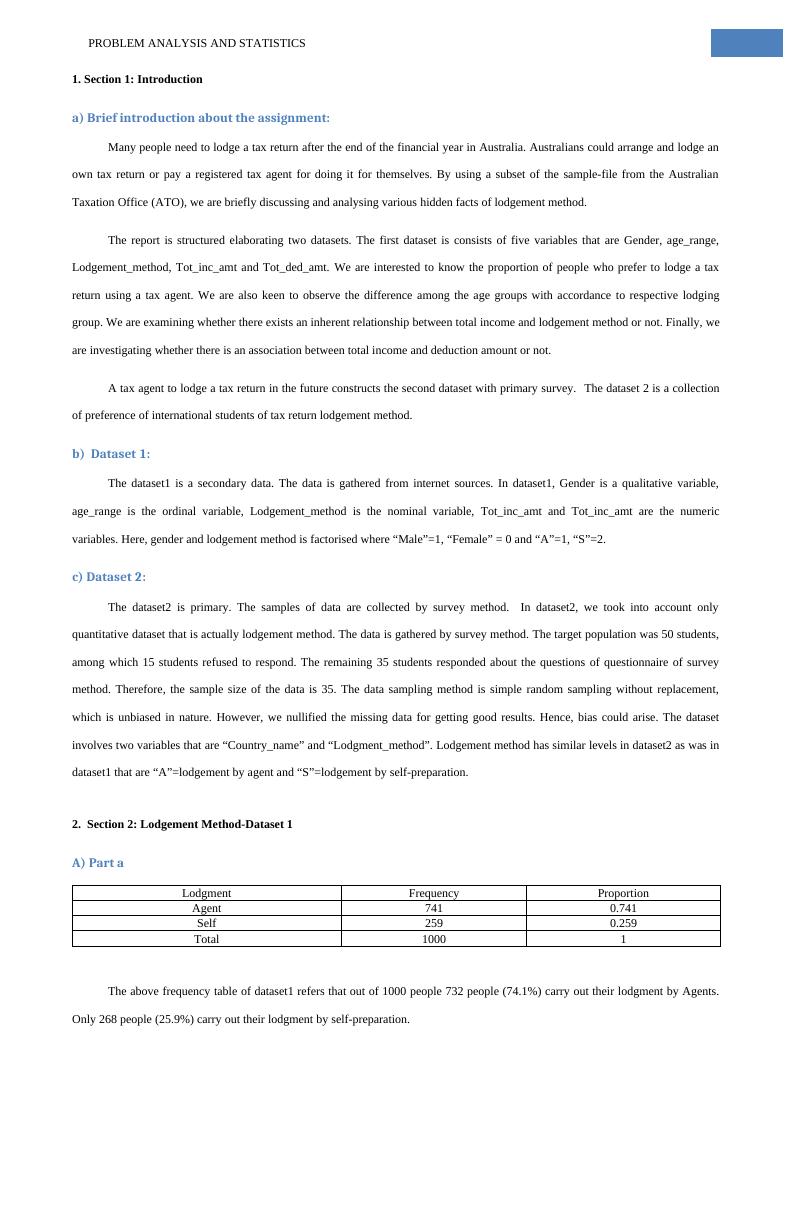
PROBLEM ANALYSIS AND STATISTICS1. Section 1: Introductiona) Brief introduction about the assignment:Many people need to lodge a tax return after the end of the financial year in Australia. Australians could arrange and lodge anown tax return or pay a registered tax agent for doing it for themselves. By using a subset of the sample-file from the AustralianTaxation Office (ATO), we are briefly discussing and analysing various hidden facts of lodgement method. The report is structured elaborating two datasets. The first dataset is consists of five variables that are Gender, age_range,Lodgement_method, Tot_inc_amt and Tot_ded_amt. We are interested to know the proportion of people who prefer to lodge a taxreturn using a tax agent. We are also keen to observe the difference among the age groups with accordance to respective lodginggroup. We are examining whether there exists an inherent relationship between total income and lodgement method or not. Finally, weare investigating whether there is an association between total income and deduction amount or not. A tax agent to lodge a tax return in the future constructs the second dataset with primary survey. The dataset 2 is a collectionof preference of international students of tax return lodgement method. b) Dataset 1:The dataset1 is a secondary data. The data is gathered from internet sources. In dataset1, Gender is a qualitative variable,age_range is the ordinal variable, Lodgement_method is the nominal variable, Tot_inc_amt and Tot_inc_amt are the numericvariables. Here, gender and lodgement method is factorised where “Male”=1, “Female” = 0 and “A”=1, “S”=2.c) Dataset 2:The dataset2 is primary. The samples of data are collected by survey method. In dataset2, we took into account onlyquantitative dataset that is actually lodgement method. The data is gathered by survey method. The target population was 50 students,among which 15 students refused to respond. The remaining 35 students responded about the questions of questionnaire of surveymethod. Therefore, the sample size of the data is 35. The data sampling method is simple random sampling without replacement,which is unbiased in nature. However, we nullified the missing data for getting good results. Hence, bias could arise. The datasetinvolves two variables that are “Country_name” and “Lodgment_method”. Lodgement method has similar levels in dataset2 as was indataset1 that are “A”=lodgement by agent and “S”=lodgement by self-preparation. 2. Section 2: Lodgement Method-Dataset 1A) Part aLodgmentFrequencyProportionAgent7410.741Self2590.259Total 10001The above frequency table of dataset1 refers that out of 1000 people 732 people (74.1%) carry out their lodgment by Agents.Only 268 people (25.9%) carry out their lodgment by self-preparation.
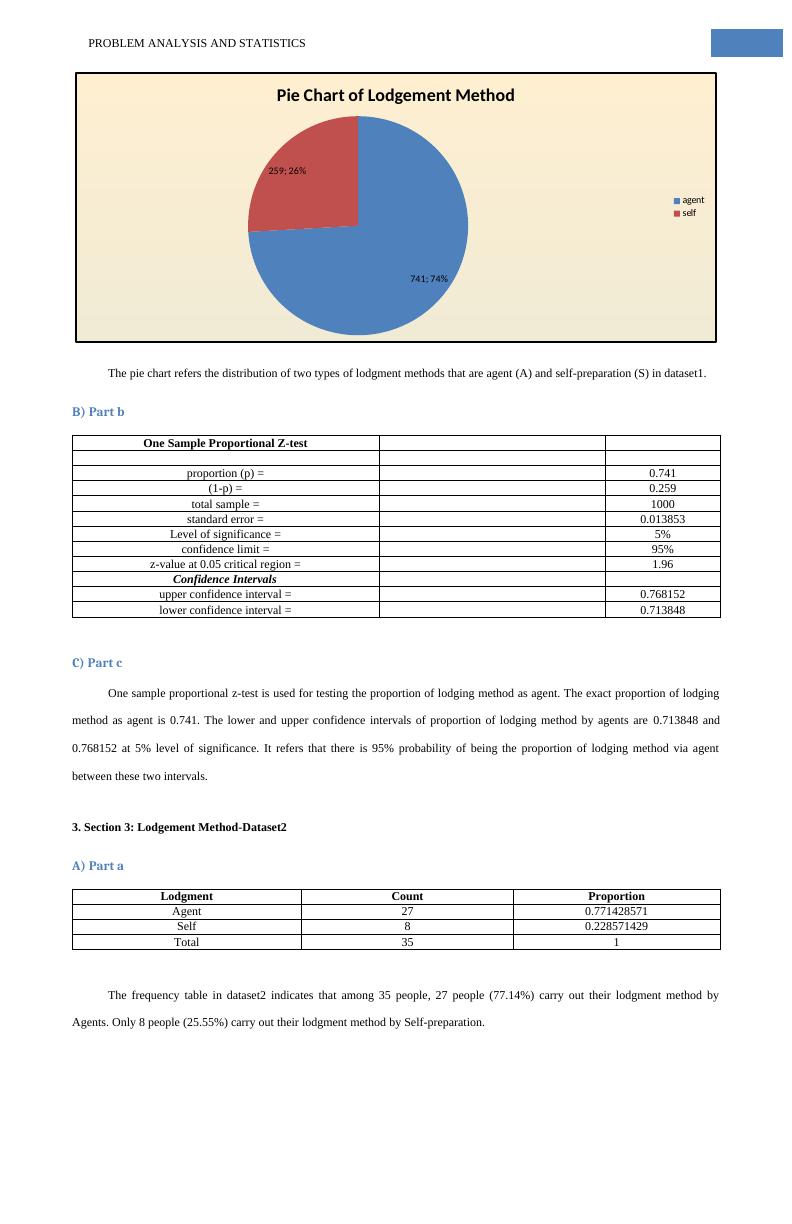
PROBLEM ANALYSIS AND STATISTICS741; 74%259; 26%Pie Chart of Lodgement Methodagent self The pie chart refers the distribution of two types of lodgment methods that are agent (A) and self-preparation (S) in dataset1.B) Part bOne Sample Proportional Z-testproportion (p) =0.741(1-p) =0.259total sample =1000standard error =0.013853Level of significance =5%confidence limit =95%z-value at 0.05 critical region =1.96Confidence Intervalsupper confidence interval =0.768152lower confidence interval =0.713848C) Part cOne sample proportional z-test is used for testing the proportion of lodging method as agent. The exact proportion of lodgingmethod as agent is 0.741. The lower and upper confidence intervals of proportion of lodging method by agents are 0.713848 and0.768152 at 5% level of significance. It refers that there is 95% probability of being the proportion of lodging method via agentbetween these two intervals.3. Section 3: Lodgement Method-Dataset2A) Part aLodgmentCountProportionAgent270.771428571Self80.228571429Total351The frequency table in dataset2 indicates that among 35 people, 27 people (77.14%) carry out their lodgment method byAgents. Only 8 people (25.55%) carry out their lodgment method by Self-preparation.
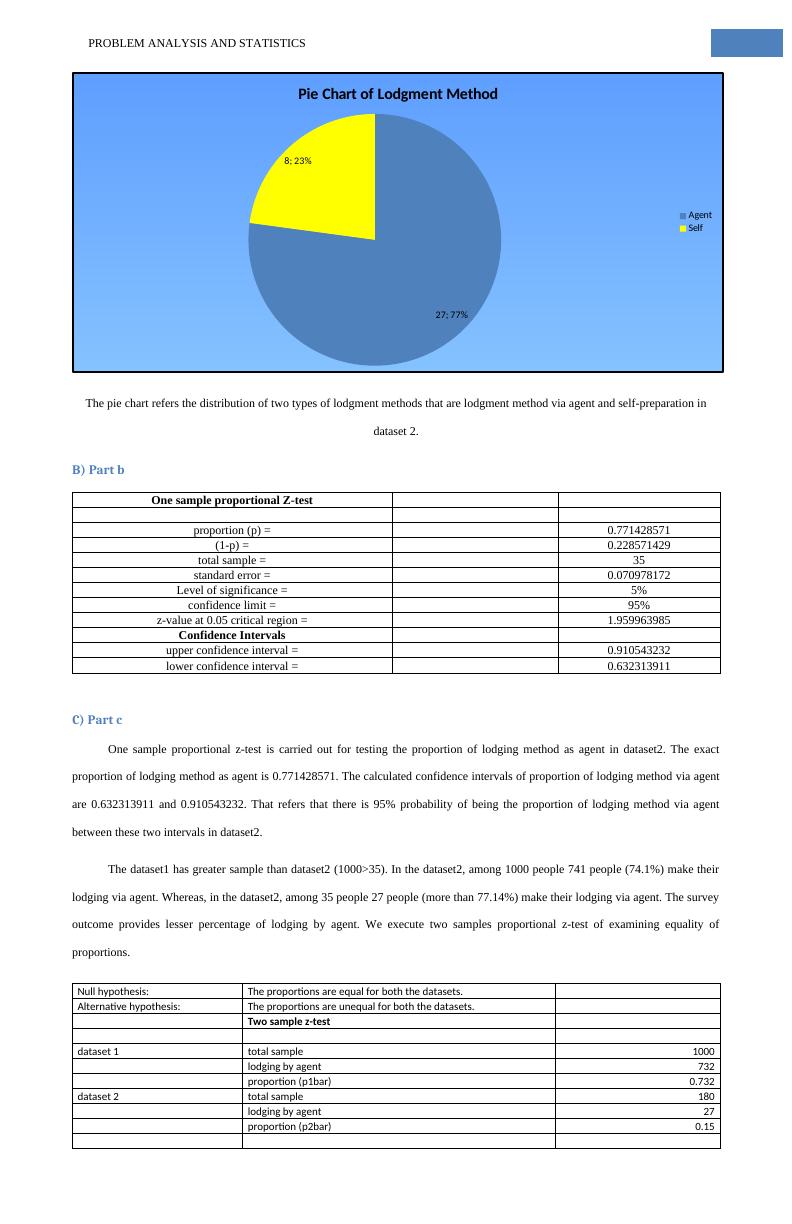
PROBLEM ANALYSIS AND STATISTICS27; 77%8; 23%Pie Chart of Lodgment MethodAgent Self The pie chart refers the distribution of two types of lodgment methods that are lodgment method via agent and self-preparation indataset 2.B) Part bOne sample proportional Z-testproportion (p) =0.771428571(1-p) =0.228571429total sample =35standard error =0.070978172Level of significance =5%confidence limit =95%z-value at 0.05 critical region =1.959963985Confidence Intervalsupper confidence interval =0.910543232lower confidence interval =0.632313911C) Part cOne sample proportional z-test is carried out for testing the proportion of lodging method as agent in dataset2. The exactproportion of lodging method as agent is 0.771428571. The calculated confidence intervals of proportion of lodging method via agentare 0.632313911 and 0.910543232. That refers that there is 95% probability of being the proportion of lodging method via agentbetween these two intervals in dataset2.The dataset1 has greater sample than dataset2 (1000>35). In the dataset2, among 1000 people 741 people (74.1%) make theirlodging via agent. Whereas, in the dataset2, among 35 people 27 people (more than 77.14%) make their lodging via agent. The surveyoutcome provides lesser percentage of lodging by agent. We execute two samples proportional z-test of examining equality ofproportions. Null hypothesis:The proportions are equal for both the datasets.Alternative hypothesis:The proportions are unequal for both the datasets.Two sample z-testdataset 1total sample1000lodging by agent732proportion (p1bar)0.732dataset 2total sample180lodging by agent27proportion (p2bar)0.15
PROBLEM ANALYSIS AND STATISTICStotal sample1180total lodging by agent759total proportion (p-bar)0.643220339numerator of z-statistic(p1bar - p2bar)0.582pbar* (1-pbar)0.229487935propotion*sample0.001504421denominator of z-statisticSQRT(proprtion*sample)0.038786865z-statistic15.00507965p-value0.15386Decision-makingNull hypothesis acceptedThe two samples z-test for testing the equality of means is applied for testing the equality of proportions (Cleophas, Ton andAeilko, 2016). The calculated z-statistic is 15.00507965. According to the calculated p-value (0.15386), we accept the null hypothesis at95% confidence interval. Hence, there is 95% probability of being the proportions of lodgment method of two datasets equal. 4. Section 4: Lodgement Method and Age group-Dataset1:A) Part aCorrelation Coefficientage_rangeLodgment_methodage_range1Lodgment_method0.1164403481The Pearson correlation coefficient is 0.116440348. Therefore, the correlation coefficient between age range and lodgmentmethod is insignificant. Hence, we can say that the amount of age range and lodgment method is uncorrelated to each other. Forcalculating the correlation coefficient, we transformed “agent” as 1 and “self” as 2 for making qualitative variable quantitativevariable.Lodging Method is Self:Numerical Summaryage_rangeMean6.49034749Standard Error0.204288151Median7Mode9Standard Deviation3.287706647Sample Variance10.809015Kurtosis-0.859560778Skewness-0.589364603Range11Minimum0Maximum11Sum1681Count259Largest(1)11Smallest(1)0Confidence Level (95.0%)0.402284498upper confidence limit6.890752266lower confidence limit6.089942714
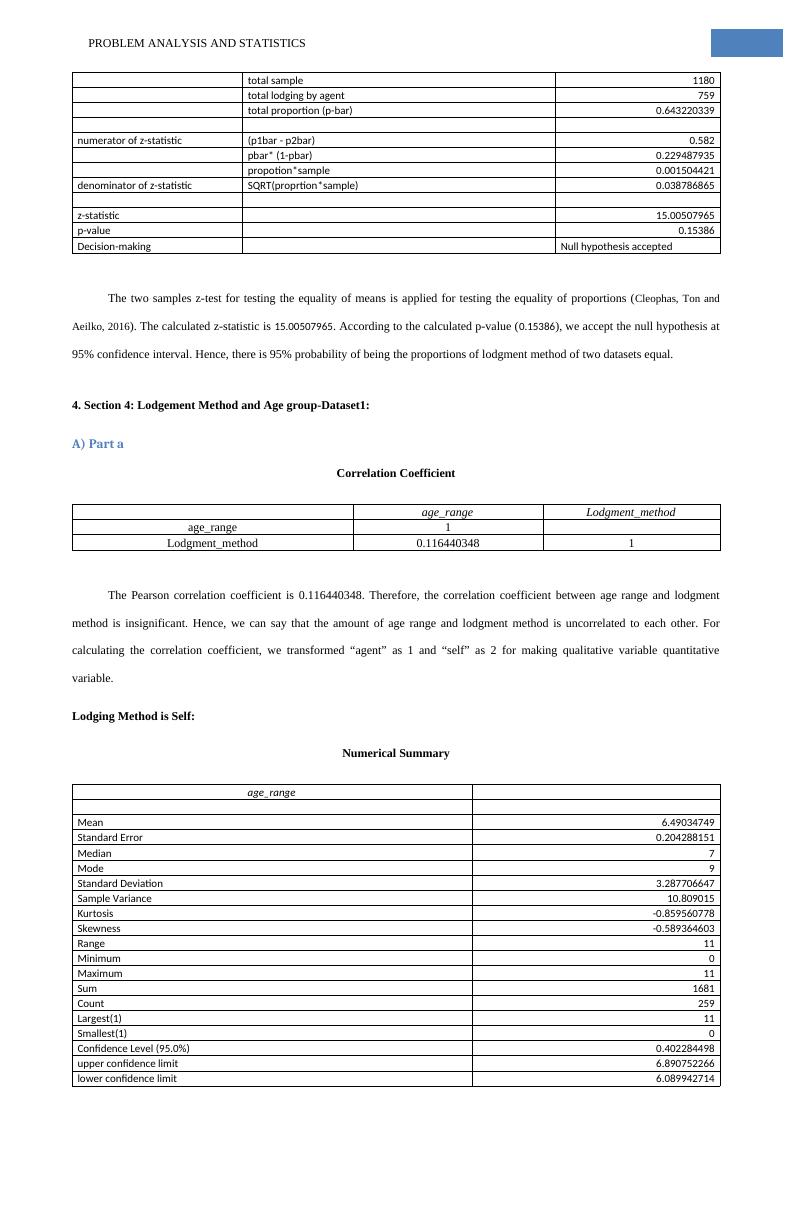
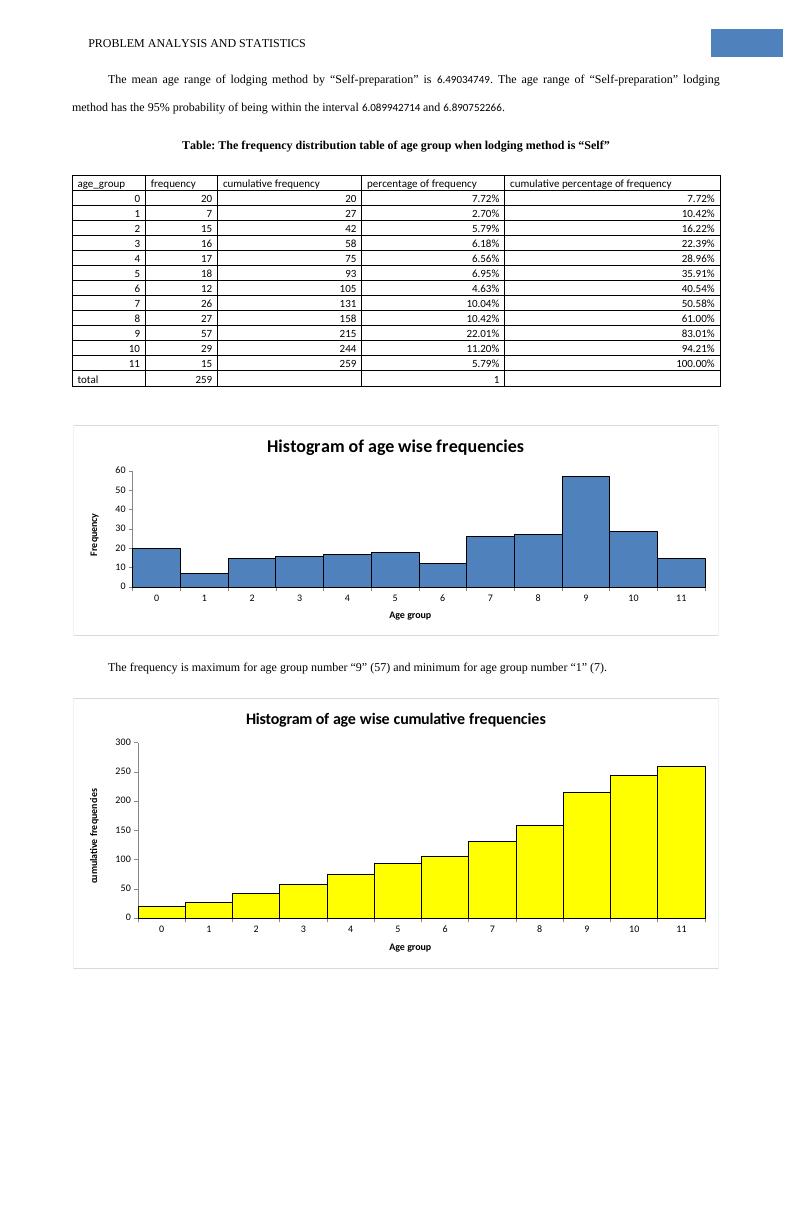
PROBLEM ANALYSIS AND STATISTICSThe mean age range of lodging method by “Self-preparation” is 6.49034749. The age range of “Self-preparation” lodgingmethod has the 95% probability of being within the interval 6.089942714 and 6.890752266.Table: The frequency distribution table of age group when lodging method is “Self”age_groupfrequencycumulative frequencypercentage of frequencycumulative percentage of frequency020207.72%7.72%17272.70%10.42%215425.79%16.22%316586.18%22.39%417756.56%28.96%518936.95%35.91%6121054.63%40.54%72613110.04%50.58%82715810.42%61.00%95721522.01%83.01%102924411.20%94.21%11152595.79%100.00%total2591012345678910110102030405060Histogram of age wise frequenciesAge groupFrequencyThe frequency is maximum for age group number “9” (57) and minimum for age group number “1” (7).01234567891011050100150200250300Histogram of age wise cumulative frequenciesAge groupcumulativefrequencies
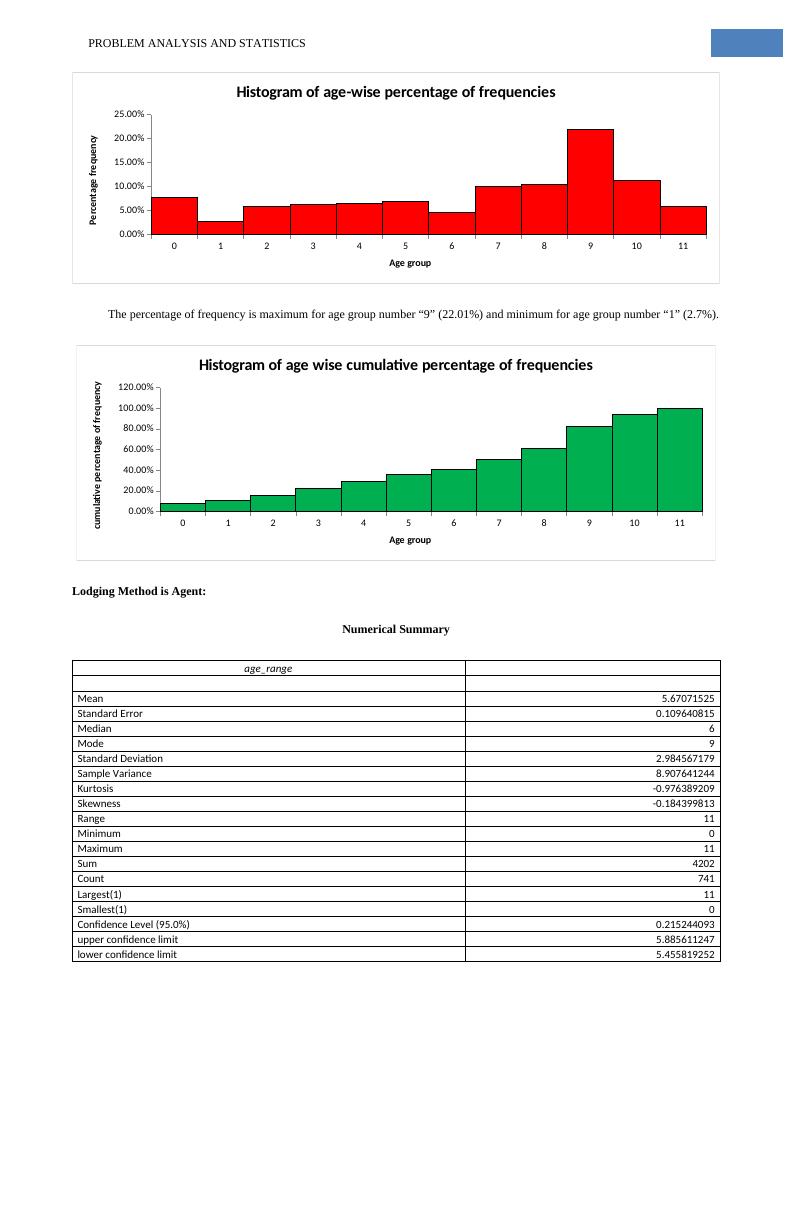
PROBLEM ANALYSIS AND STATISTICS012345678910110.00%5.00%10.00%15.00%20.00%25.00%Histogram of age-wise percentage of frequenciesAge groupPercentagefrequencyThe percentage of frequency is maximum for age group number “9” (22.01%) and minimum for age group number “1” (2.7%).012345678910110.00%20.00%40.00%60.00%80.00%100.00%120.00%Histogram of age wise cumulative percentage of frequenciesAge groupcumulativepercentageoffrequencyLodging Method is Agent:Numerical Summaryage_rangeMean5.67071525Standard Error0.109640815Median6Mode9Standard Deviation2.984567179Sample Variance8.907641244Kurtosis-0.976389209Skewness-0.184399813Range11Minimum0Maximum11Sum4202Count741Largest(1)11Smallest(1)0Confidence Level (95.0%)0.215244093upper confidence limit5.885611247lower confidence limit5.455819252
End of preview
Want to access all the pages? Upload your documents or become a member.
Related Documents
Statistics Assignment- Problem Analysislg...
|35
|10898
|40
Taxation Assignment | Statistics Data Assignmentlg...
|9
|3085
|40
BUS708 Statistics and Data Analysis Name of the University Authorlg...
|13
|2322
|237
Article on Analysis of Individual Tax Returnlg...
|11
|3472
|61
BUS708 Statistics and Data Analysis : Assignmentlg...
|11
|1933
|211
BUS708 - Statistics and Data Analysislg...
|16
|2432
|58