Article on Analysis of Individual Tax Return
Added on 2020-05-16
11 Pages3472 Words61 Views
Section 1:a. The provided dataset is a sample of 2013 -2014 of Australian taxation office which indicates thelodge tax return of lodgment method. The lodgment method is either a tax agent or self-prepare, the people pay tax by using one of the lodgment method, either they select a tax agentor self-prepare to pay tax for a financial year. The assignment is based on the analysis oflodgment method for gender and different age groups. The article is based on the analysis ofinformation of individual tax return after the end of the financial year. b.There are two types of data which can be used for analysis, first is Primary data, which candirectly have collected from the customers of the organization on the basis of questionnaire.And other is Secondarydata, which can have collected from official website of the organizationand also from other official websites related to organization. (Goodwin, 2012, p.130). Thedataset 1 is a subset of Australian taxation office collected from official website of the ATO. Thedata is collected by a government site not by the specific user, so it is a secondary data type. Thedata can be categorized as qualitative or quantitative, the qualitative data can be furthercategorized as binary level, nominal level or the ordinal level of measurements and thequantitative data can be further categorized as interval or ratio level measurements. (Morgan,2013, p.9). The variable gender has two categories (0=male and 1=female), so it is a nominallevel of variable, it indicates the gender of a tax payer. The variable age_range contains integer values, so it is a quantitative variable. It indicates theage of a tax payer. The variable lodgment_method have two categories (A=Tax agent and B=Self prepare), so it is anominal level of variable, it indicates the lodgment category of a tax payer. The variable tot_in_amt contains integer values, so it is a quantitative variable. It indicates thetotal income amount of a tax payer in which a tax payer will pay tax. The variable tot_ded_amt contains integer values, so it is a quantitative variable. It indicates thetotal deduction amount of a tax payer. It is an amount of total deduction in the actual incomeamount as a tax. The first five cases of dataset 1 is sown below:Genderage_rangeLodgment_methodTot_inc_amtTot_ded_amt05A49612818406A131313768616S53320120109S567489516A848632016c. Statistical methods basically a process of collection, summarizing, analysis and the interpretationof the analysis. Making questionnaire on the basis of the importance of factors of the study ofthe organization. The characteristics of the study will contain, a specific plan, design structure toget the answers from the respondents.The questionnaire will contain the questions related tothe open ended, closed ended, and the nominal, ordinal and interval level ratio variables. Theanalysis of the collected data from the questionnaire will indicate the strength, weakness,opportunities and threats of the factors of the study. The statistical data will indicate asummary statistic of the analysis, which will contain the graphical representation of each factor,
numerical summary of each factor and the final principal components of the study. (Brace,2008, p.45).The procedure of the data collection and analysis can be derived as follows: a. Topic selection: - Scale should not be wide are level of measurement should be accurate. b. Determination of hypothesis: - it includes the objective of the study. c. Sampling method: - Selecting an appropriate sampling method related to the study. d. Data collection: - Data should be collected through direct interview or by other similarcompanies’ data. e. Data handling: - Coding and putting the responses in to level of measurements. f. Statistical Analysis: -It includes the appropriate statistical model for the analysis. i. Gathering of results: - It includes the graphical and numerical representation of the data. j. Conclusions: - Determine the findings related to the hypothesis of the study. (Bethlehem,2009, p.1). In the process of collection of dataset 2, I have collected the data for the 503individuals of by using a survey. The sampling process involved to calculate the representativesample size of the population. The sample size for this survey was considered as 503. Thus, alarge sample will be a representative of the population, it will indicate the unbiased results ofthe study, also the method of data collection will unbiased. It is a primary data, which is directlycollected from the respondents on the basis of questionnaire.The survey includes following variables: 1. Gender: It indicates the gender of an individual (0=male and 1=female). It is a nominal level ofvariable. 2. Age: It indicates the age of respondent, which contains integer values.3. Lodgment method: it indicates the preference of method as “A=Tax agent” or “B=Selfprepare”. 4. Total income amount: It indicates the he total income of a respondent in a financial year. 5. Total deduction amount: It indicates the total deduction amount of a tax payer from actualincome amount as a tax in a financial year. Section 2:a. The variable lodgment method is a qualitative variable which have two categories as “A=Taxagent” or “B=Self prepare”. So, a pie chart will be suitable for lodgment method, thepercentage of frequencies for each type of preference of lodgment method is shown below: 74%26%AgentSelf Prepared
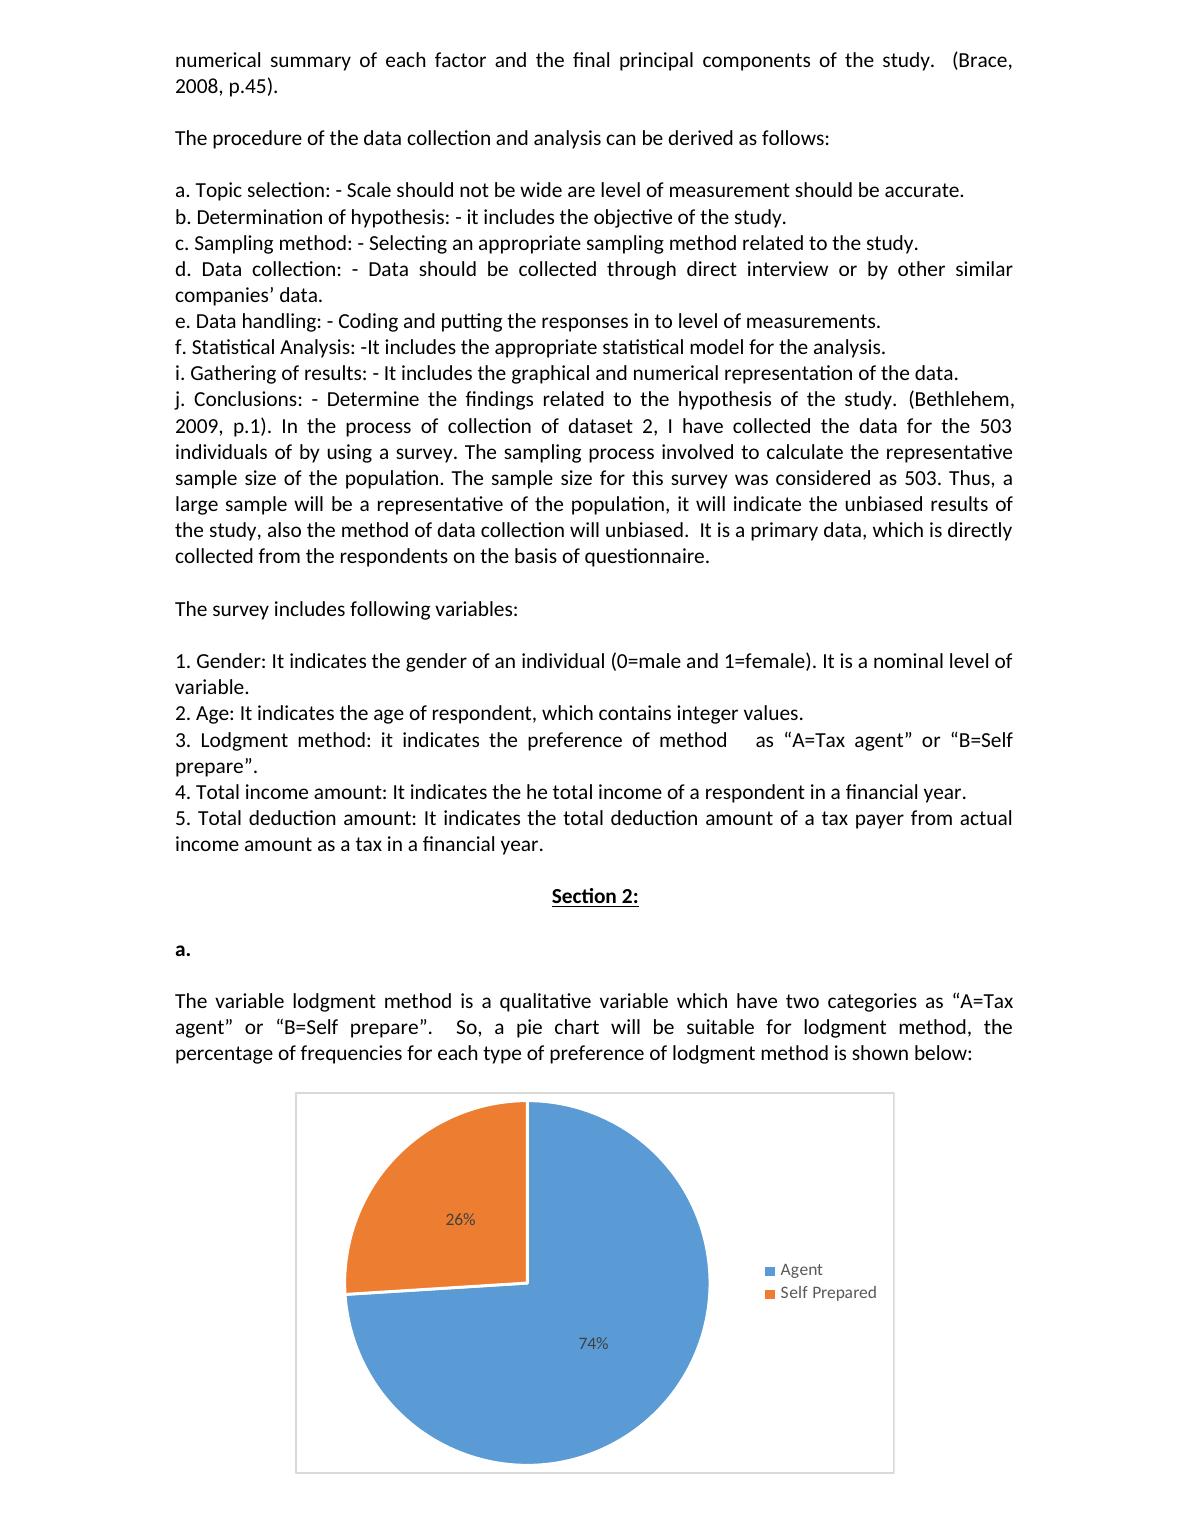
So, the number of people who hire tax agent to pay tax are 740 and the number of people whopays tax by self-preparation are 260. b. The sample size is 1000 and 740 people hired a tax agent to pay tax. The sample proportion p isa point estimate of the population proportion. So, the point estimate for p for the proportion is:740ˆ10000.74pNow use Z-statistic to calculate the 95% confidence interval, the formula to 95% confidenceinterval is shown below: *ˆˆ(1)ˆpppZnHere, ˆpis the sample proportion, n is the sample size and Z is the critical value at a specifiedlevel of significance. The critical value at 5% level of significance is 1.96. So, the confidence iscalculated as:0.74 1 0.740.74 1 0.740.74 1.96, 0.74 1.96100010000.74 0.0272, 0.74 0.02720.712, 0.767Hence, the 95% confidenceintervaloftheproportionoftaxpayerswholodgethetaxreturnbyusinganAgent is (0.712, 0.767).c. The lower limit of the confidence interval is 0.712 and the upper limit is 0.767. The confidenceinterval contains the sample proportion value (0.74), so it can say that sample of 1000 people isa representative of the population. Section 3:a. The variable lodgment method is a qualitative variable which have two categories as “A=Taxagent” or “B=Self prepare”. So, a pie chart will be suitable for lodgment method, thepercentage of frequencies for each type of preference of lodgment method is shown below:
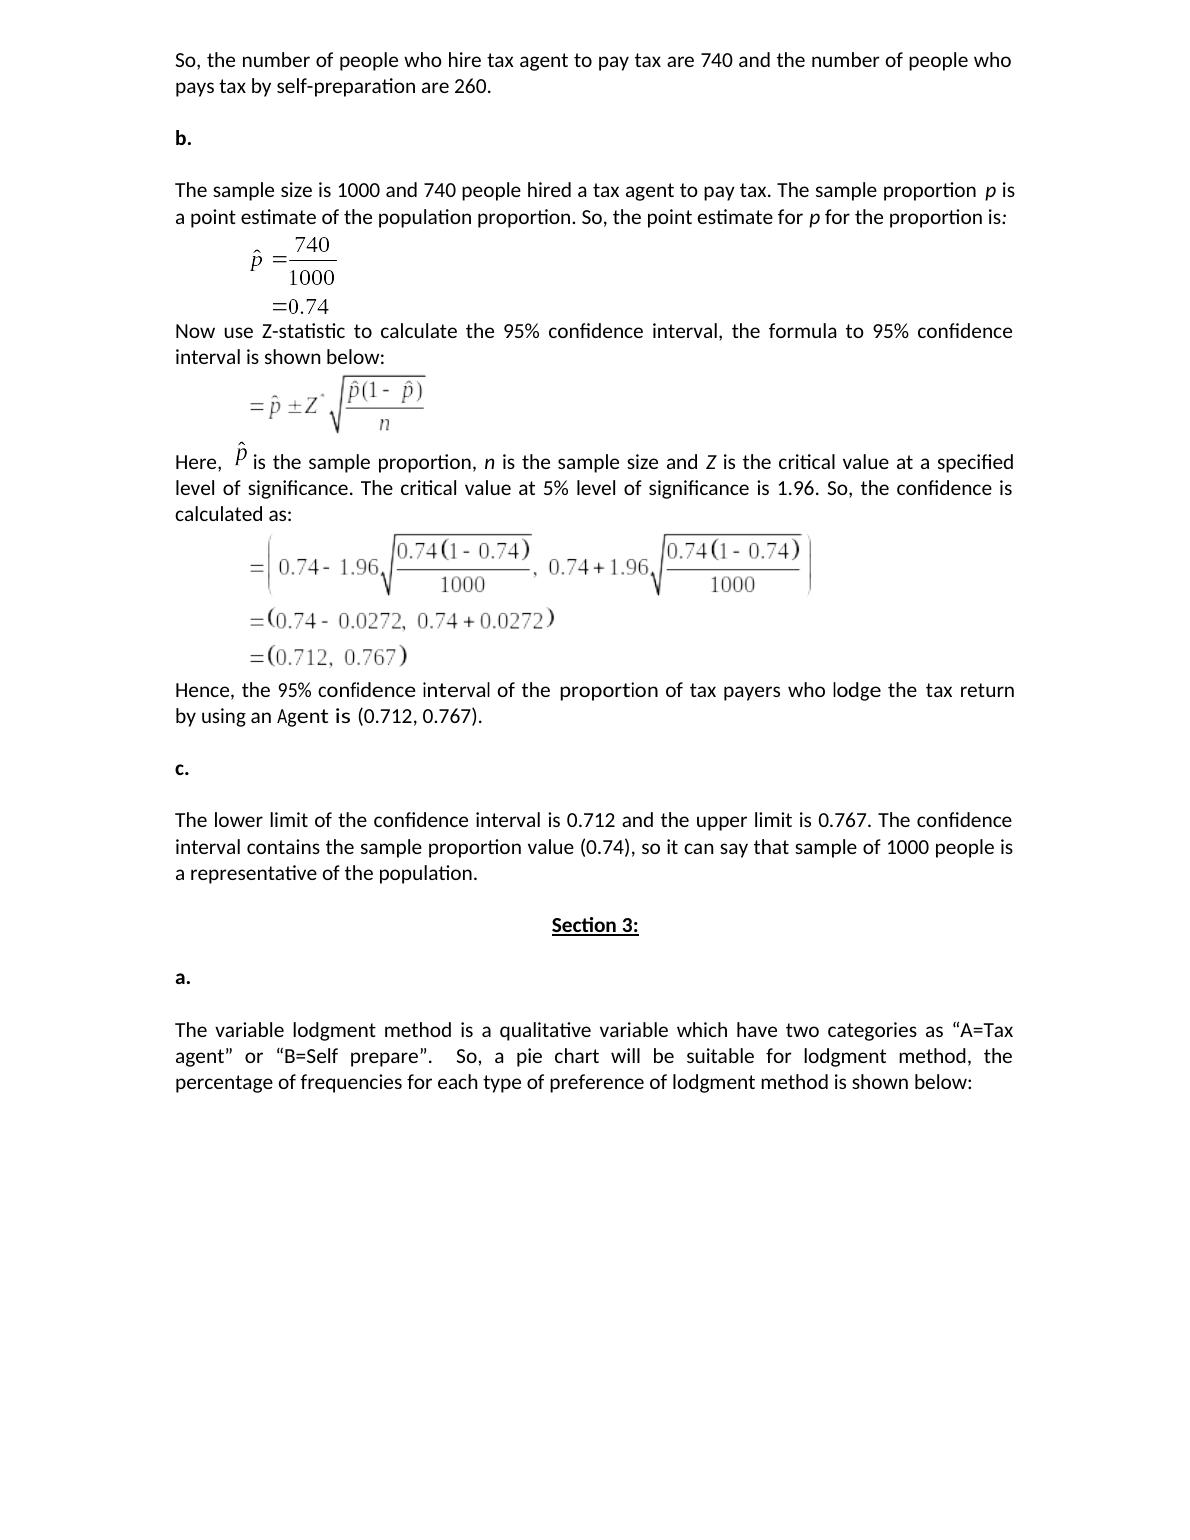
49%51%AgentSelf PreparedSo, the number of people who hire tax agent to pay tax are 245 and the number of people whopays tax by self-preparation are 258. b. The sample size is 245 and 500 people hired a tax agent to pay tax. The sample proportion p is apoint estimate of the population proportion. So, the point estimate for p for the proportion is:245ˆ5030.487pNow use Z-statistic to calculate the 95% confidence interval, the formula to 95% confidenceinterval is shown below: *ˆˆ(1)ˆpppZnHere, ˆpis the sample proportion, n is the sample size and Z is the critical value at a specifiedlevel of significance. The critical value at 5% level of significance is 1.96. So, the confidence iscalculated as:0.487 1 0.4870.487 1 0.4870.487 1.96, 0.487 1.965035030.487 0.0436, 0.487 0.04360.443, 0.530Hence, the 95% confidenceintervaloftheproportionoftaxpayerswholodgethetaxreturnbyusinganAgent is (0.443, 0.530). c.The lower limit of the confidence interval is 0.443 and the upper limit is 0.530. The confidenceinterval contains the sample proportion value (48.7%), so it can say that sample of 503 people isa representative of the population. Thus, the people who prefer to hire tax agent in dataset 1 is greater than the people who preferhire tax agent in dataset 2. So, dataset 2 indicates almost equal number of persons prefer to hiretax agent or self-preparation to pay the tax while dataset 1 indicates most of the persons preferto hire tax agent than self-preparation to pay the tax. Section 4:
End of preview
Want to access all the pages? Upload your documents or become a member.
Related Documents
Taxation Assignment | Statistics Data Assignmentlg...
|9
|3085
|40
Statistics Assignment: Problem Analysislg...
|35
|10020
|44
Statistics Assignment- Problem Analysislg...
|35
|10898
|40
BUS708 Statistics and Data Analysis Name of the University Authorlg...
|13
|2322
|237
Data Analysis: Statistical Assignmentlg...
|11
|1604
|109
Statistics and Data Analysislg...
|15
|2365
|38