Project Management: Supply Chain ERP Module Development Report
VerifiedAdded on 2021/10/29
|21
|2302
|40
Project
AI Summary
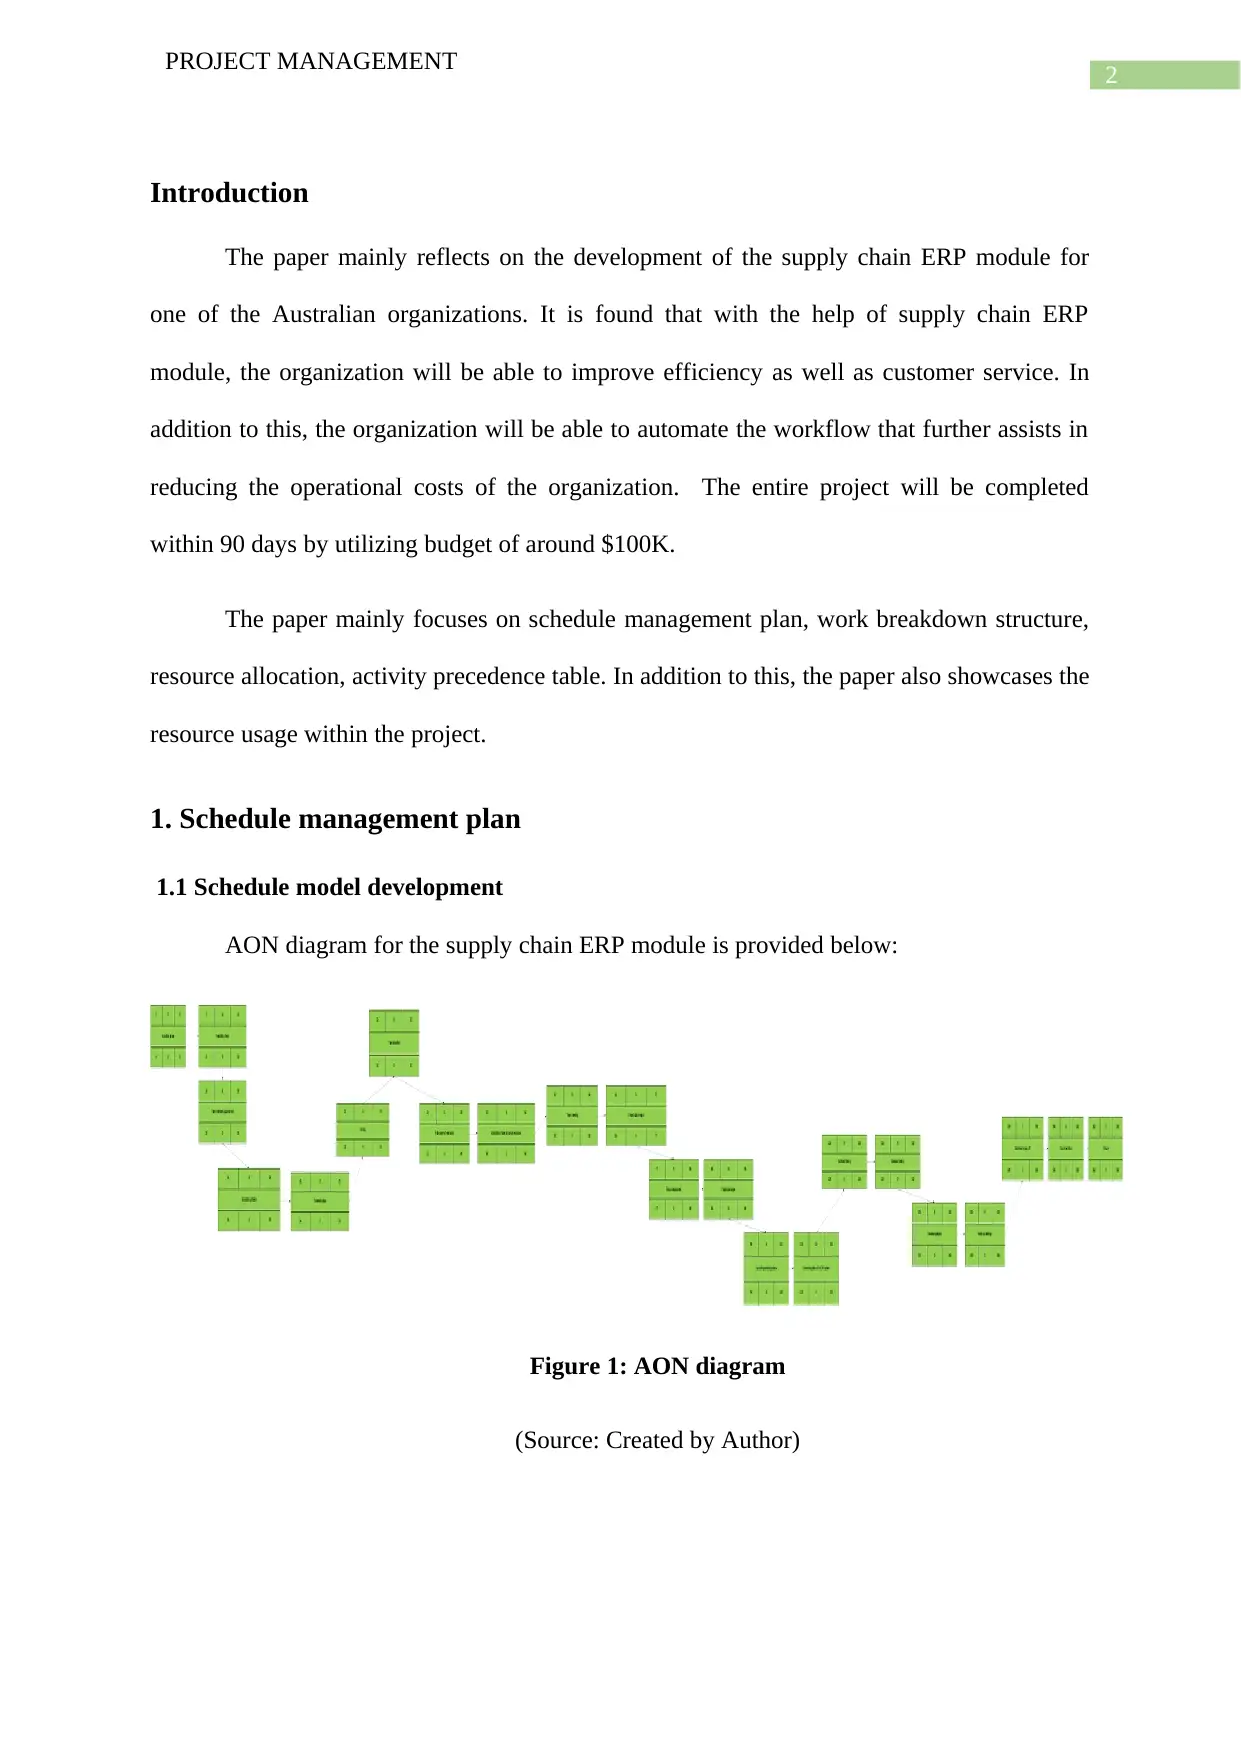
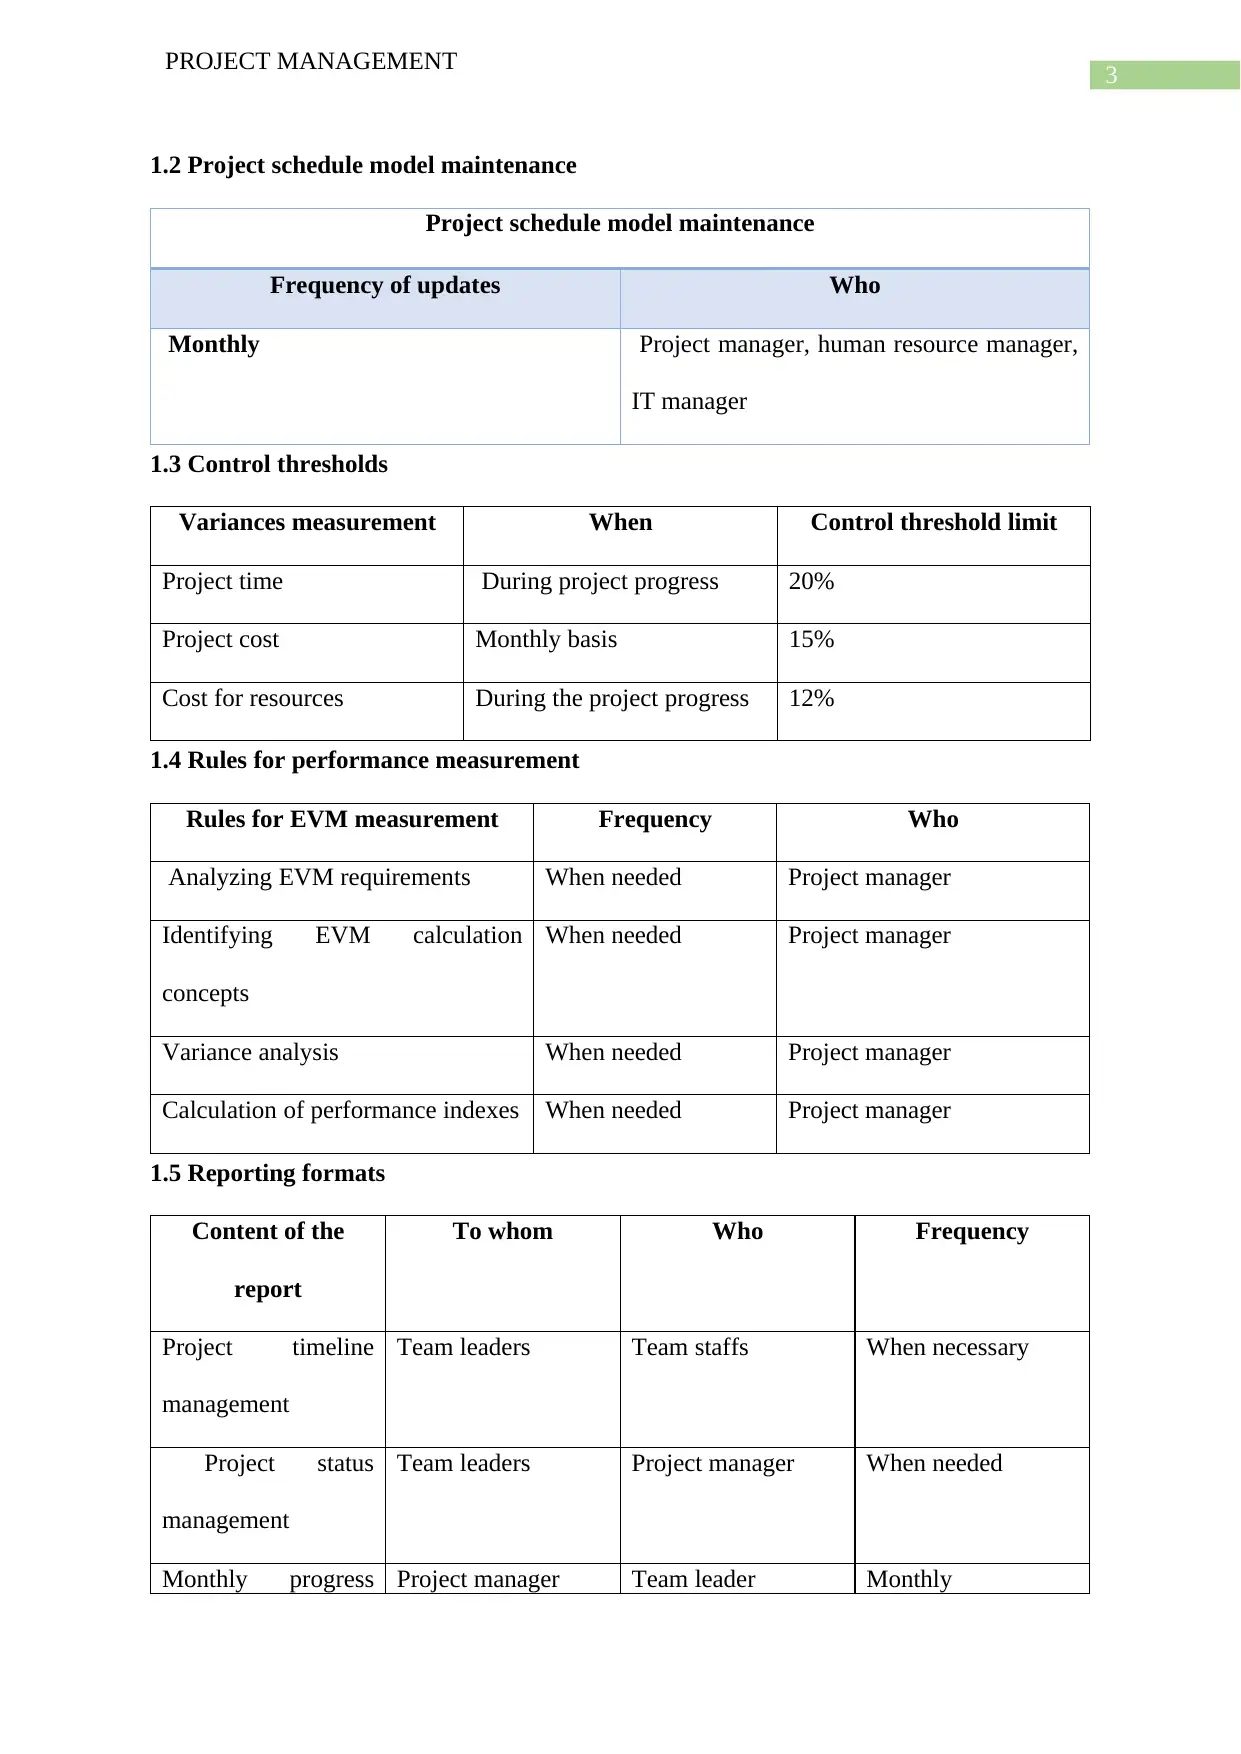
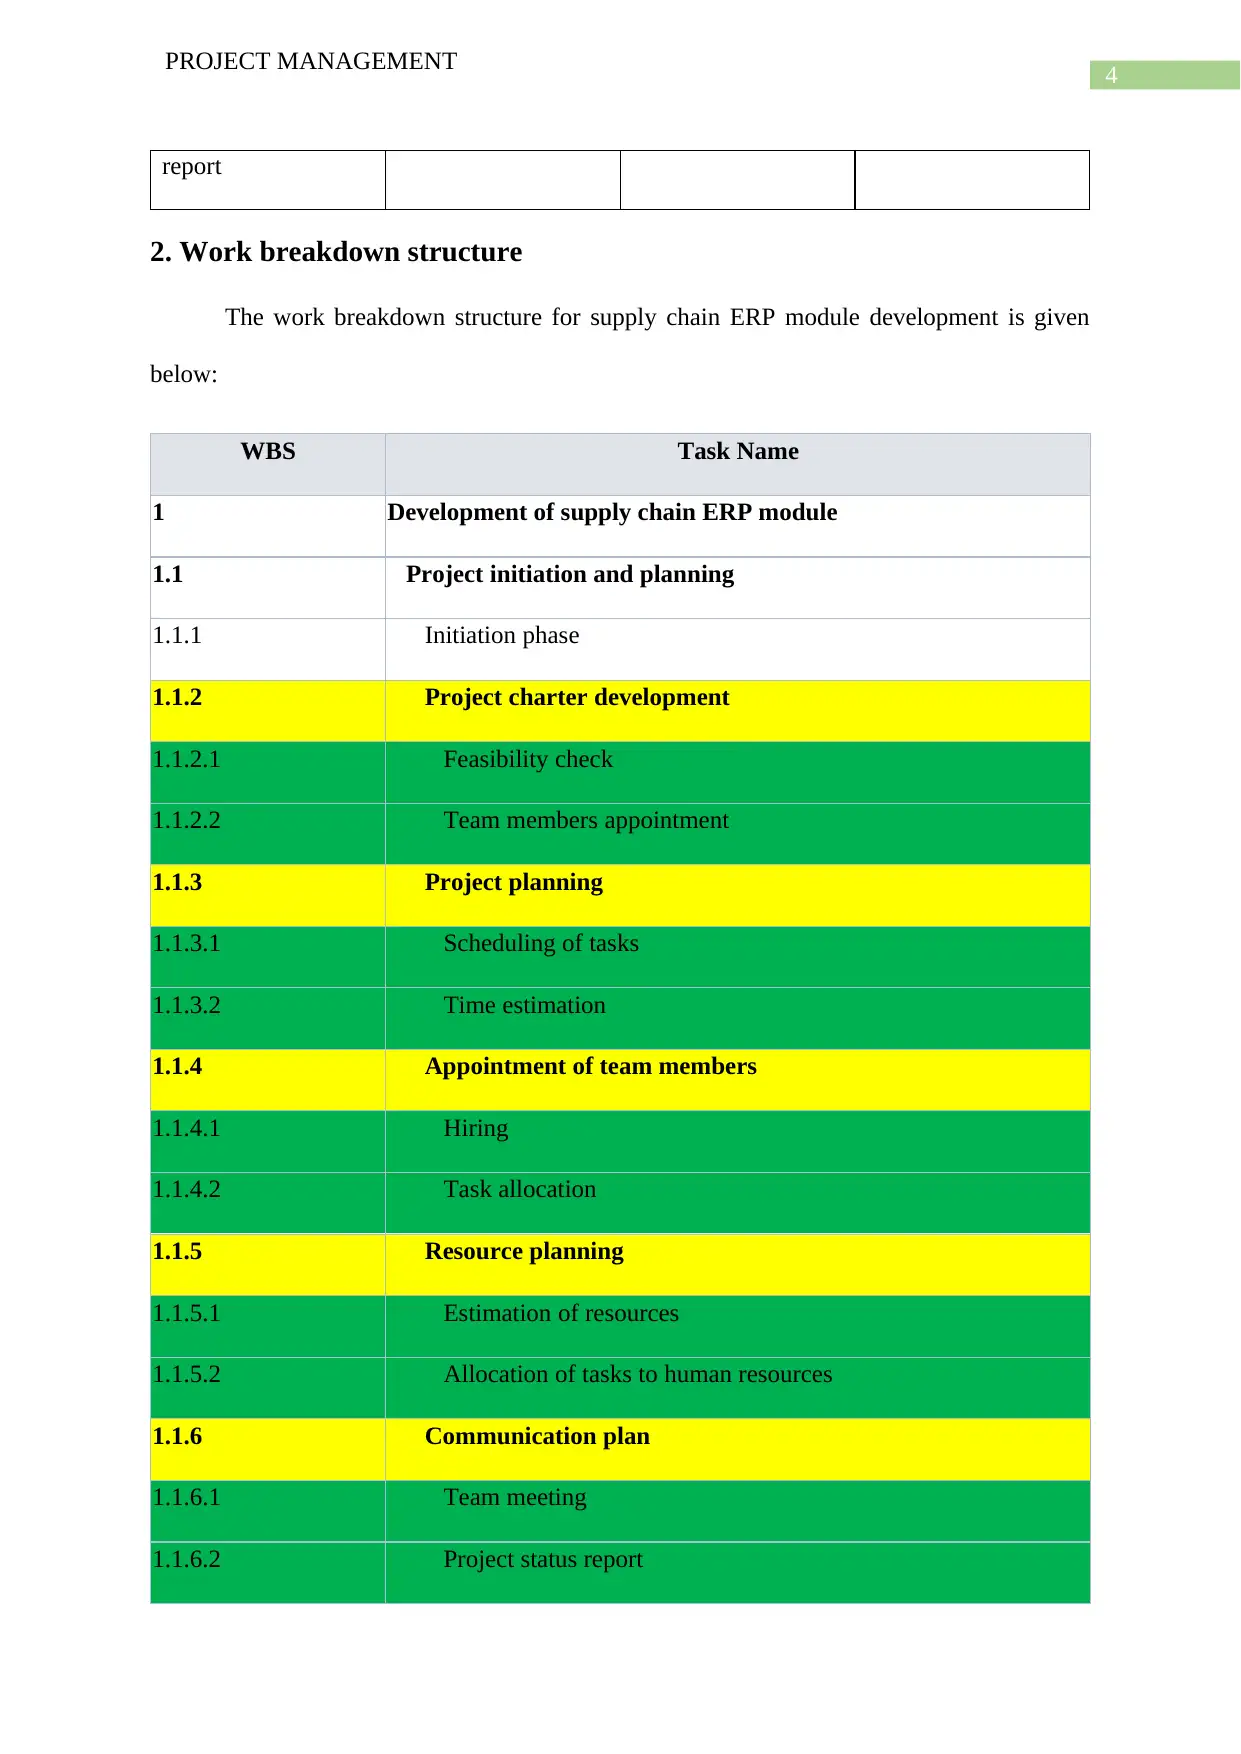
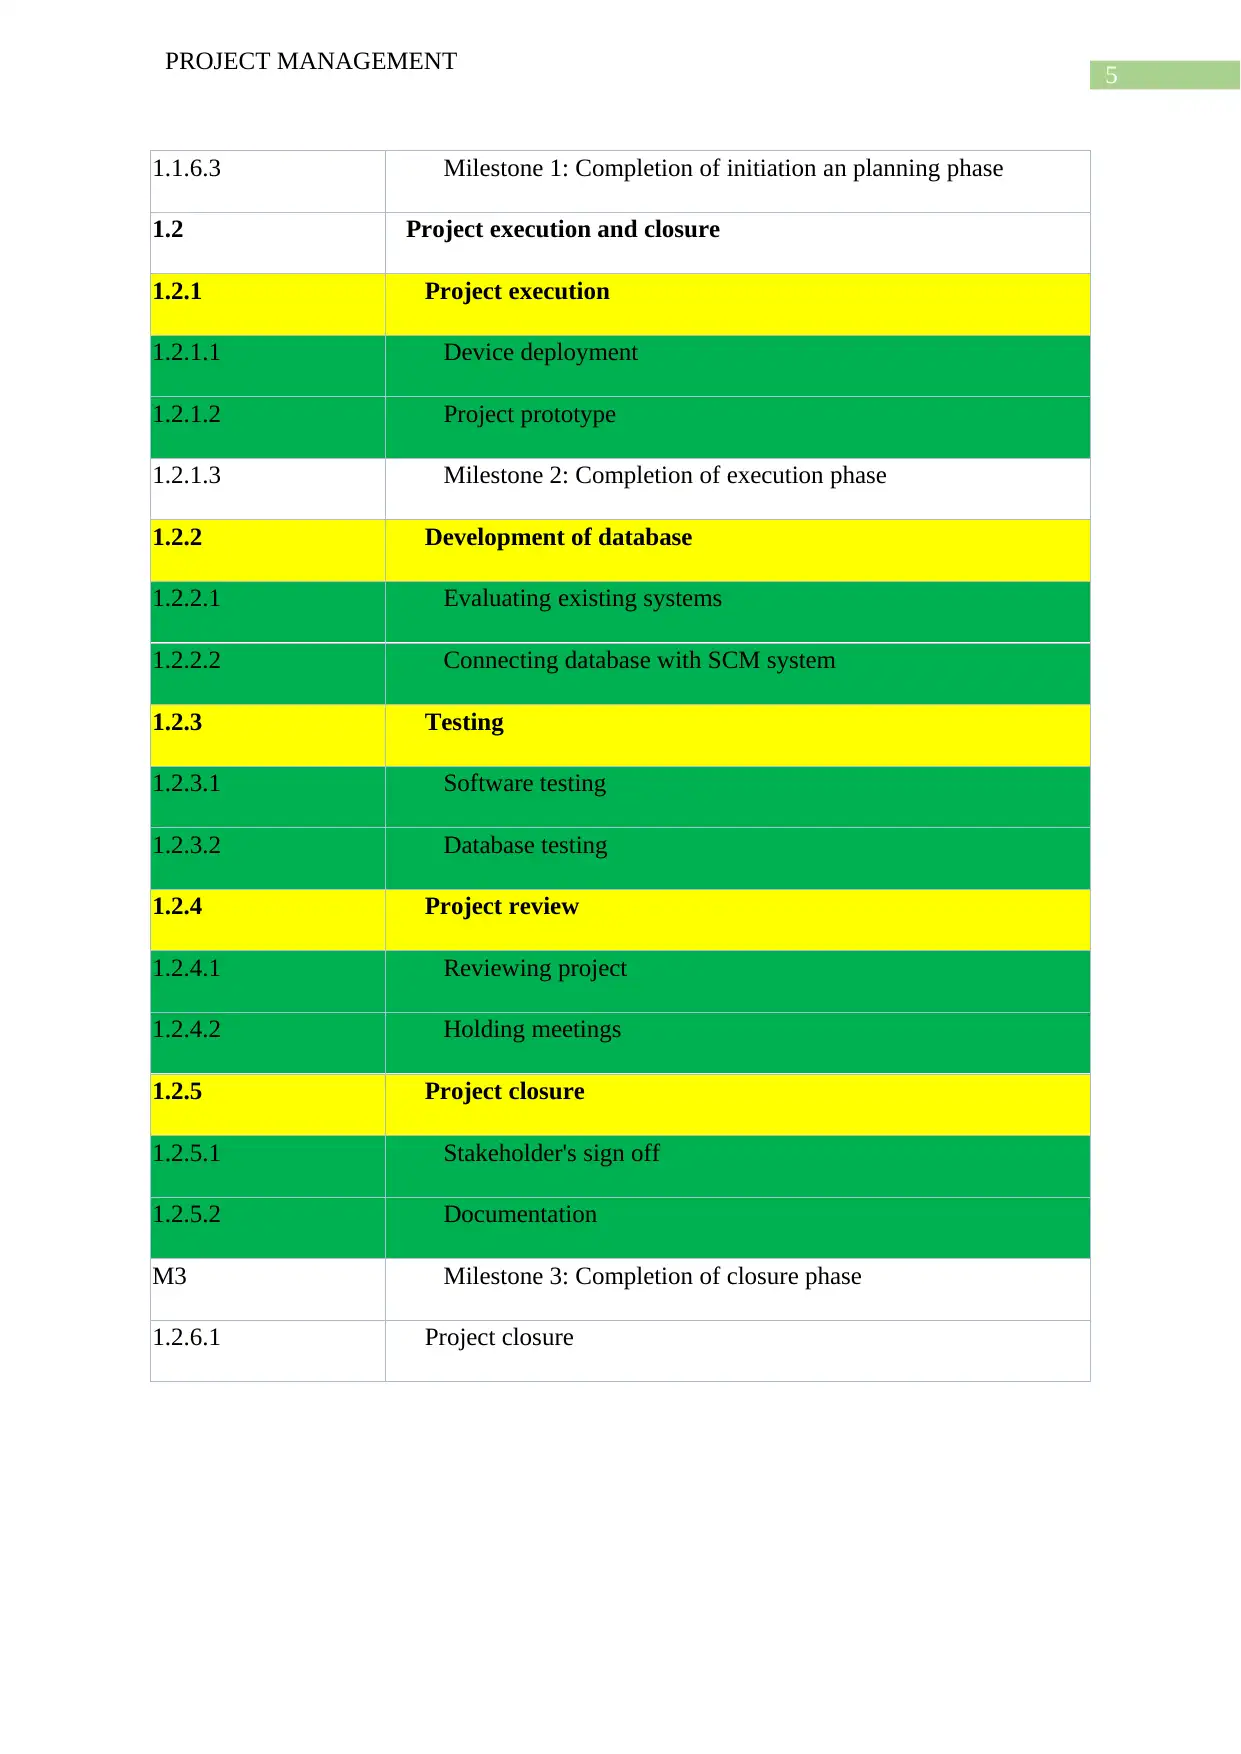
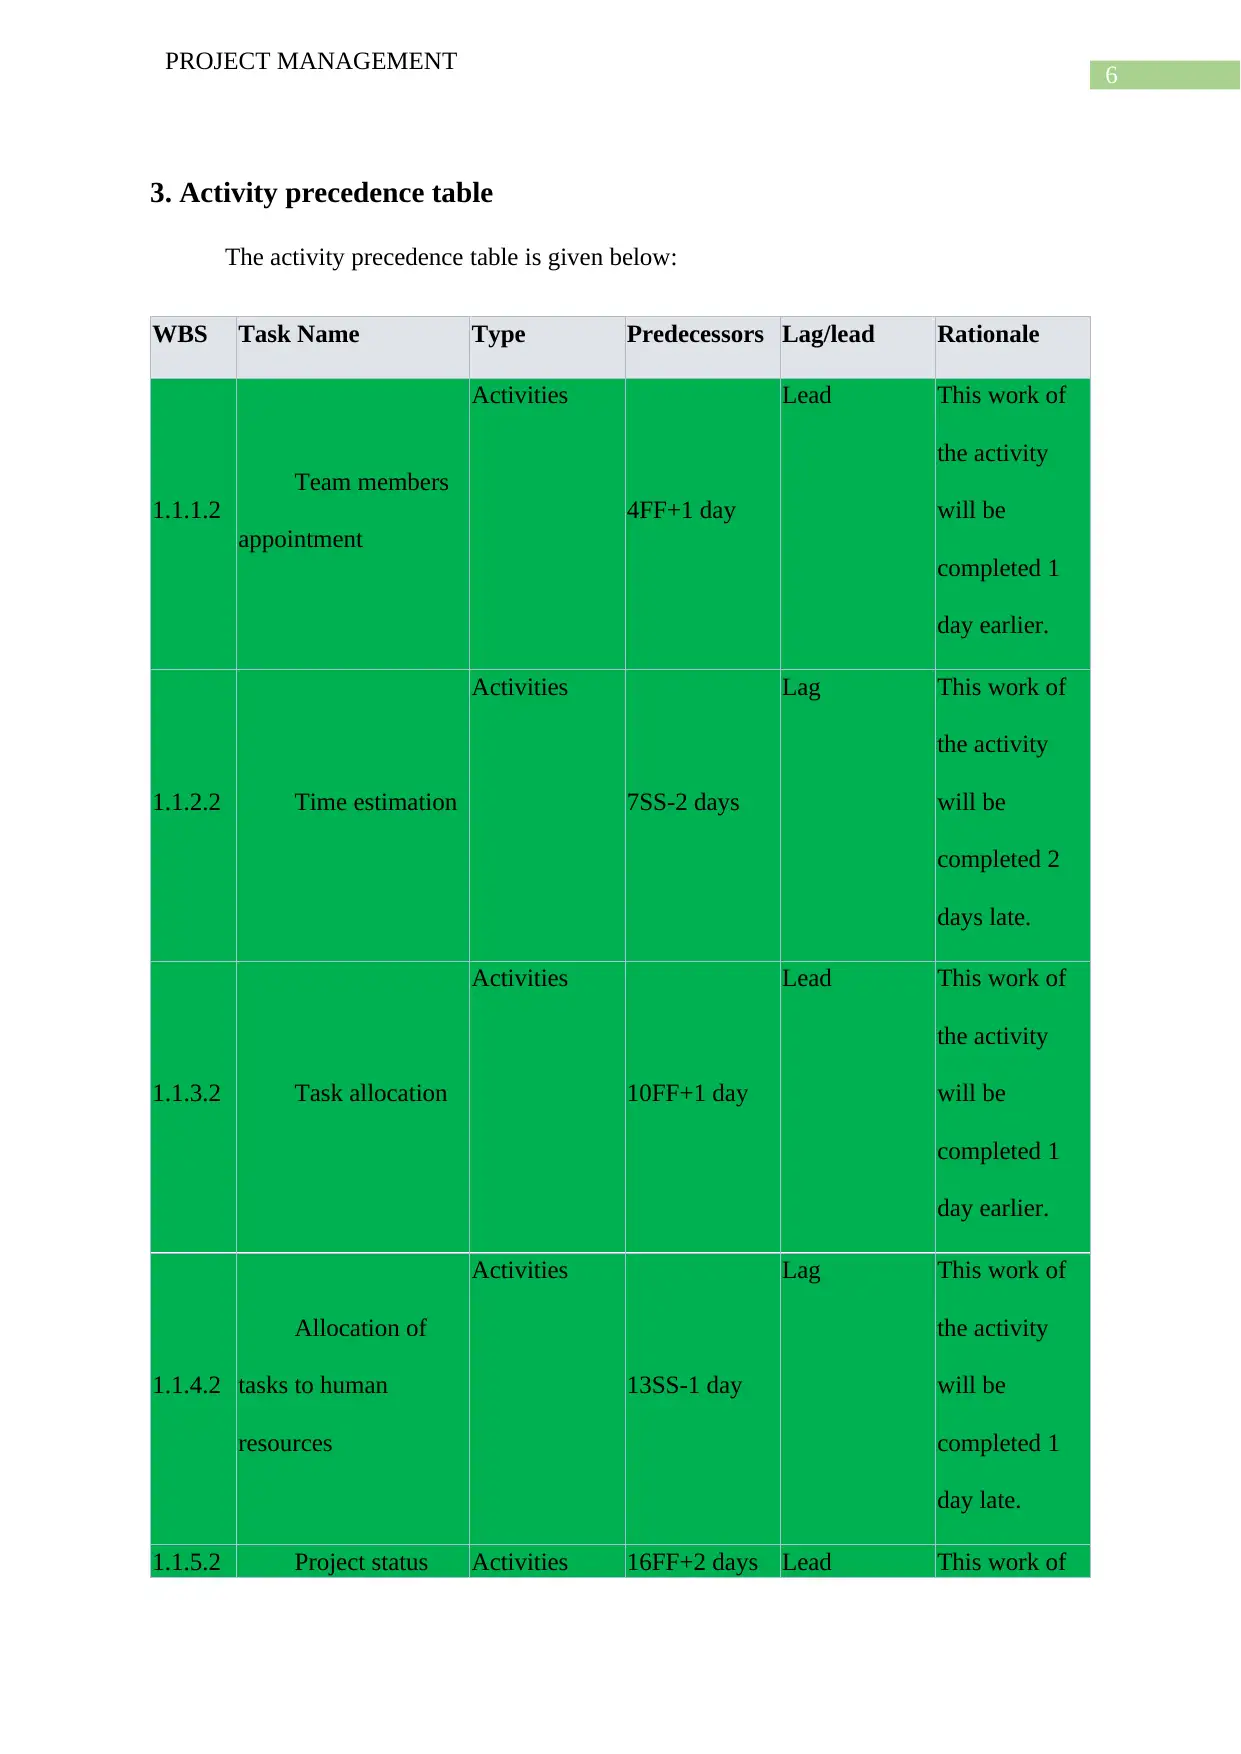
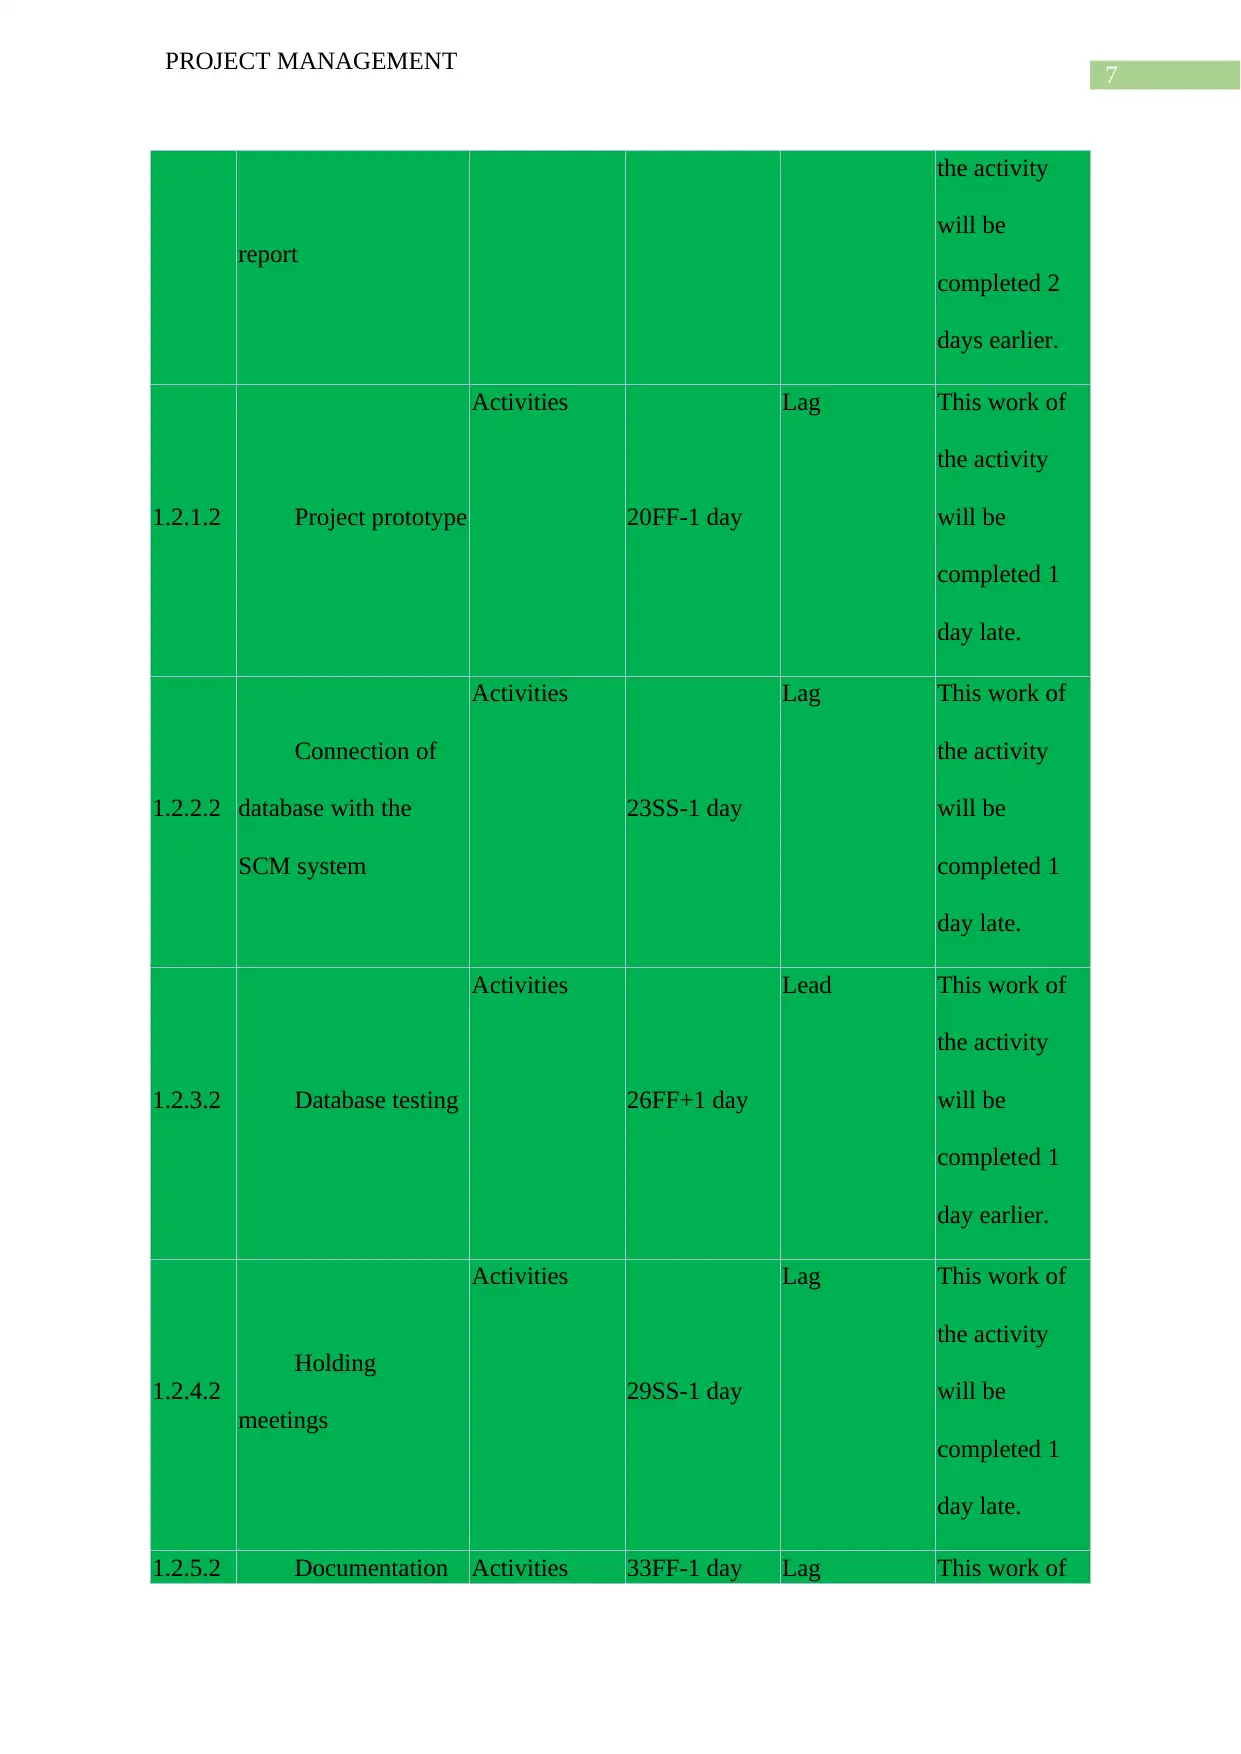
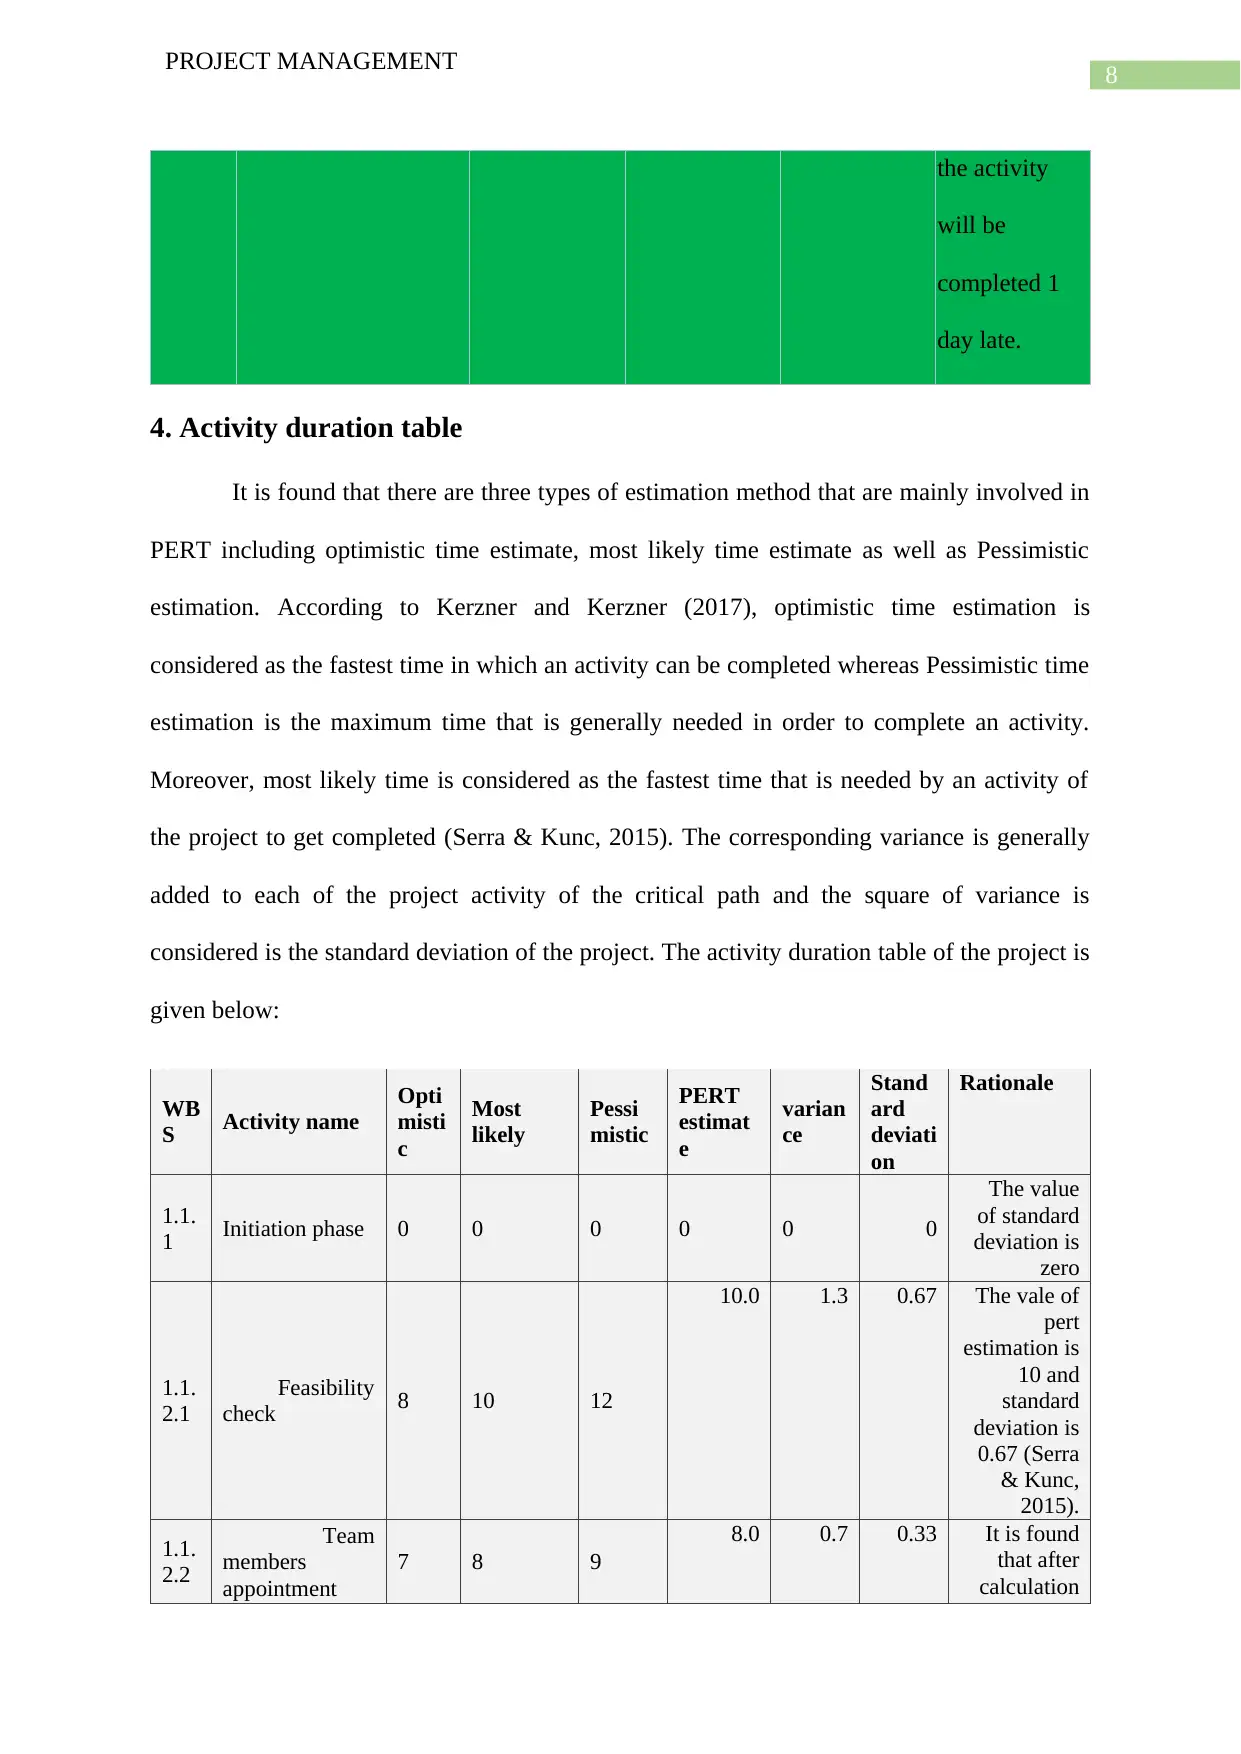
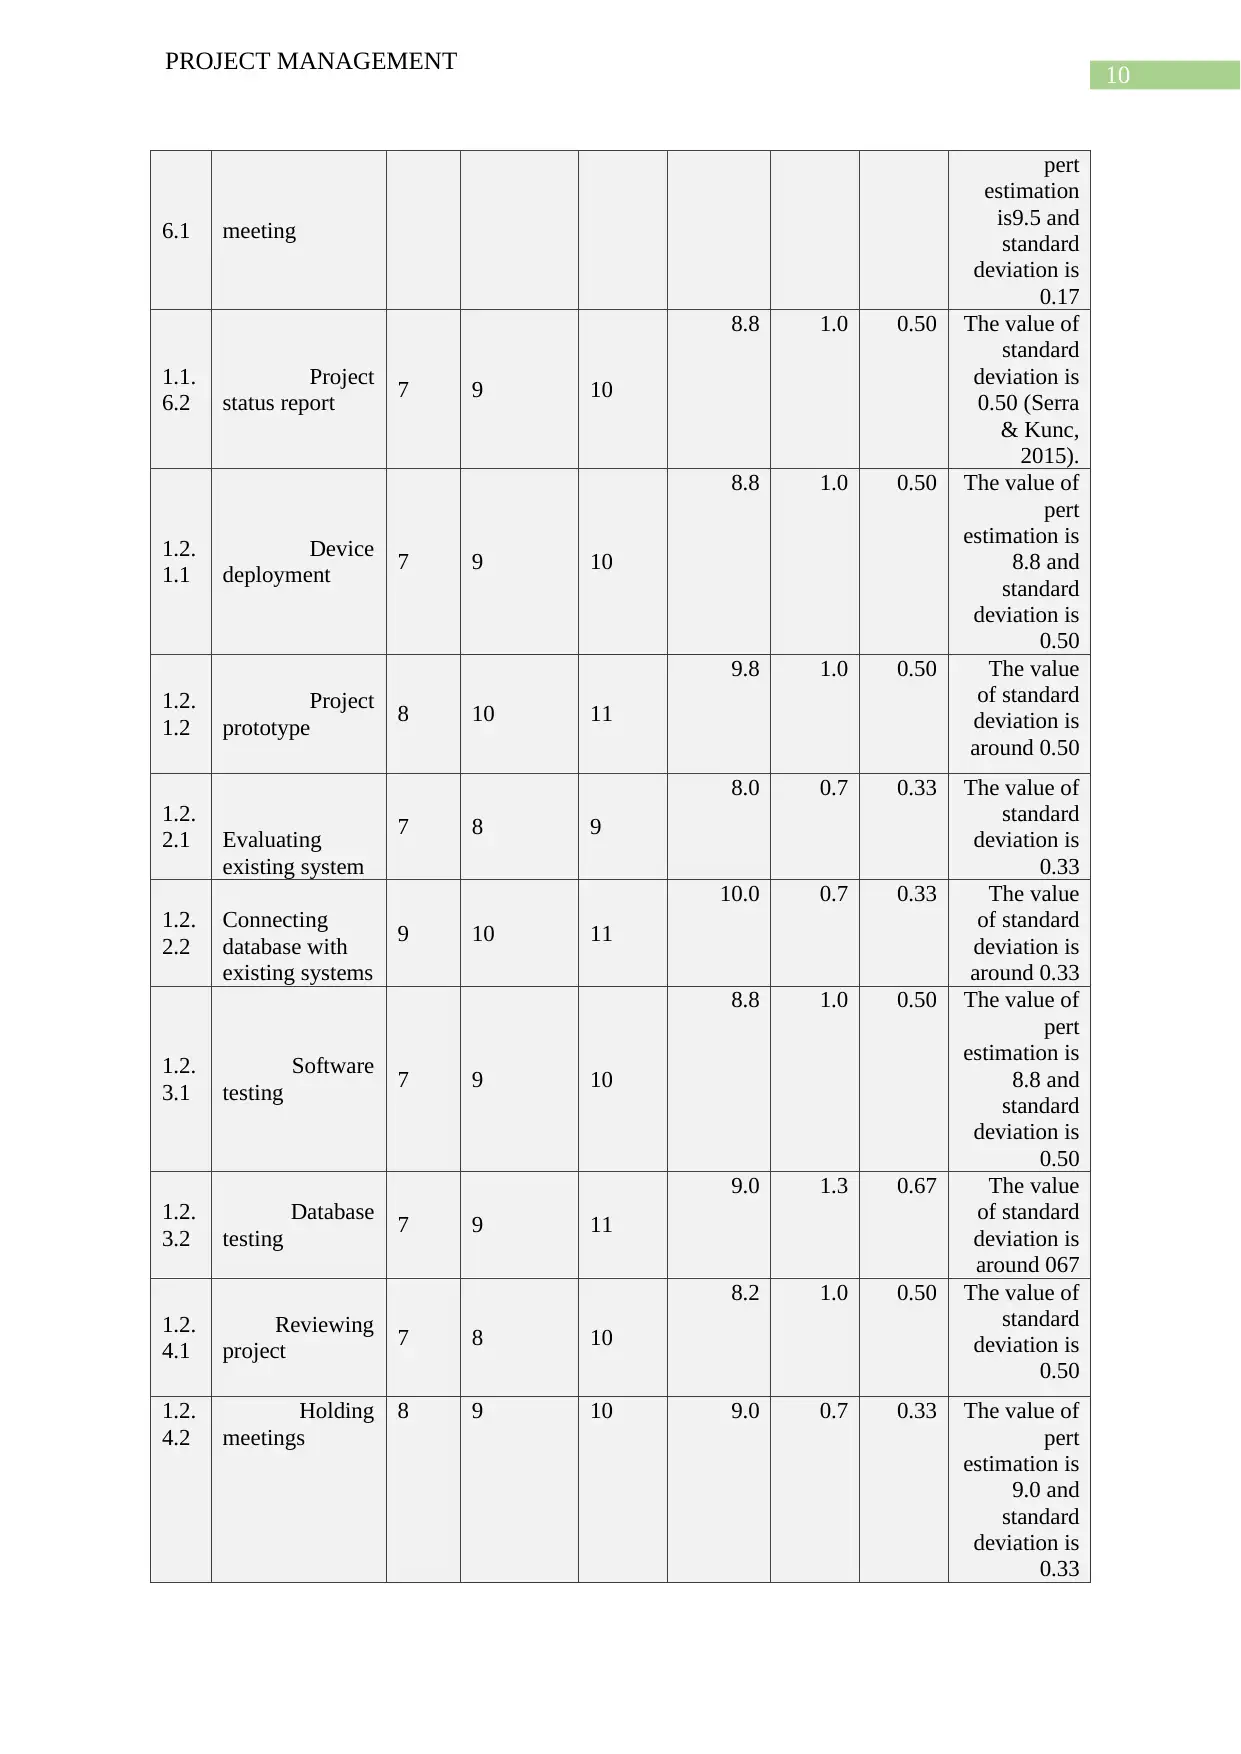
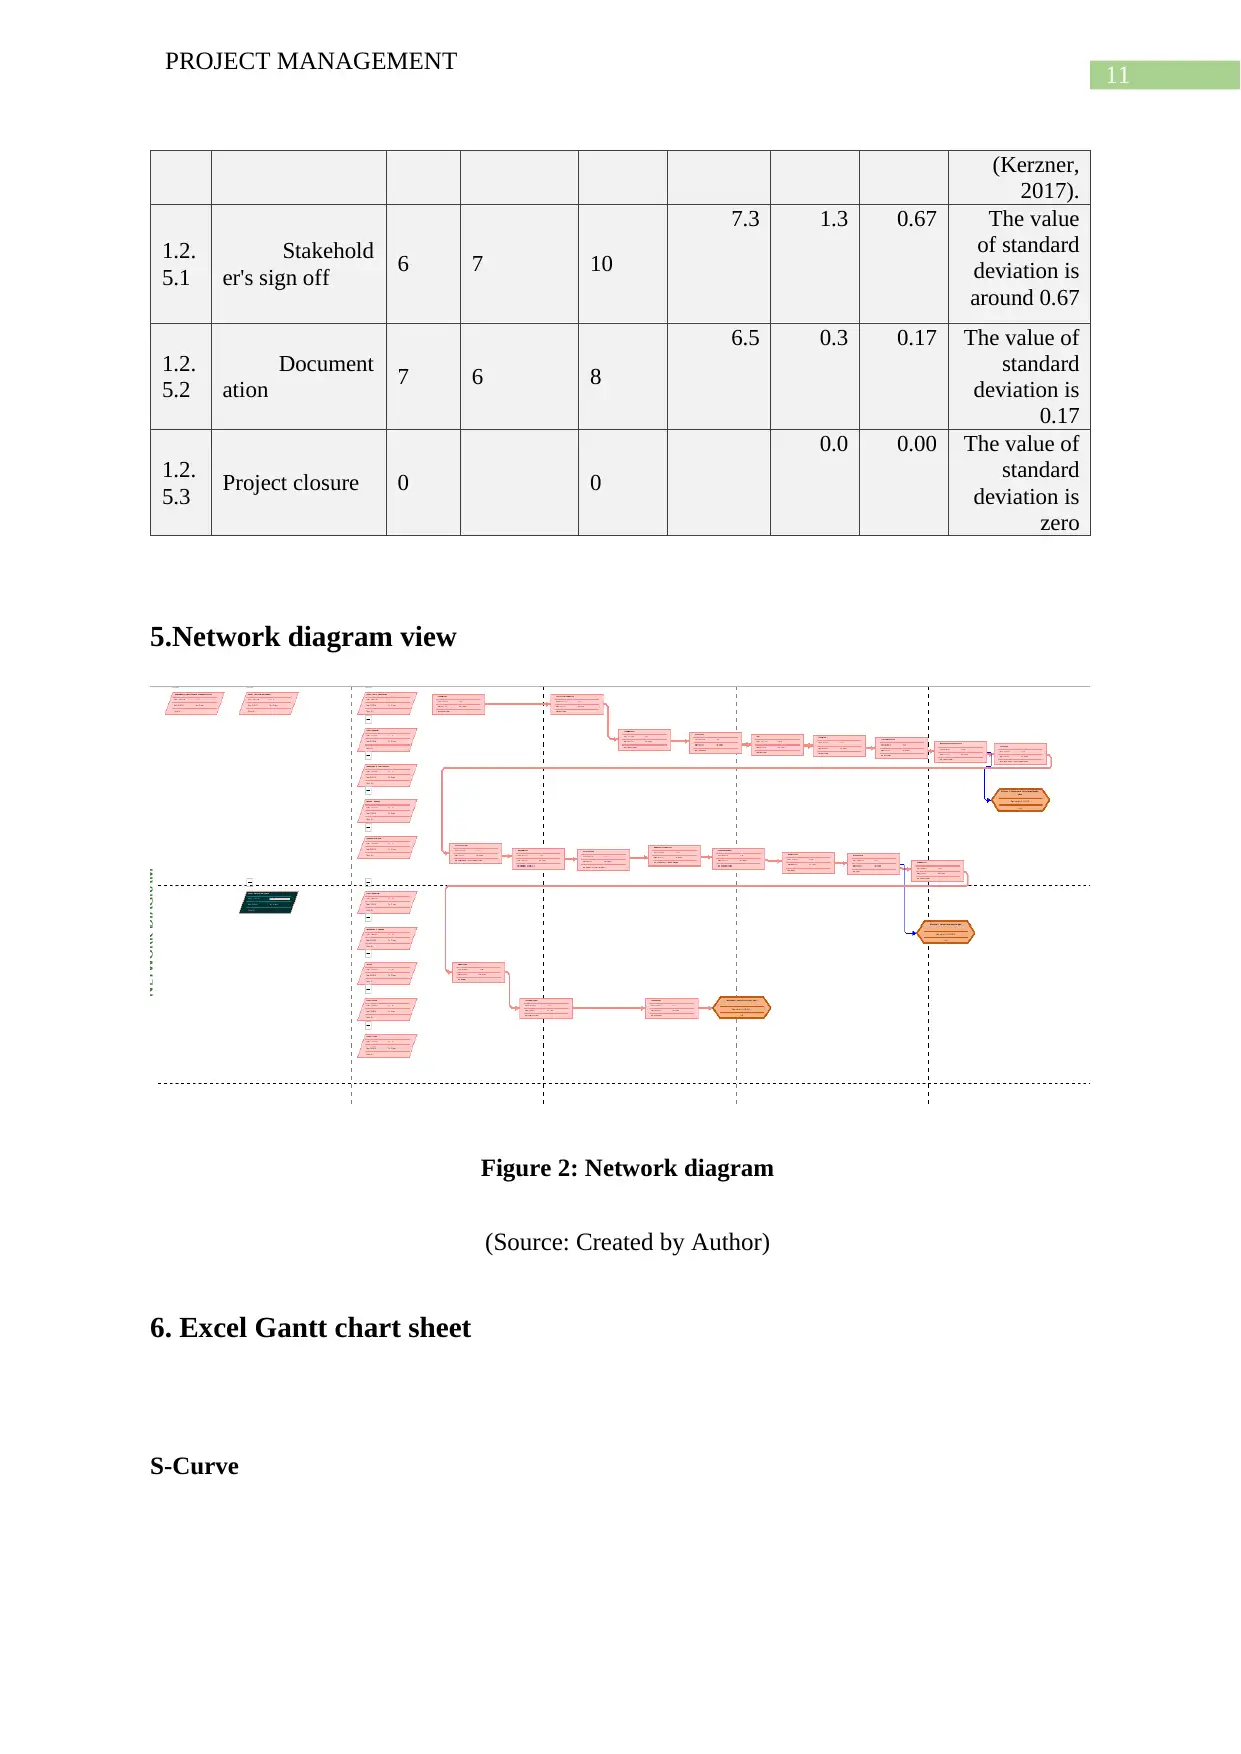
This project management report details the development of a supply chain ERP module for an Australian organization, aiming to enhance efficiency and customer service by automating workflows and reducing operational costs. The project, completed within 90 days with a $100K budget, covers key aspects such as schedule management, work breakdown structure (WBS), activity precedence tables, resource allocation, and the use of Gantt charts and network diagrams. The report includes an AON diagram for schedule model development, and a detailed WBS breaking down the project into initiation, execution, and closure phases. It also presents an activity precedence table, activity duration table, and resource usage views, including screenshots demonstrating the resolution of resource overallocation issues. The report concludes with a tracking Gantt chart and a bibliography of cited sources.

1 out of 21
Related Documents


Your All-in-One AI-Powered Toolkit for Academic Success.
+13062052269
info@desklib.com
Available 24*7 on WhatsApp / Email
![[object Object]](/_next/static/media/star-bottom.7253800d.svg)
Copyright © 2020–2026 A2Z Services. All Rights Reserved. Developed and managed by ZUCOL.