Project Management in Toyota
VerifiedAdded on 2021/02/21
|18
|3930
|383
AI Summary
Contribute Materials
Your contribution can guide someone’s learning journey. Share your
documents today.

Project Management
Secure Best Marks with AI Grader
Need help grading? Try our AI Grader for instant feedback on your assignments.
Table of Contents
INTRODUCTION ..........................................................................................................................1
Background and rationale ..........................................................................................................1
SCHEDULING/TIME MANAGEMENT ......................................................................................2
Gantt Chart .................................................................................................................................2
MILESTONE...................................................................................................................................5
HUMAN RESOURCE MANAGEMENT.......................................................................................6
COST/BUDGET MANAGEMENT................................................................................................8
PROJECT BUDGET...................................................................................................................8
Budget Report.............................................................................................................................9
COMMUNICATIONS MANAGEMENT.....................................................................................10
RACI TABLE...........................................................................................................................10
RISK REGISTER TABLE ...........................................................................................................11
Risk Register Table...................................................................................................................11
CONCLUSION..............................................................................................................................13
REFERENCES..............................................................................................................................15

INTRODUCTION
Background and rationale
An innovation of electric car is profitable business for any auto mobile industry. As
increase in technology and innovation , there is increase in preference of electric cars among
people. An electric car is an auto mobile that includes several electric motors in which energy is
stored in form of rechargeable batteries. Electric cares are very popular nowadays and customers
specially youngsters prefer these stylish and environment friendly cars. Toyota is a leading
company in auto mobile sector. It has around more than 350,000 employees across the world.
Toyota provides good services and products to people around the world and this company is
known for it's affordability of price and durability of the product. Toyota is ensuring comfort of
customers since many years and now it has decided to launch electric car in market. Toyota has
experienced launching of hybrid vehicles but now it is trying to launch electric cars in market.
For completing this project, Toyota requires new staff, production system, body parts of vehicle,
etc. It is a great challenge for Toyota to build a reliable electric car as there is a strong
competitor, Tesla already present in market which is dealing in electric cars. Therefore, it is
important for Toyota to put efforts in creating electric cars that will provide good service to
people. This project report consists of planning of launching of this product and creation of
electric cars in the company. Operations and marketing both are important in this project as
electric cars must be launched in market effectively and promoted to customers.
Project Charter
A project charter is defined as a statement of objectives and aims of the project. This
statement consists of detailed project roles. Goals and responsibilities. It also includes
identification of main stakeholders and level of authority of a project manager. The project
charter of this project is given below-
Project title: Electric car
Date of Authorization: 1/05/2019
Project start date: 4/06/2019
Project finish date: 07/06/2019
Key schedule milestones: Complete version of document at June 20
1
Secure Best Marks with AI Grader
Need help grading? Try our AI Grader for instant feedback on your assignments.
Complete second version of this document
at June 28
Complete final version of the document at
July 7
Budget information: The budget of this project is $10,000 AUD
Project Manager: A
SCHEDULING/TIME MANAGEMENT
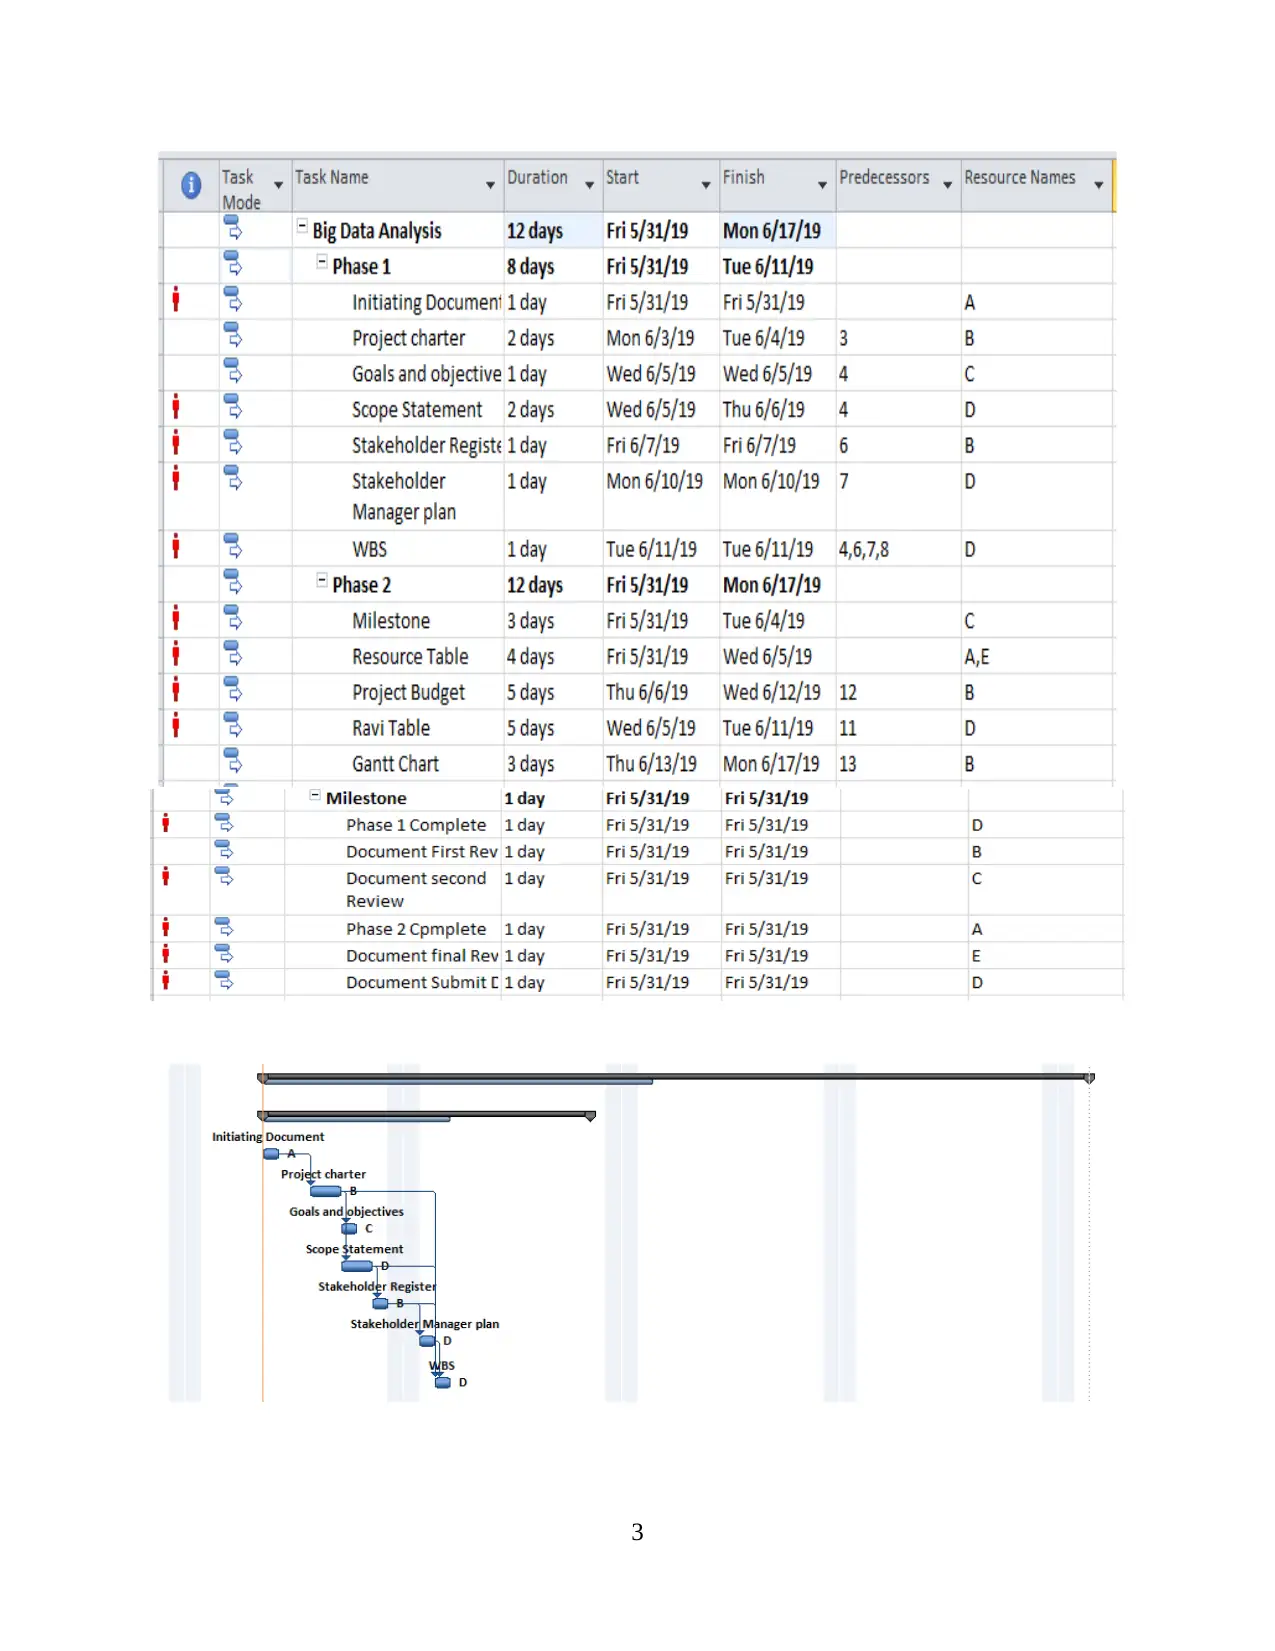
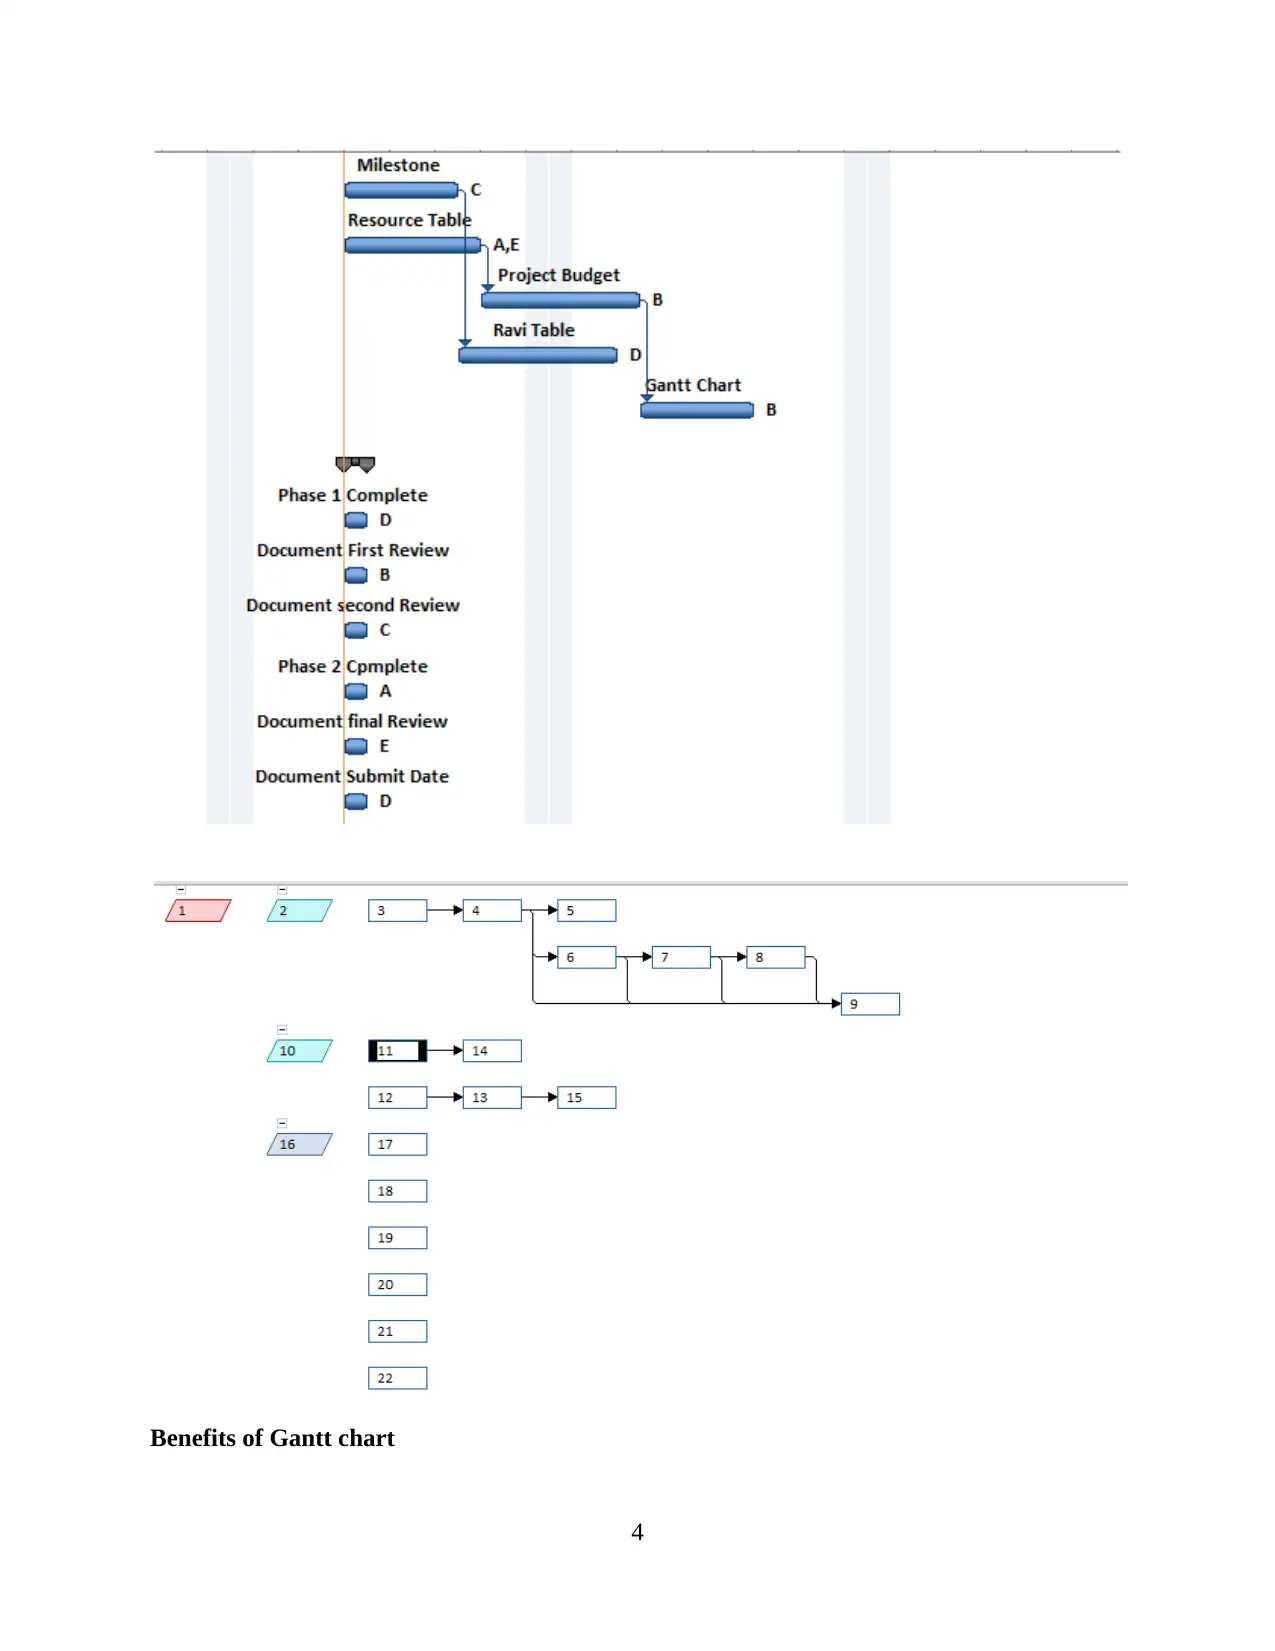
Gantt Chart
A Gantt chart is a representation of project activities used in project management. It is
one of the most common and useful kind of representing project activities. These includes tasks
and events according to the time allocated to each activity. In Gantt chart, the top of chart
represents time scale and left side of chart represents number of tasks and activities of the
project. Every task is demonstrated by a bar and position and bar represents the start date, end
date and duration of the project. This helps in knowing following purposes of the project-
What are the activities involved in project
What are the dates and timing when the project started
What are the dates and timing when the project ended
How long each activity is scheduled to last
What are the dates when activities overlaps and by how much
The start and end date of whole project
2
at June 28
Complete final version of the document at
July 7
Budget information: The budget of this project is $10,000 AUD
Project Manager: A
SCHEDULING/TIME MANAGEMENT
Gantt Chart
A Gantt chart is a representation of project activities used in project management. It is
one of the most common and useful kind of representing project activities. These includes tasks
and events according to the time allocated to each activity. In Gantt chart, the top of chart
represents time scale and left side of chart represents number of tasks and activities of the
project. Every task is demonstrated by a bar and position and bar represents the start date, end
date and duration of the project. This helps in knowing following purposes of the project-
What are the activities involved in project
What are the dates and timing when the project started
What are the dates and timing when the project ended
How long each activity is scheduled to last
What are the dates when activities overlaps and by how much
The start and end date of whole project
2
3
Benefits of Gantt chart
4
4
Paraphrase This Document
Need a fresh take? Get an instant paraphrase of this document with our AI Paraphraser
Clarity - The Gantt chart tool helps in knowing the activities of project easily and
converting the big project into smaller activities. This helps the project manager to understand
project activities easily.
Communication – The project teams uses Gantt chart for replacing meetings and
enhancing the updations that occur in project activities. This clarifies chart positions and visual
method for understanding the project tasks.
Coordination – It is important for project managers to effectively utilise the resources
available for project. The Gantt chart involves the ability to sequence project tasks and reducing
the burden on members of project teams. There are some projects managers who use
combination of chart for breaking down whole project into manageable tasks and activities.
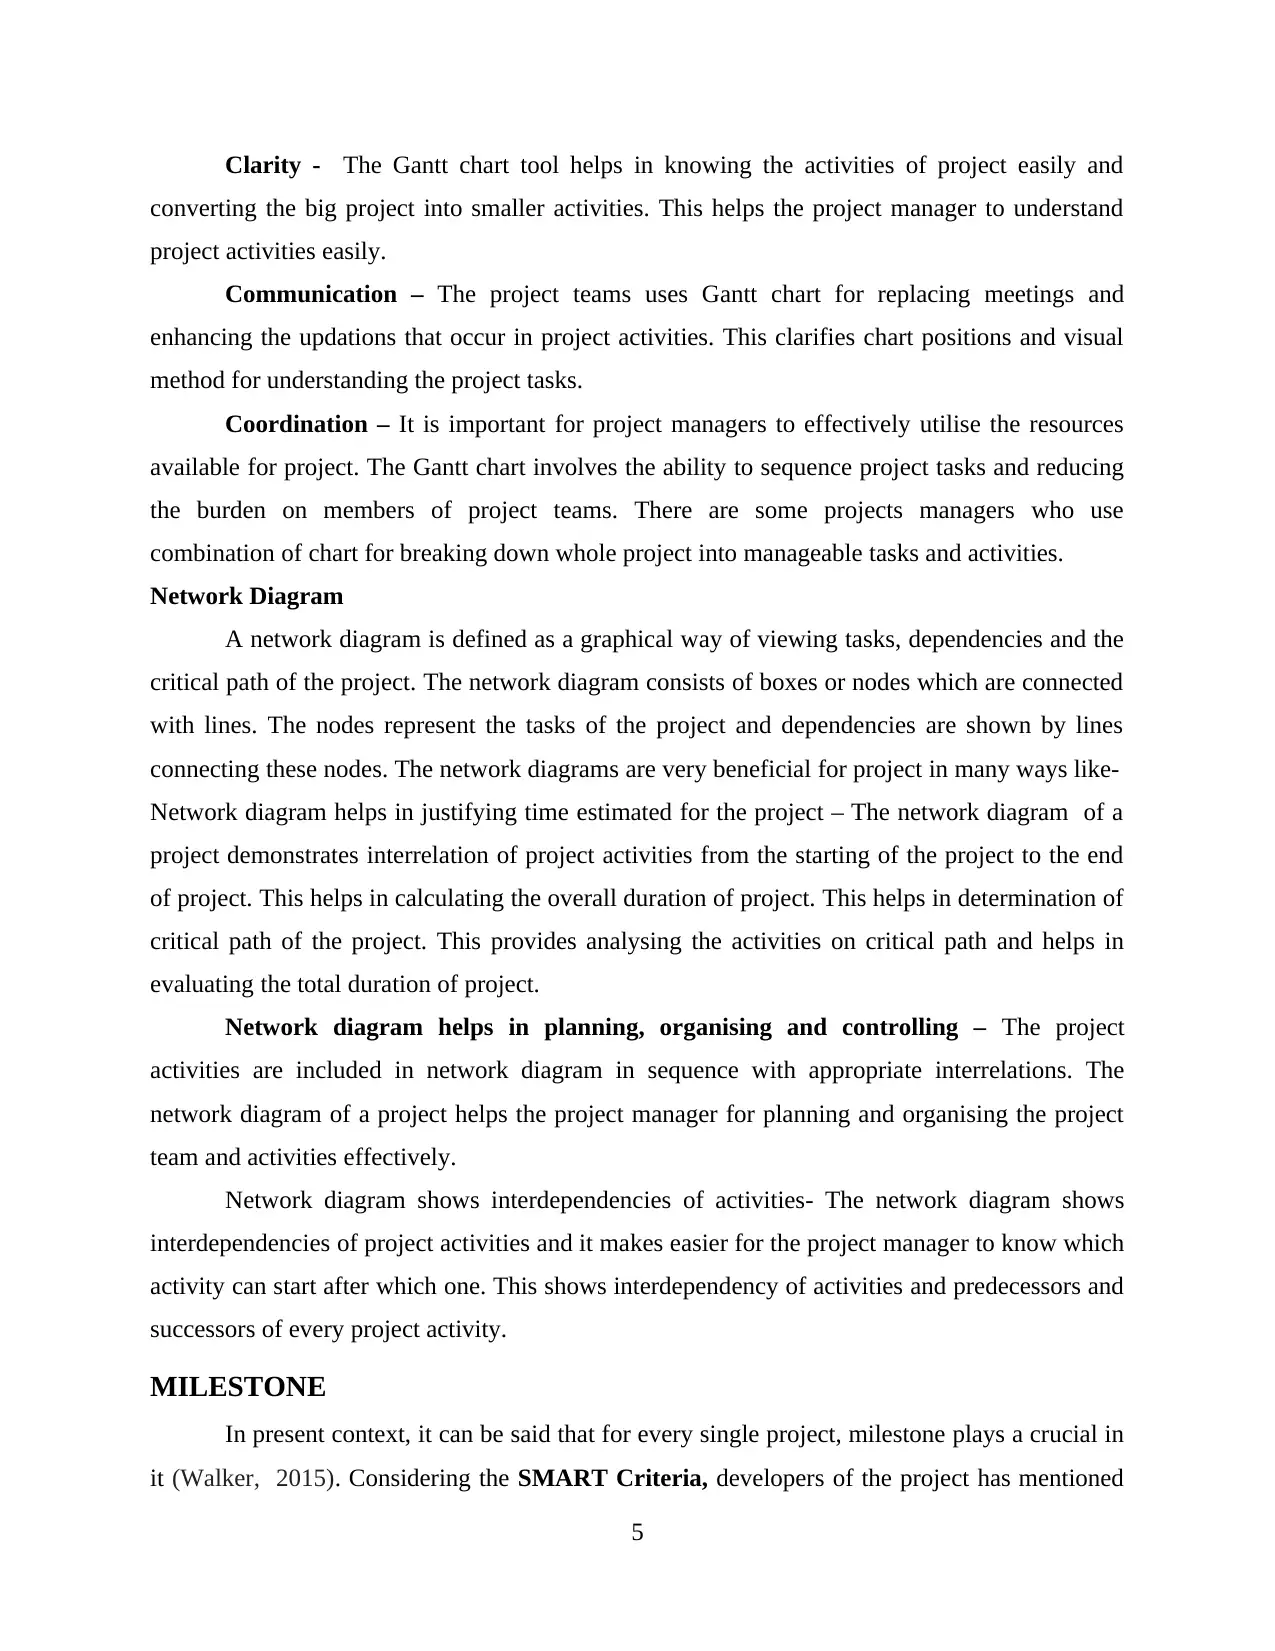
Network Diagram
A network diagram is defined as a graphical way of viewing tasks, dependencies and the
critical path of the project. The network diagram consists of boxes or nodes which are connected
with lines. The nodes represent the tasks of the project and dependencies are shown by lines
connecting these nodes. The network diagrams are very beneficial for project in many ways like-
Network diagram helps in justifying time estimated for the project – The network diagram of a
project demonstrates interrelation of project activities from the starting of the project to the end
of project. This helps in calculating the overall duration of project. This helps in determination of
critical path of the project. This provides analysing the activities on critical path and helps in
evaluating the total duration of project.
Network diagram helps in planning, organising and controlling – The project
activities are included in network diagram in sequence with appropriate interrelations. The
network diagram of a project helps the project manager for planning and organising the project
team and activities effectively.
Network diagram shows interdependencies of activities- The network diagram shows
interdependencies of project activities and it makes easier for the project manager to know which
activity can start after which one. This shows interdependency of activities and predecessors and
successors of every project activity.
MILESTONE
In present context, it can be said that for every single project, milestone plays a crucial in
it (Walker, 2015). Considering the SMART Criteria, developers of the project has mentioned
5
converting the big project into smaller activities. This helps the project manager to understand
project activities easily.
Communication – The project teams uses Gantt chart for replacing meetings and
enhancing the updations that occur in project activities. This clarifies chart positions and visual
method for understanding the project tasks.
Coordination – It is important for project managers to effectively utilise the resources
available for project. The Gantt chart involves the ability to sequence project tasks and reducing
the burden on members of project teams. There are some projects managers who use
combination of chart for breaking down whole project into manageable tasks and activities.
Network Diagram
A network diagram is defined as a graphical way of viewing tasks, dependencies and the
critical path of the project. The network diagram consists of boxes or nodes which are connected
with lines. The nodes represent the tasks of the project and dependencies are shown by lines
connecting these nodes. The network diagrams are very beneficial for project in many ways like-
Network diagram helps in justifying time estimated for the project – The network diagram of a
project demonstrates interrelation of project activities from the starting of the project to the end
of project. This helps in calculating the overall duration of project. This helps in determination of
critical path of the project. This provides analysing the activities on critical path and helps in
evaluating the total duration of project.
Network diagram helps in planning, organising and controlling – The project
activities are included in network diagram in sequence with appropriate interrelations. The
network diagram of a project helps the project manager for planning and organising the project
team and activities effectively.
Network diagram shows interdependencies of activities- The network diagram shows
interdependencies of project activities and it makes easier for the project manager to know which
activity can start after which one. This shows interdependency of activities and predecessors and
successors of every project activity.
MILESTONE
In present context, it can be said that for every single project, milestone plays a crucial in
it (Walker, 2015). Considering the SMART Criteria, developers of the project has mentioned
5
different range of milestones that are enclosed within the project (Fleming and Koppelman,
2016). Including this, team has also showed the status as well of the reports including team
member who is in charge on a particular subject. Basically, why SMART Criteria is being used
is to pull out all the milestones or key events which can be measurable, time-bound, specific,
relevant and attainable in the project.
MILESTONES DATE STATUS RESPONSIBLE COMMENTS
Completion of the
First Phase
April 26th, 2019 Completed A Error
Rectification
Proper review of
the first
documentation
May 3rd, 2019 Completed C Proof reading of
elements that are
linked with the
Stakeholders
Review done of
second preferred
document
May 15th, 2019 Completed D Rectification
within the
stakeholder
management
strategy
Completion of
Second Phase
May 19th, 2019 Completed B Redevelopment
of the Gantt Chart
Decent review of
the first
documentation
June 2nd, 2019 Completed E
Submission of the
documentation
June 7th, 2019 Completed F
Above milestones table shows when significant events in the project took place and who
was responsible for the achievements within the project.
HUMAN RESOURCE MANAGEMENT
It is being analysed that, for completing a project, it is being analysed that team members
of a project requires to manage the resources. With the help of this, a project can become much
6
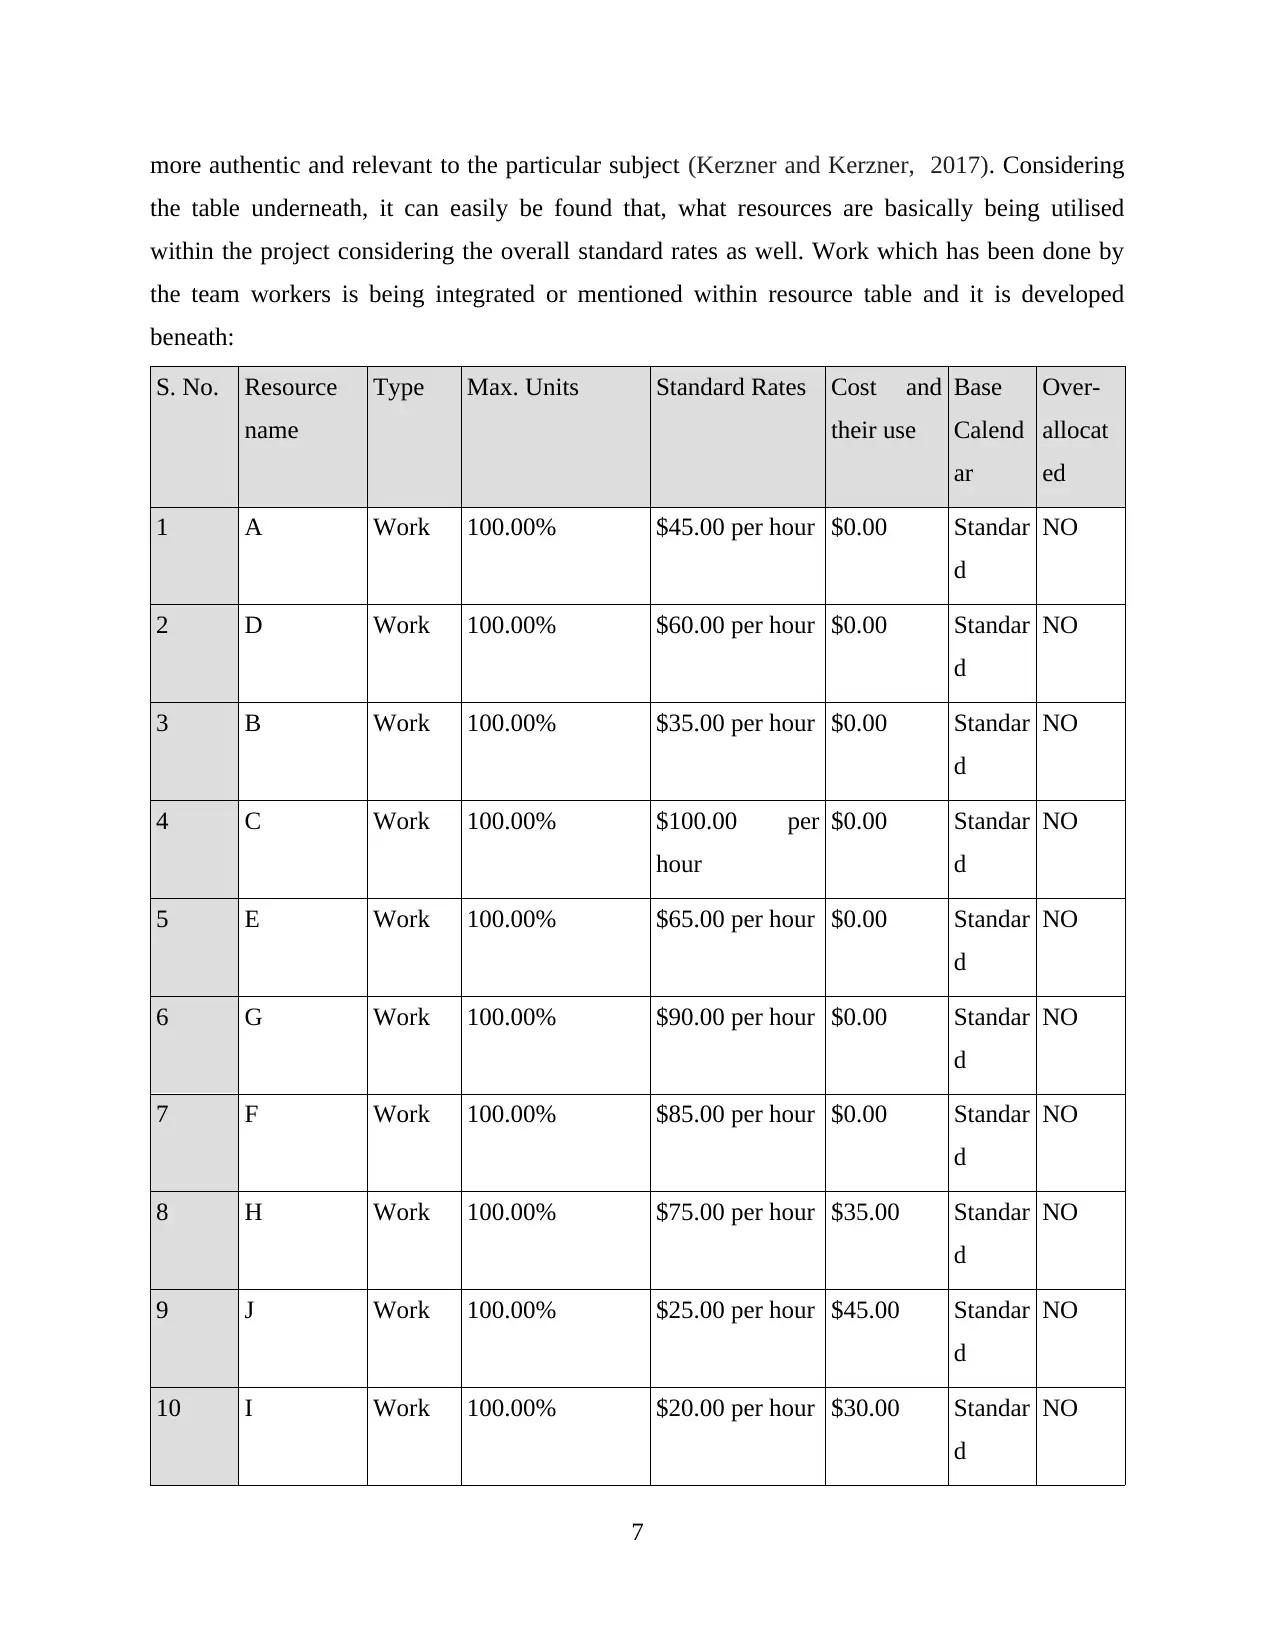
more authentic and relevant to the particular subject (Kerzner and Kerzner, 2017). Considering
the table underneath, it can easily be found that, what resources are basically being utilised
within the project considering the overall standard rates as well. Work which has been done by
the team workers is being integrated or mentioned within resource table and it is developed
beneath:
S. No. Resource
name
Type Max. Units Standard Rates Cost and
their use
Base
Calend
ar
Over-
allocat
ed
1 A Work 100.00% $45.00 per hour $0.00 Standar
d
NO
2 D Work 100.00% $60.00 per hour $0.00 Standar
d
NO
3 B Work 100.00% $35.00 per hour $0.00 Standar
d
NO
4 C Work 100.00% $100.00 per
hour
$0.00 Standar
d
NO
5 E Work 100.00% $65.00 per hour $0.00 Standar
d
NO
6 G Work 100.00% $90.00 per hour $0.00 Standar
d
NO
7 F Work 100.00% $85.00 per hour $0.00 Standar
d
NO
8 H Work 100.00% $75.00 per hour $35.00 Standar
d
NO
9 J Work 100.00% $25.00 per hour $45.00 Standar
d
NO
10 I Work 100.00% $20.00 per hour $30.00 Standar
d
NO
7
Secure Best Marks with AI Grader
Need help grading? Try our AI Grader for instant feedback on your assignments.
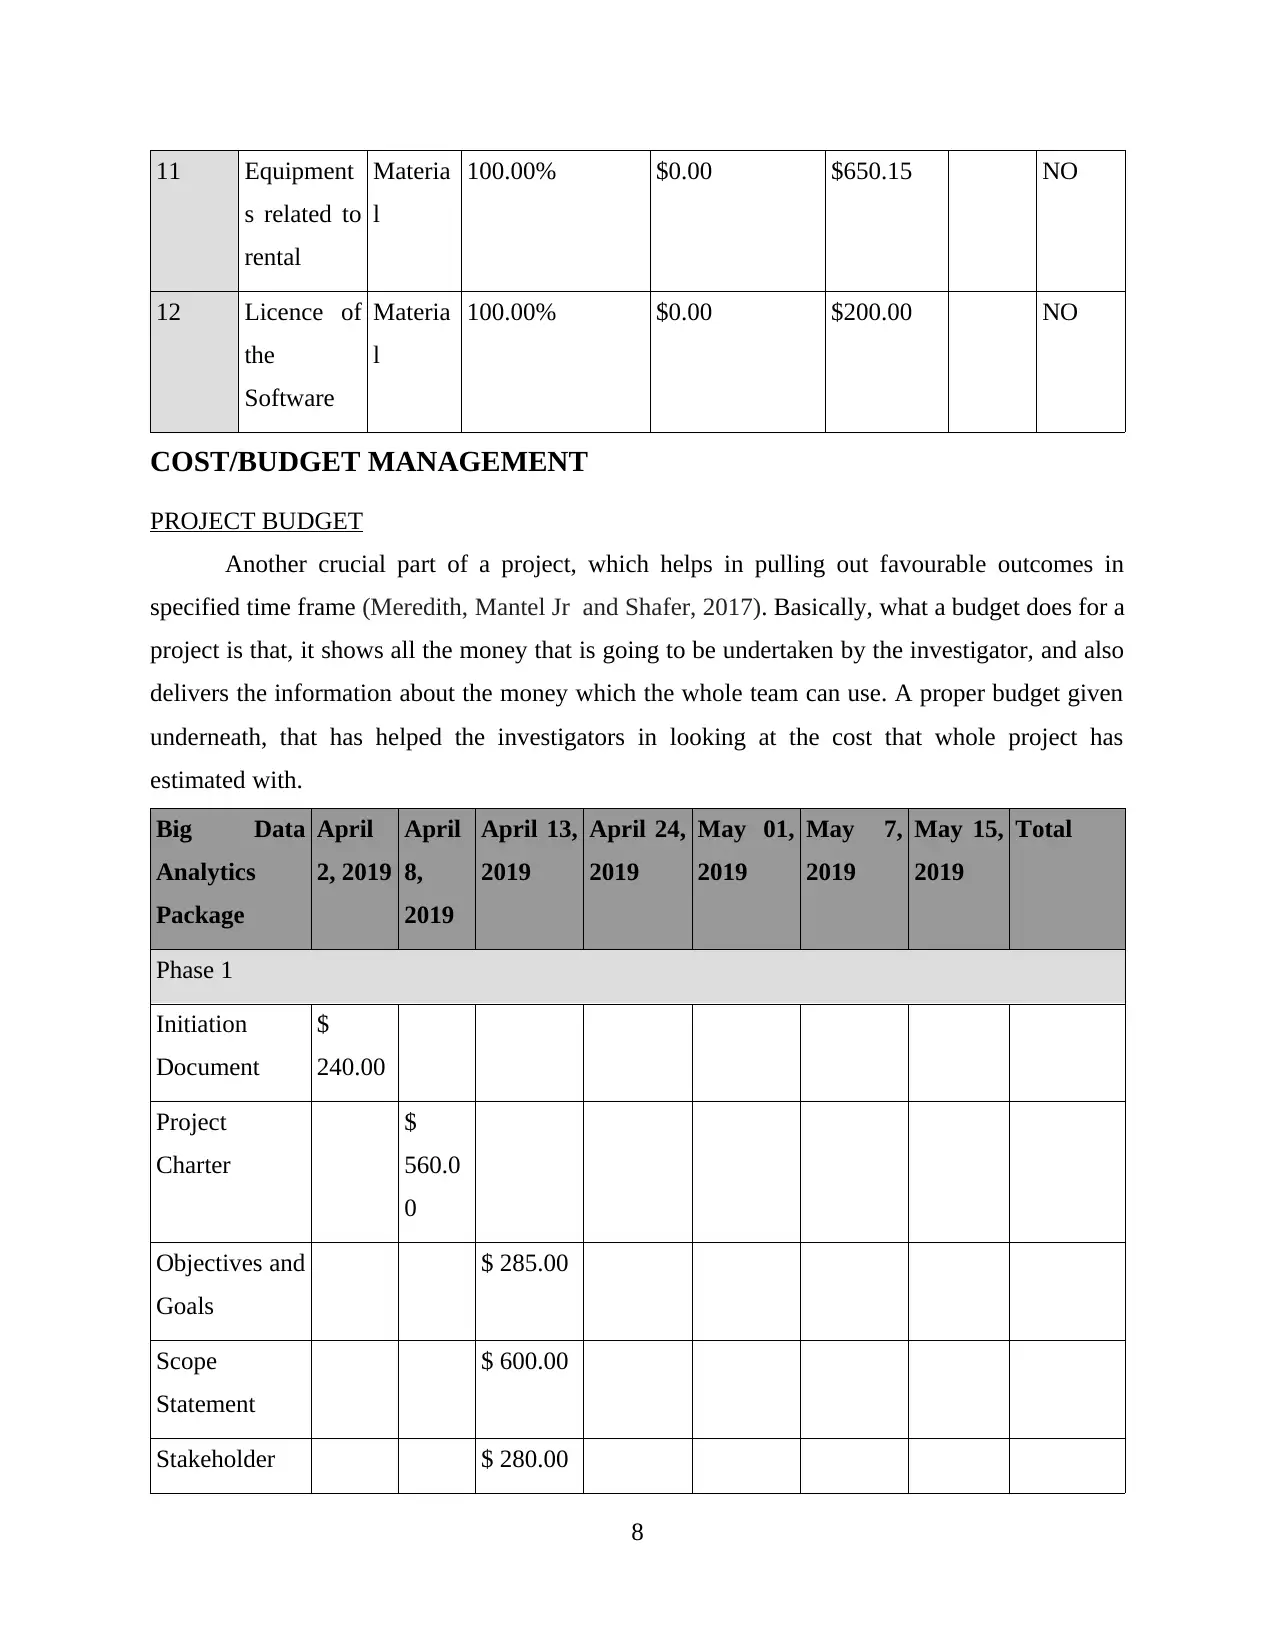
11 Equipment
s related to
rental
Materia
l
100.00% $0.00 $650.15 NO
12 Licence of
the
Software
Materia
l
100.00% $0.00 $200.00 NO
COST/BUDGET MANAGEMENT
PROJECT BUDGET
Another crucial part of a project, which helps in pulling out favourable outcomes in
specified time frame (Meredith, Mantel Jr and Shafer, 2017). Basically, what a budget does for a
project is that, it shows all the money that is going to be undertaken by the investigator, and also
delivers the information about the money which the whole team can use. A proper budget given
underneath, that has helped the investigators in looking at the cost that whole project has
estimated with.
Big Data
Analytics
Package
April
2, 2019
April
8,
2019
April 13,
2019
April 24,
2019
May 01,
2019
May 7,
2019
May 15,
2019
Total
Phase 1
Initiation
Document
$
240.00
Project
Charter
$
560.0
0
Objectives and
Goals
$ 285.00
Scope
Statement
$ 600.00
Stakeholder $ 280.00
8
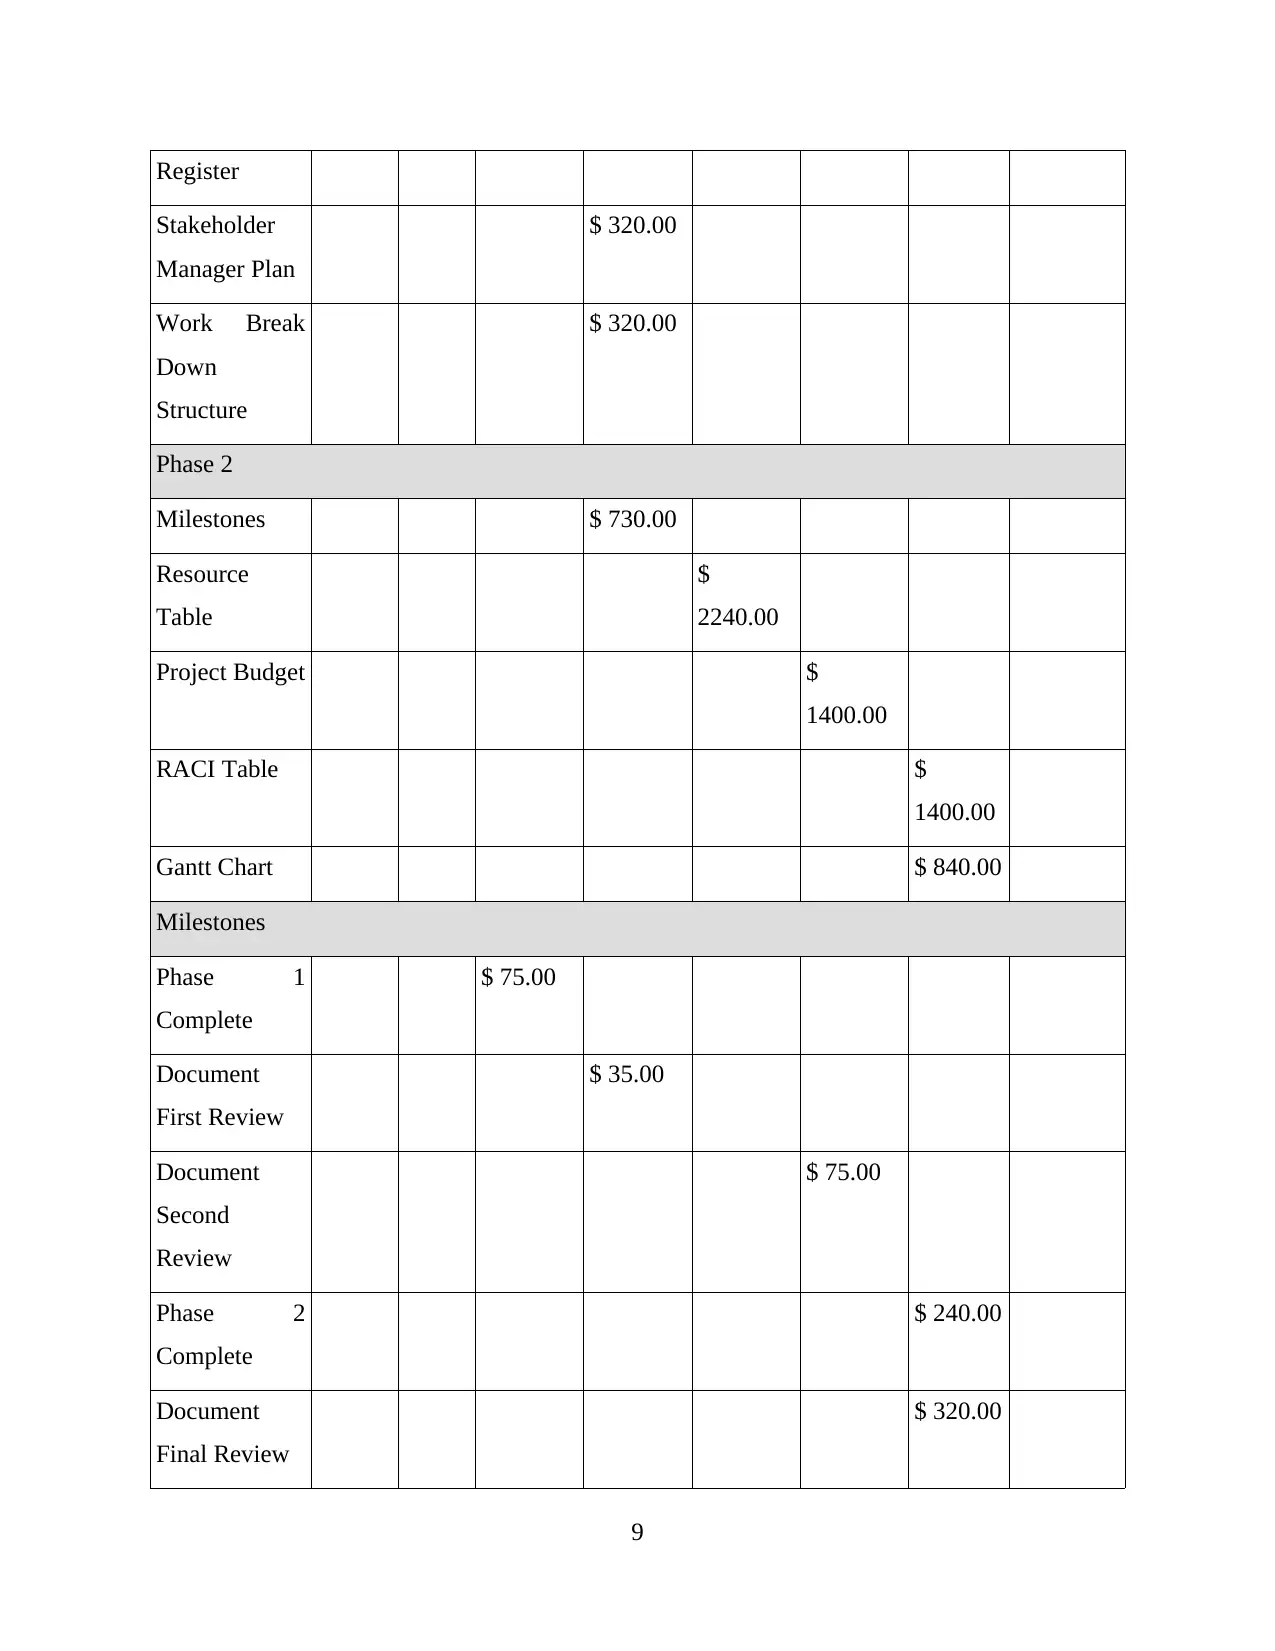
Register
Stakeholder
Manager Plan
$ 320.00
Work Break
Down
Structure
$ 320.00
Phase 2
Milestones $ 730.00
Resource
Table
$
2240.00
Project Budget $
1400.00
RACI Table $
1400.00
Gantt Chart $ 840.00
Milestones
Phase 1
Complete
$ 75.00
Document
First Review
$ 35.00
Document
Second
Review
$ 75.00
Phase 2
Complete
$ 240.00
Document
Final Review
$ 320.00
9
Stakeholder
Manager Plan
$ 320.00
Work Break
Down
Structure
$ 320.00
Phase 2
Milestones $ 730.00
Resource
Table
$
2240.00
Project Budget $
1400.00
RACI Table $
1400.00
Gantt Chart $ 840.00
Milestones
Phase 1
Complete
$ 75.00
Document
First Review
$ 35.00
Document
Second
Review
$ 75.00
Phase 2
Complete
$ 240.00
Document
Final Review
$ 320.00
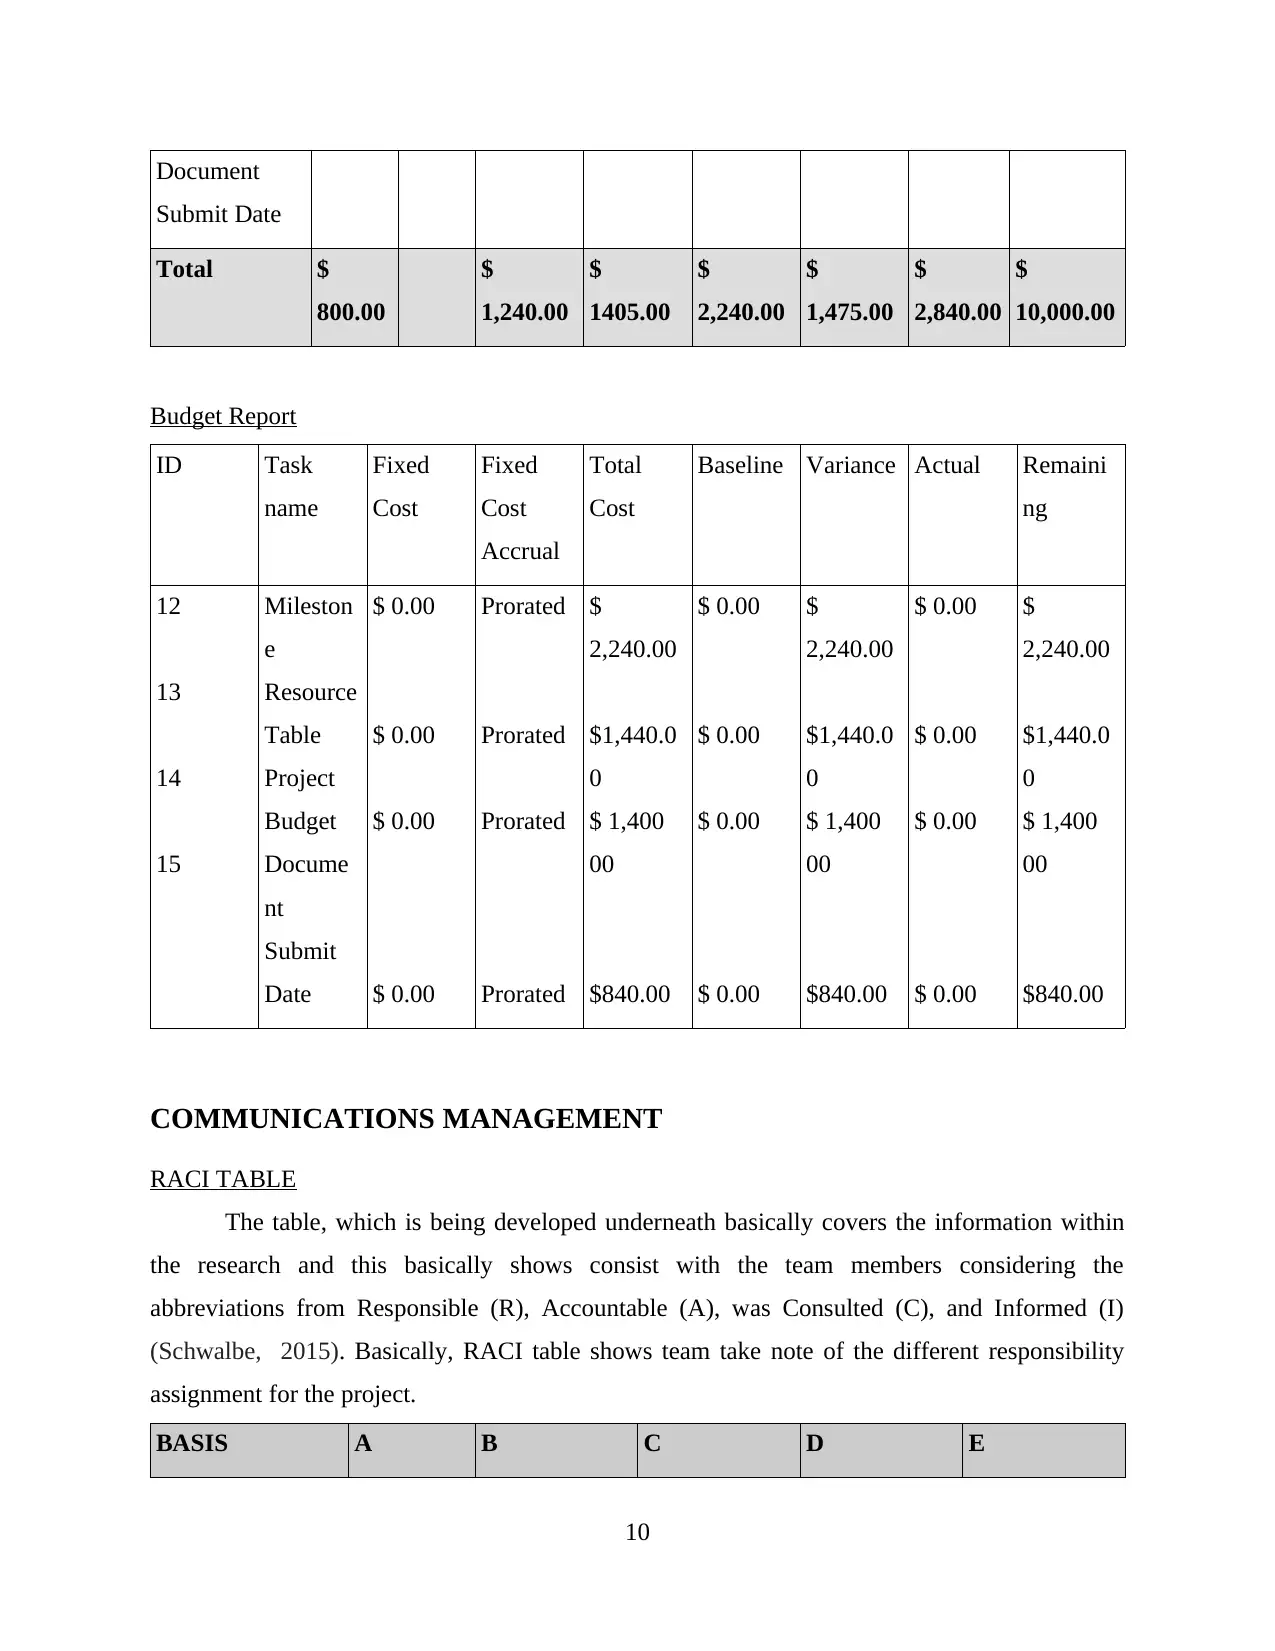
9
Document
Submit Date
Total $
800.00
$
1,240.00
$
1405.00
$
2,240.00
$
1,475.00
$
2,840.00
$
10,000.00
Budget Report
ID Task
name
Fixed
Cost
Fixed
Cost
Accrual
Total
Cost
Baseline Variance Actual Remaini
ng
12
13
14
15
Mileston
e
Resource
Table
Project
Budget
Docume
nt
Submit
Date
$ 0.00
$ 0.00
$ 0.00
$ 0.00
Prorated
Prorated
Prorated
Prorated
$
2,240.00
$1,440.0
0
$ 1,400
00
$840.00
$ 0.00
$ 0.00
$ 0.00
$ 0.00
$
2,240.00
$1,440.0
0
$ 1,400
00
$840.00
$ 0.00
$ 0.00
$ 0.00
$ 0.00
$
2,240.00
$1,440.0
0
$ 1,400
00
$840.00
COMMUNICATIONS MANAGEMENT
RACI TABLE
The table, which is being developed underneath basically covers the information within
the research and this basically shows consist with the team members considering the
abbreviations from Responsible (R), Accountable (A), was Consulted (C), and Informed (I)
(Schwalbe, 2015). Basically, RACI table shows team take note of the different responsibility
assignment for the project.
BASIS A B C D E
10
Paraphrase This Document
Need a fresh take? Get an instant paraphrase of this document with our AI Paraphraser
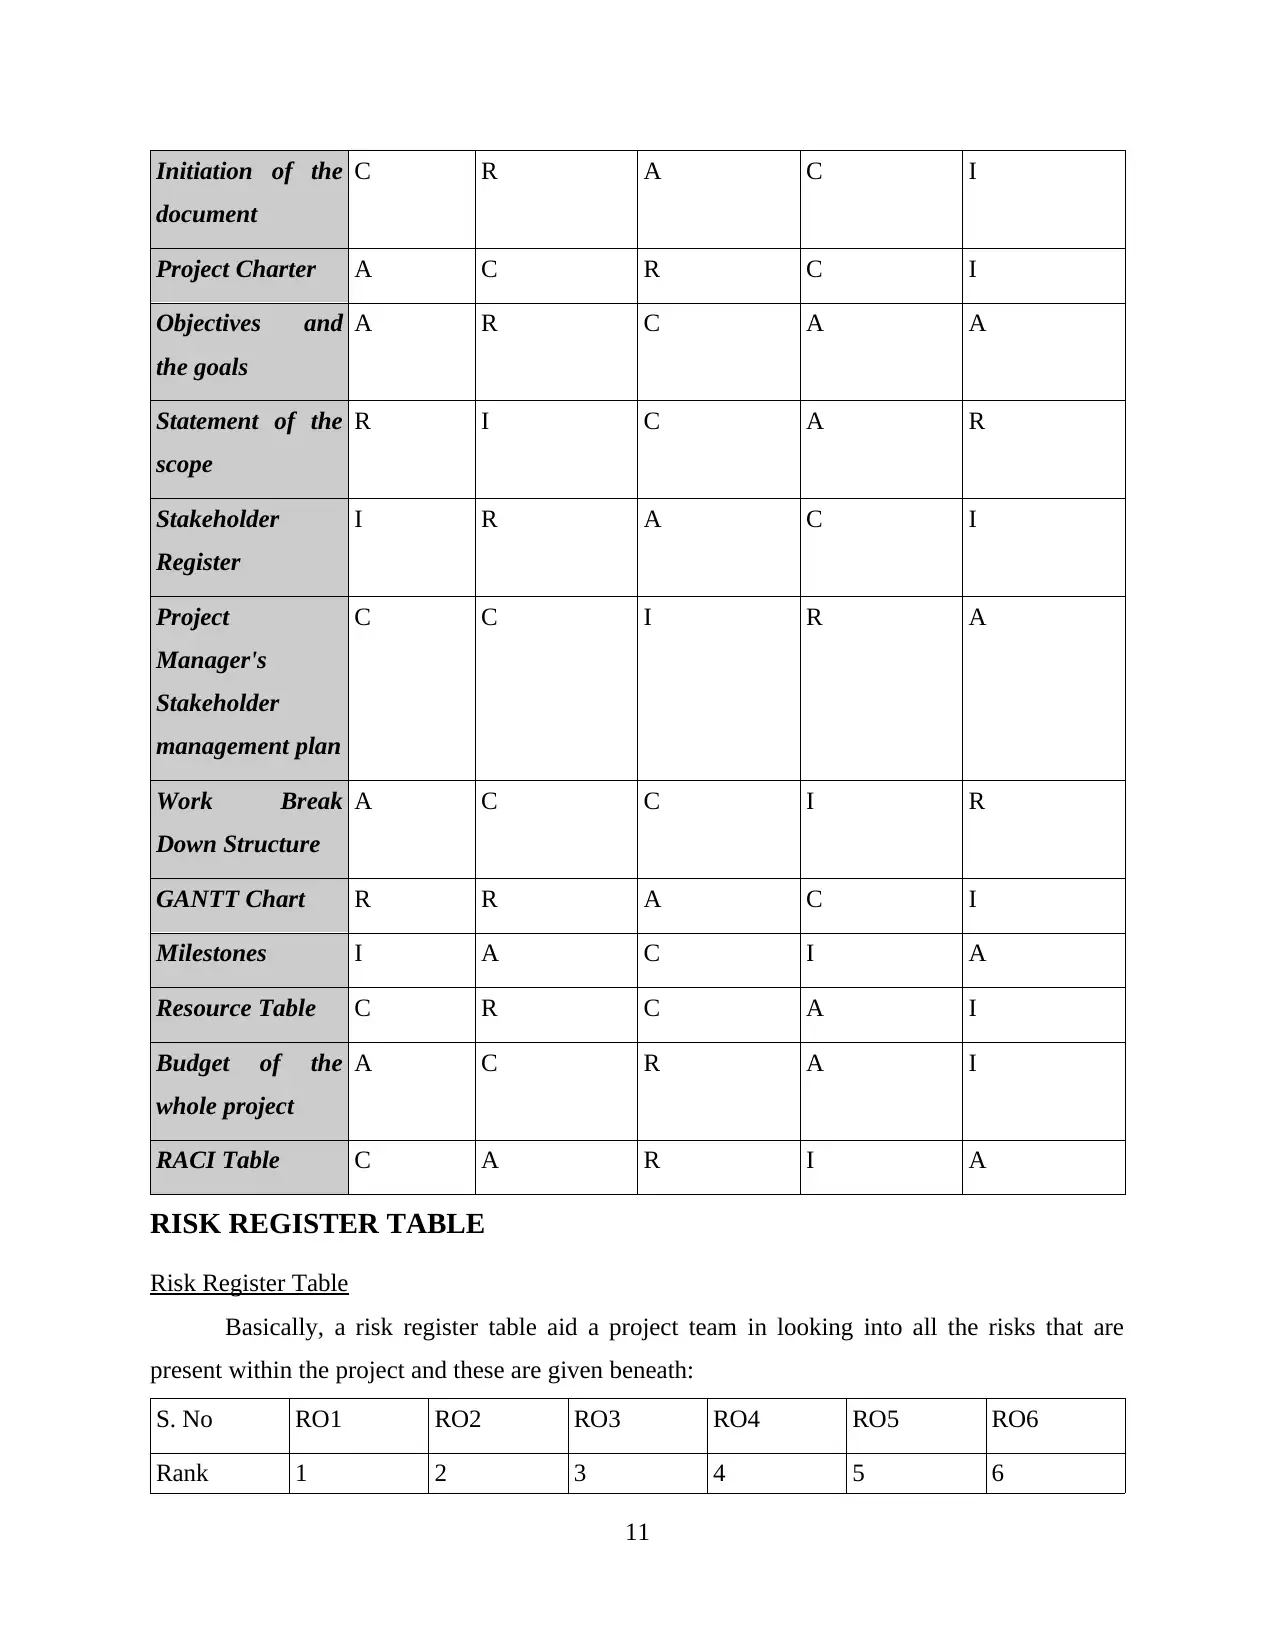
Initiation of the
document
C R A C I
Project Charter A C R C I
Objectives and
the goals
A R C A A
Statement of the
scope
R I C A R
Stakeholder
Register
I R A C I
Project
Manager's
Stakeholder
management plan
C C I R A
Work Break
Down Structure
A C C I R
GANTT Chart R R A C I
Milestones I A C I A
Resource Table C R C A I
Budget of the
whole project
A C R A I
RACI Table C A R I A
RISK REGISTER TABLE
Risk Register Table
Basically, a risk register table aid a project team in looking into all the risks that are
present within the project and these are given beneath:
S. No RO1 RO2 RO3 RO4 RO5 RO6
Rank 1 2 3 4 5 6
11
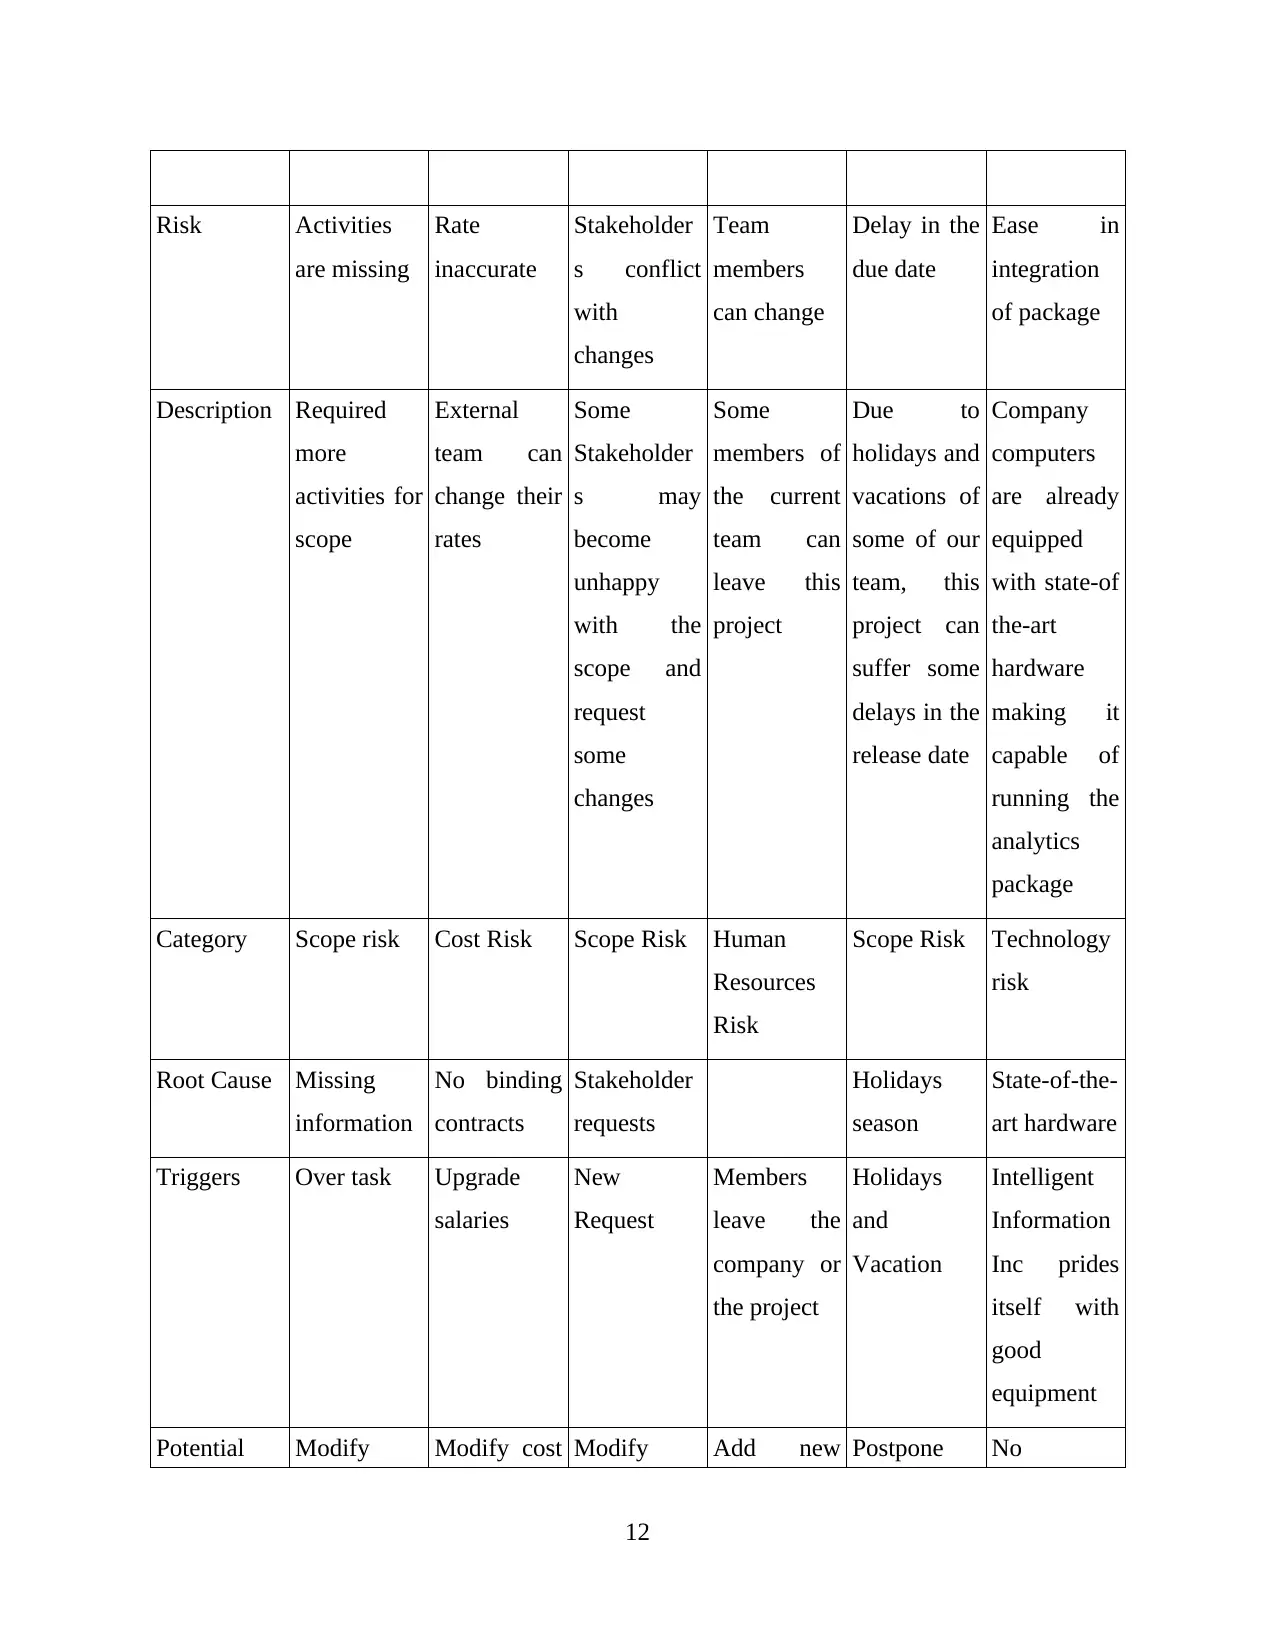
Risk Activities
are missing
Rate
inaccurate
Stakeholder
s conflict
with
changes
Team
members
can change
Delay in the
due date
Ease in
integration
of package
Description Required
more
activities for
scope
External
team can
change their
rates
Some
Stakeholder
s may
become
unhappy
with the
scope and
request
some
changes
Some
members of
the current
team can
leave this
project
Due to
holidays and
vacations of
some of our
team, this
project can
suffer some
delays in the
release date
Company
computers
are already
equipped
with state-of
the-art
hardware
making it
capable of
running the
analytics
package
Category Scope risk Cost Risk Scope Risk Human
Resources
Risk
Scope Risk Technology
risk
Root Cause Missing
information
No binding
contracts
Stakeholder
requests
Holidays
season
State-of-the-
art hardware
Triggers Over task Upgrade
salaries
New
Request
Members
leave the
company or
the project
Holidays
and
Vacation
Intelligent
Information
Inc prides
itself with
good
equipment
Potential Modify Modify cost Modify Add new Postpone No
12
Responses Scope document scope members deadline additional
cost needed
for
hardware
Risk
Owners
A C B D E C
Probability 50.00% 25.00% 40.00% 20.00% 6.00% 10.00%
Impact High Low Medium High Low High
Status Stand by Stand by Stand by Stand by Stand by Stand by
Probability and impact matrix
The probability and impact matrix is defined as an effective tool that helps an
organisation or project manager for converting the strategy into action. The probability or impact
matrix helps in analysing the relative positioning for impact on the vertical axis and relative
positioning for performance on the horizontal axis. If the project has higher value on the vertical
axis, then impact in the process is greater on the perception of value. The impact or probability
matrix is helpful in incorporating the different factors into strategic planning process. This helps
in identifying the aspects of the project which have greater impact on value of the company and
it provides a measure of current performance. An organisation can focus on project stakeholders,
projects managers and it is responsibility of the managers to prioritize the request of stakeholders
and analysing the impact of stakeholders on the project. This will lead to accomplish the project
without stakeholder conflict. The impact grid is shown below-
High
13
Secure Best Marks with AI Grader
Need help grading? Try our AI Grader for instant feedback on your assignments.
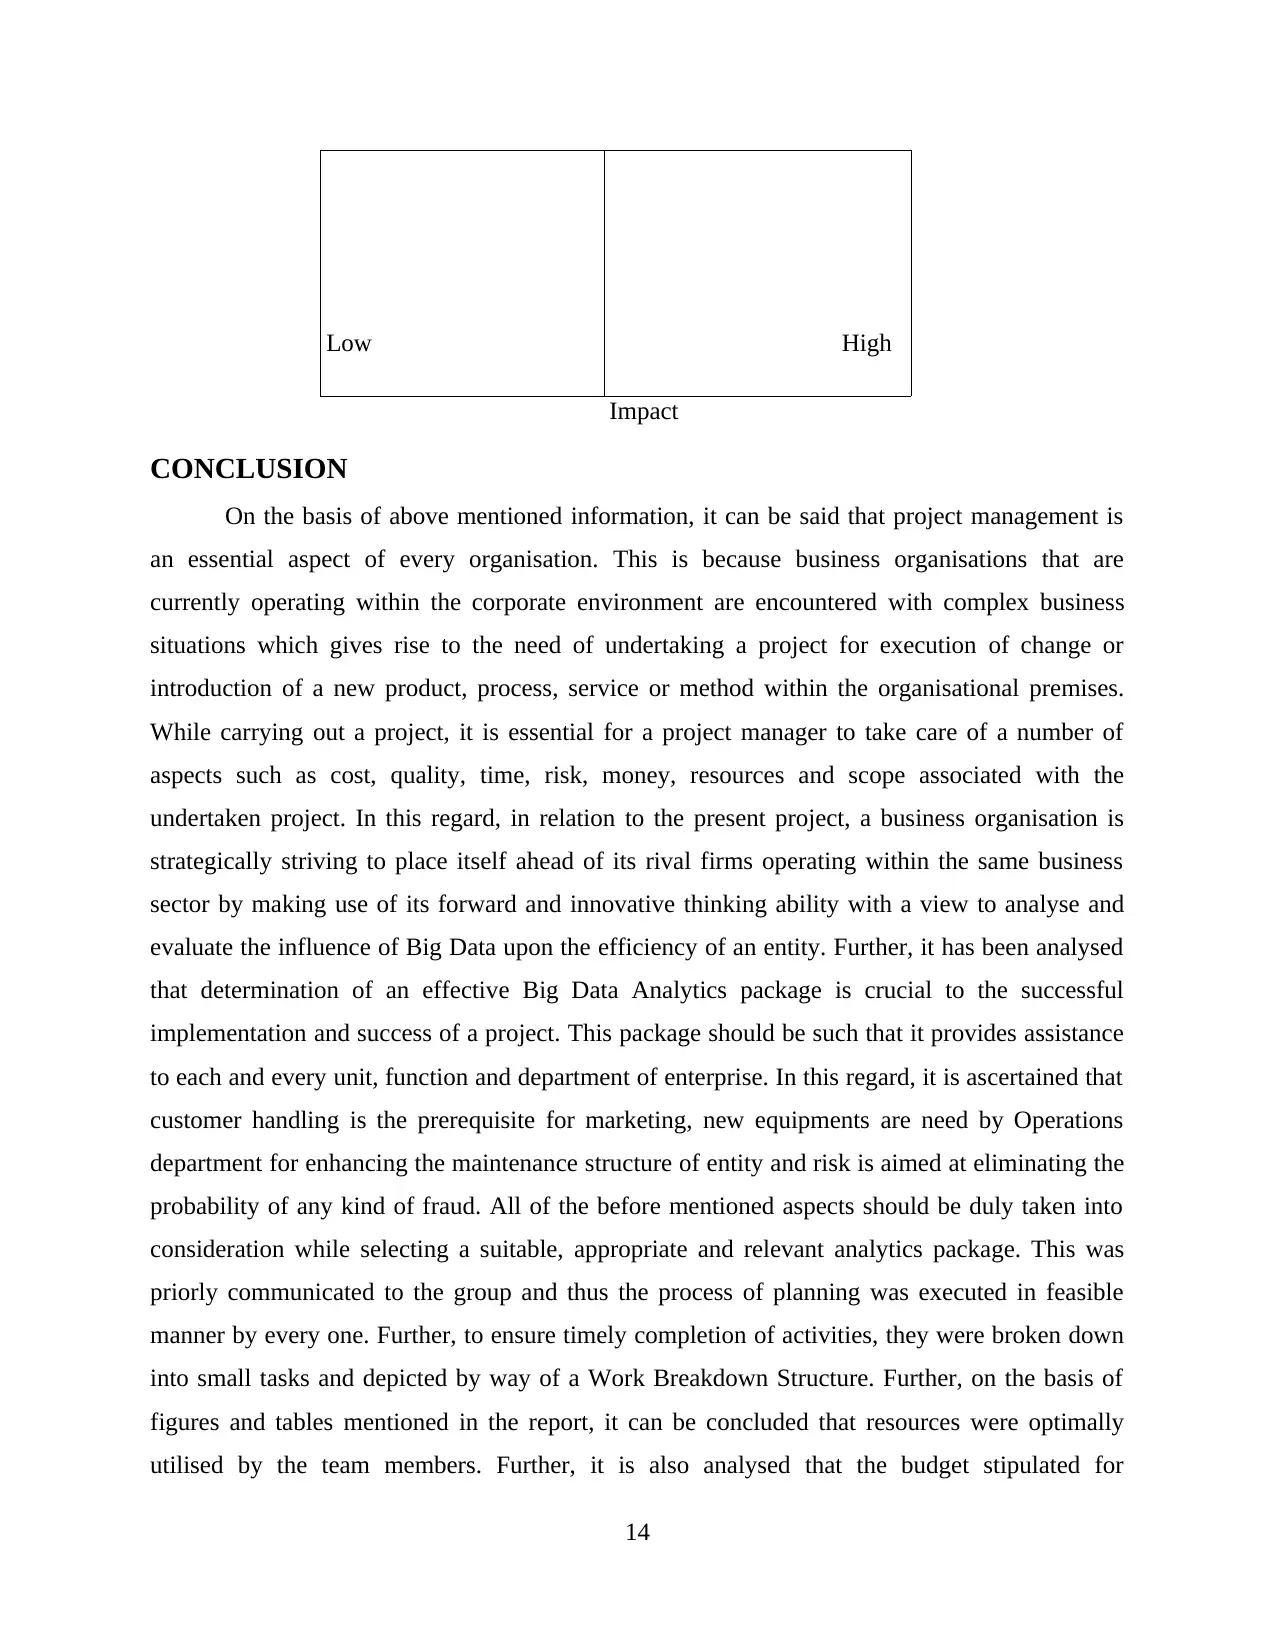
Low High
Impact
CONCLUSION
On the basis of above mentioned information, it can be said that project management is
an essential aspect of every organisation. This is because business organisations that are
currently operating within the corporate environment are encountered with complex business
situations which gives rise to the need of undertaking a project for execution of change or
introduction of a new product, process, service or method within the organisational premises.
While carrying out a project, it is essential for a project manager to take care of a number of
aspects such as cost, quality, time, risk, money, resources and scope associated with the
undertaken project. In this regard, in relation to the present project, a business organisation is
strategically striving to place itself ahead of its rival firms operating within the same business
sector by making use of its forward and innovative thinking ability with a view to analyse and
evaluate the influence of Big Data upon the efficiency of an entity. Further, it has been analysed
that determination of an effective Big Data Analytics package is crucial to the successful
implementation and success of a project. This package should be such that it provides assistance
to each and every unit, function and department of enterprise. In this regard, it is ascertained that
customer handling is the prerequisite for marketing, new equipments are need by Operations
department for enhancing the maintenance structure of entity and risk is aimed at eliminating the
probability of any kind of fraud. All of the before mentioned aspects should be duly taken into
consideration while selecting a suitable, appropriate and relevant analytics package. This was
priorly communicated to the group and thus the process of planning was executed in feasible
manner by every one. Further, to ensure timely completion of activities, they were broken down
into small tasks and depicted by way of a Work Breakdown Structure. Further, on the basis of
figures and tables mentioned in the report, it can be concluded that resources were optimally
utilised by the team members. Further, it is also analysed that the budget stipulated for
14

successfully executing this project was sufficient to fulfil the needs and demands of every
member in relation to resources and equipments.
15
member in relation to resources and equipments.
15
1 out of 18
Related Documents


Your All-in-One AI-Powered Toolkit for Academic Success.
+13062052269
info@desklib.com
Available 24*7 on WhatsApp / Email
![[object Object]](/_next/static/media/star-bottom.7253800d.svg)
Unlock your academic potential
© 2024 | Zucol Services PVT LTD | All rights reserved.