Project Management and Budget Analysis

Verified

Added on  2020/03/04

|6
|651
|34
AI Summary
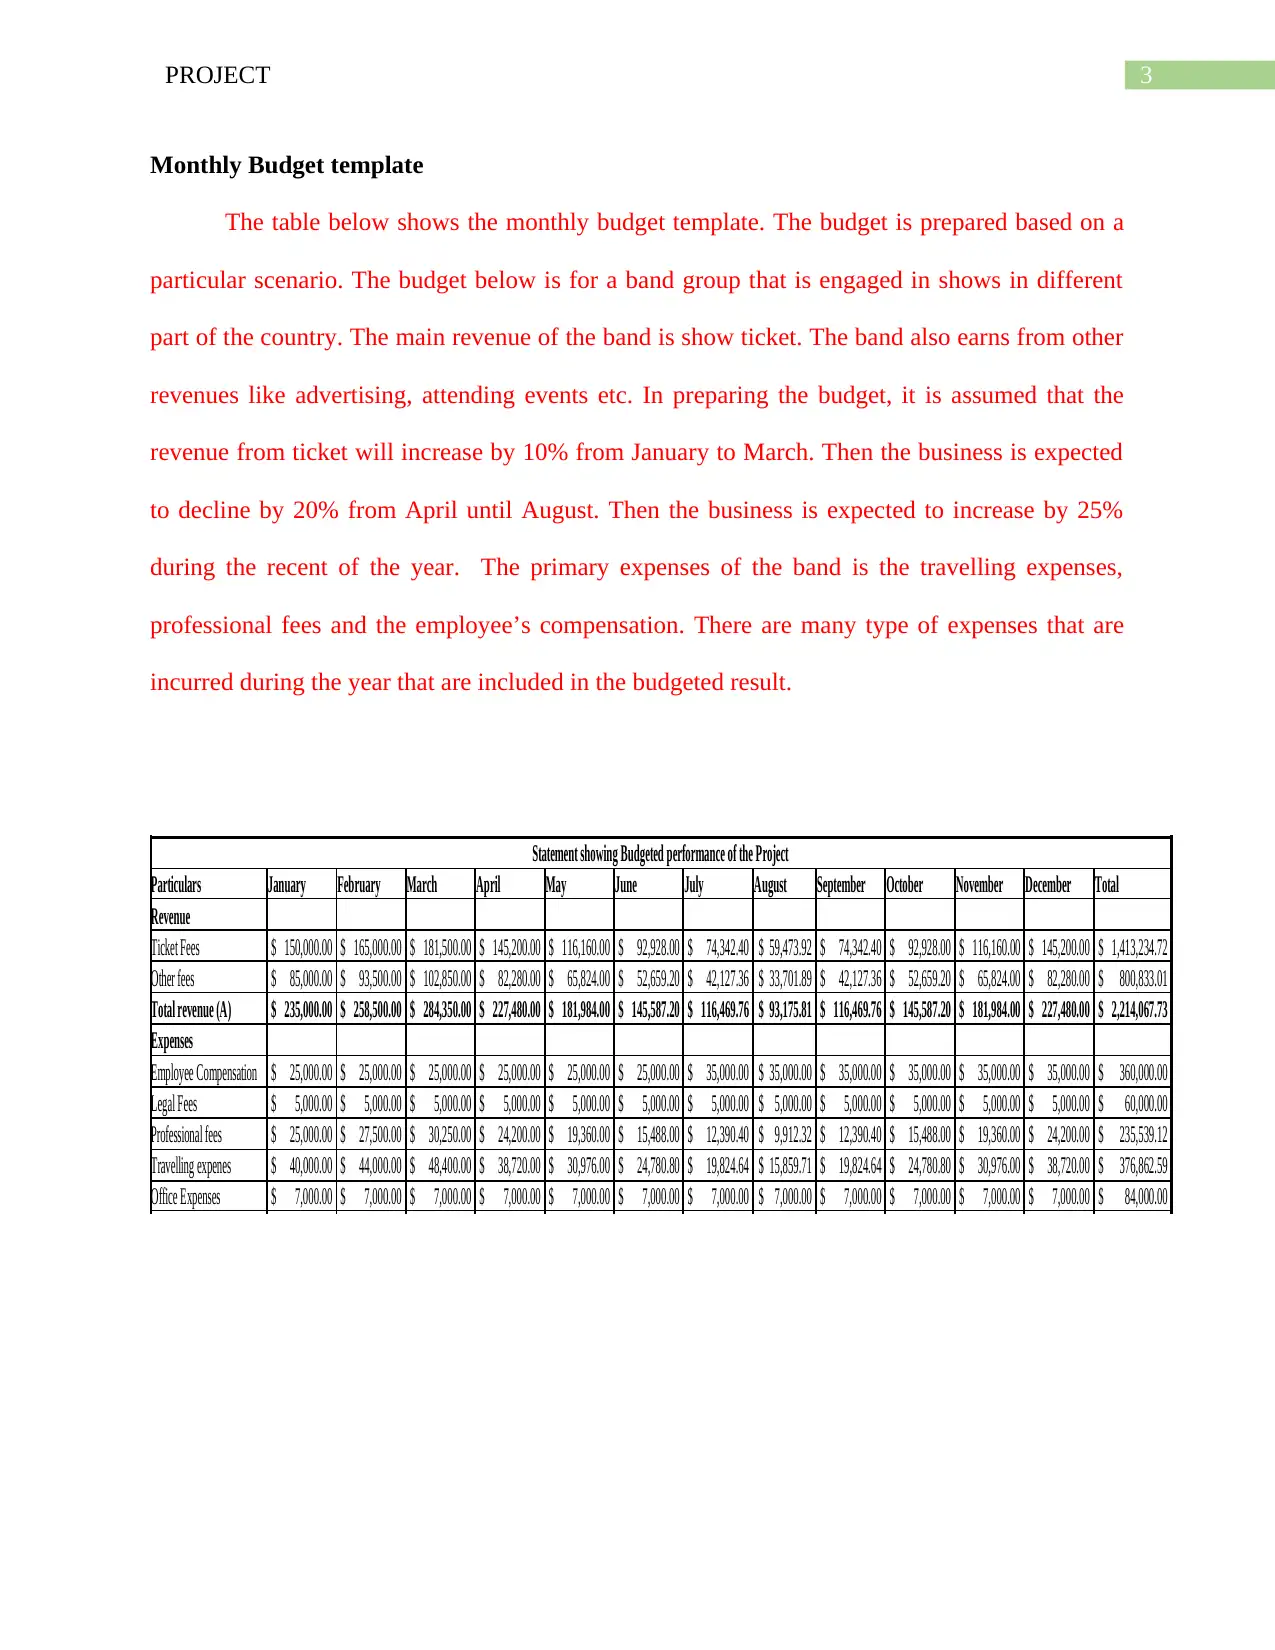
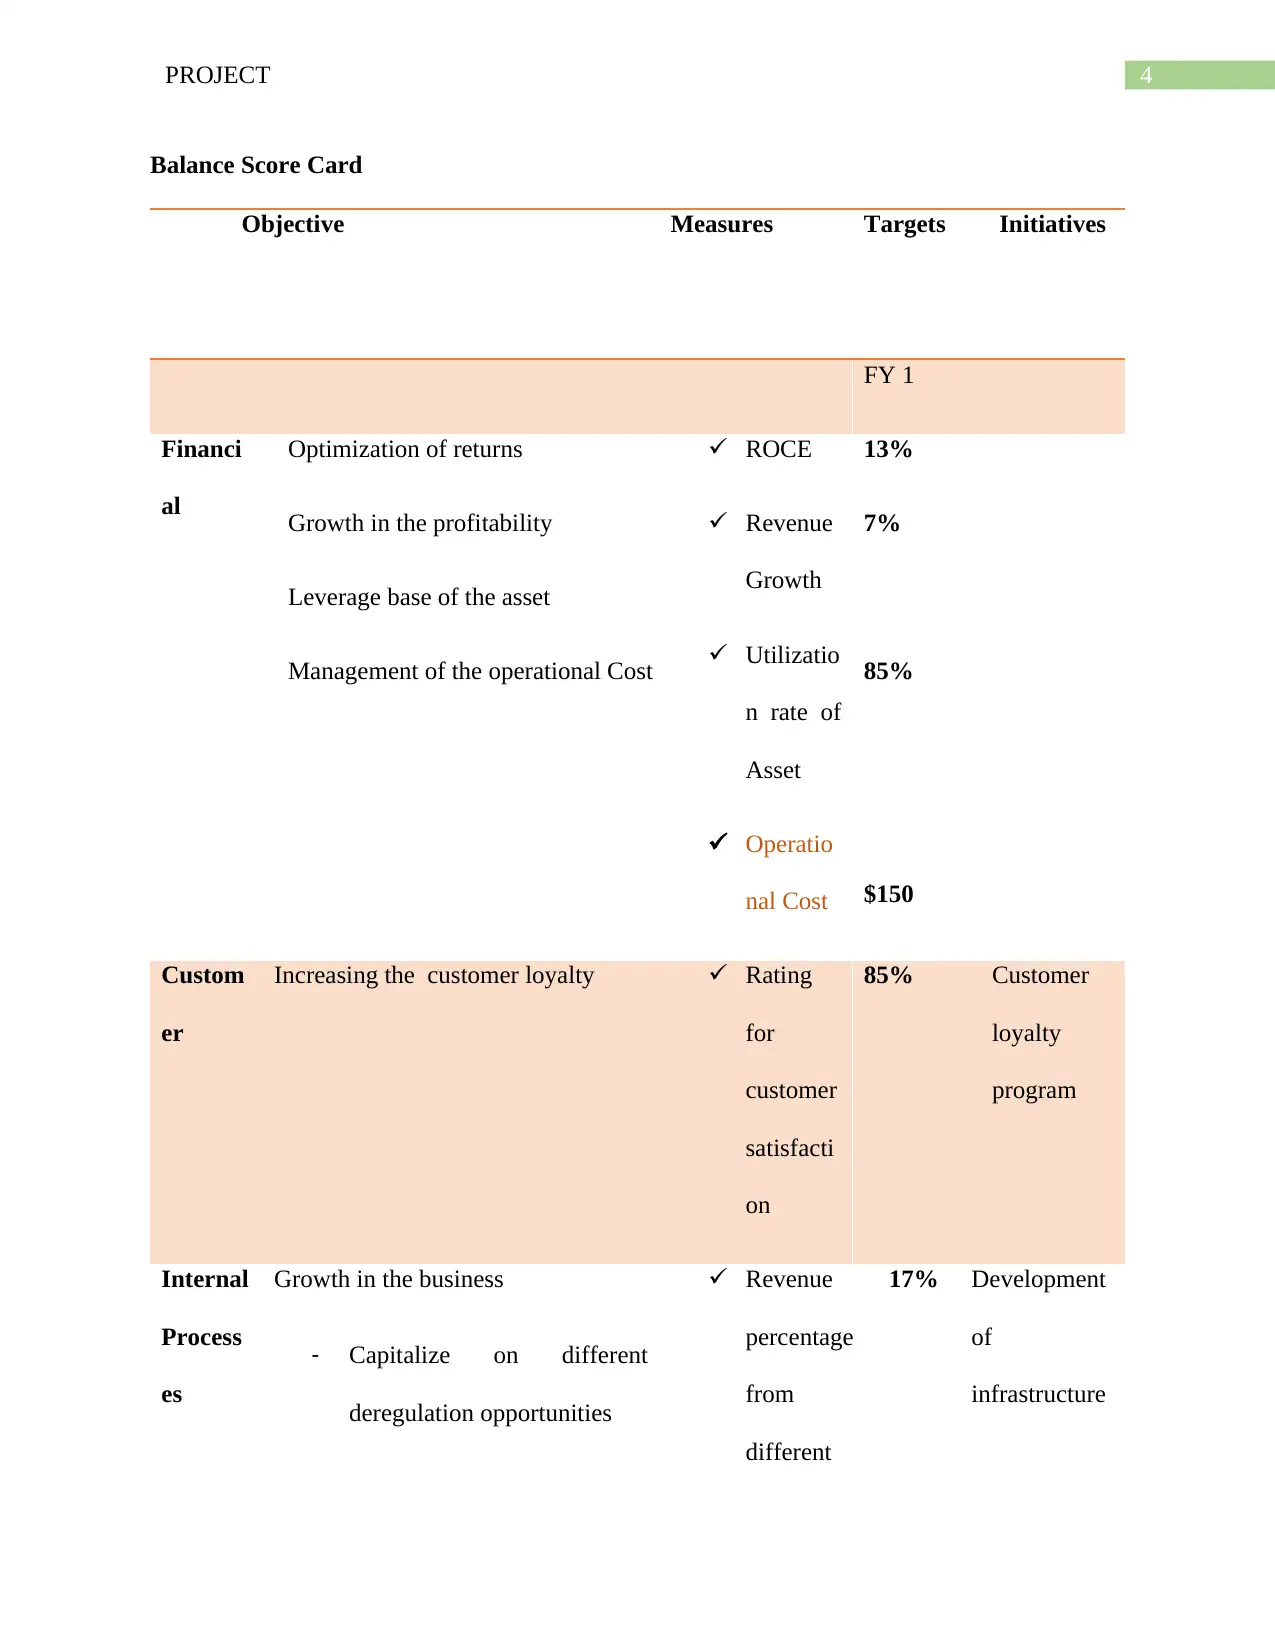
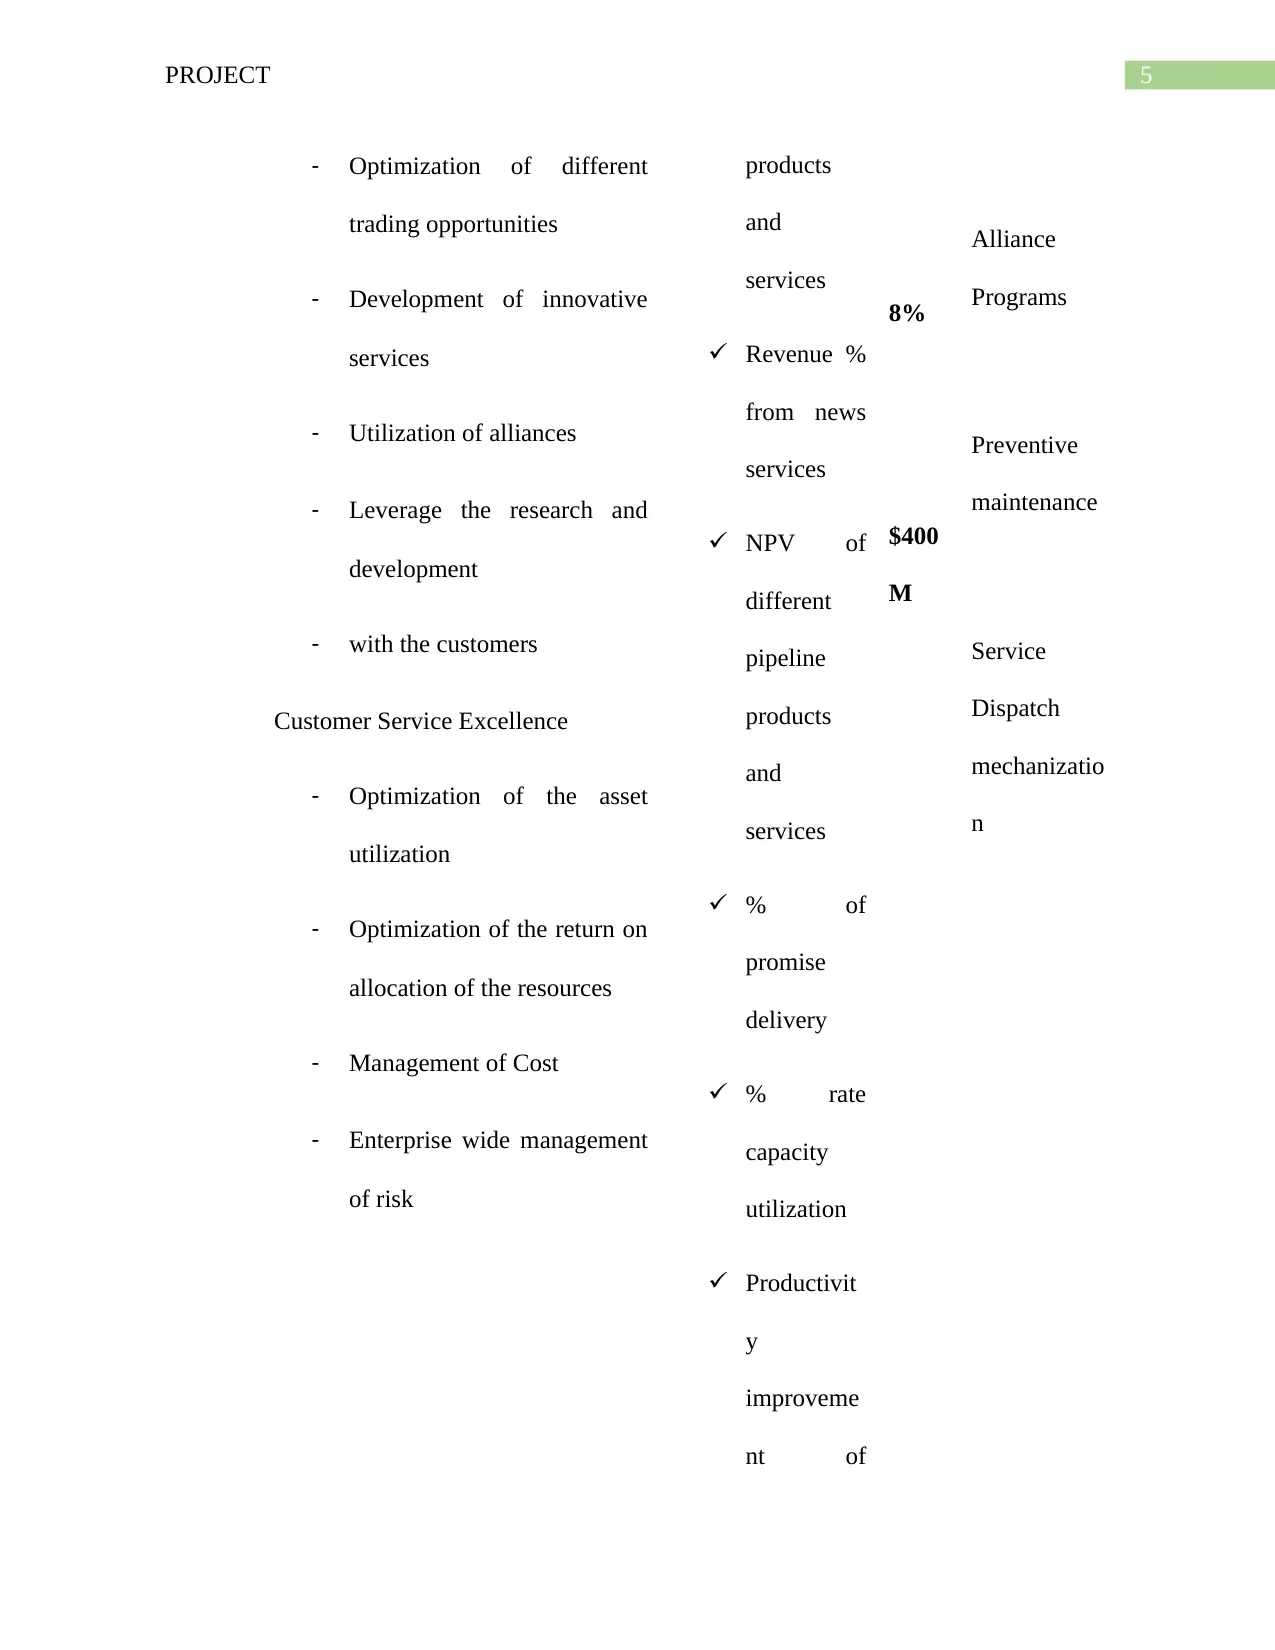
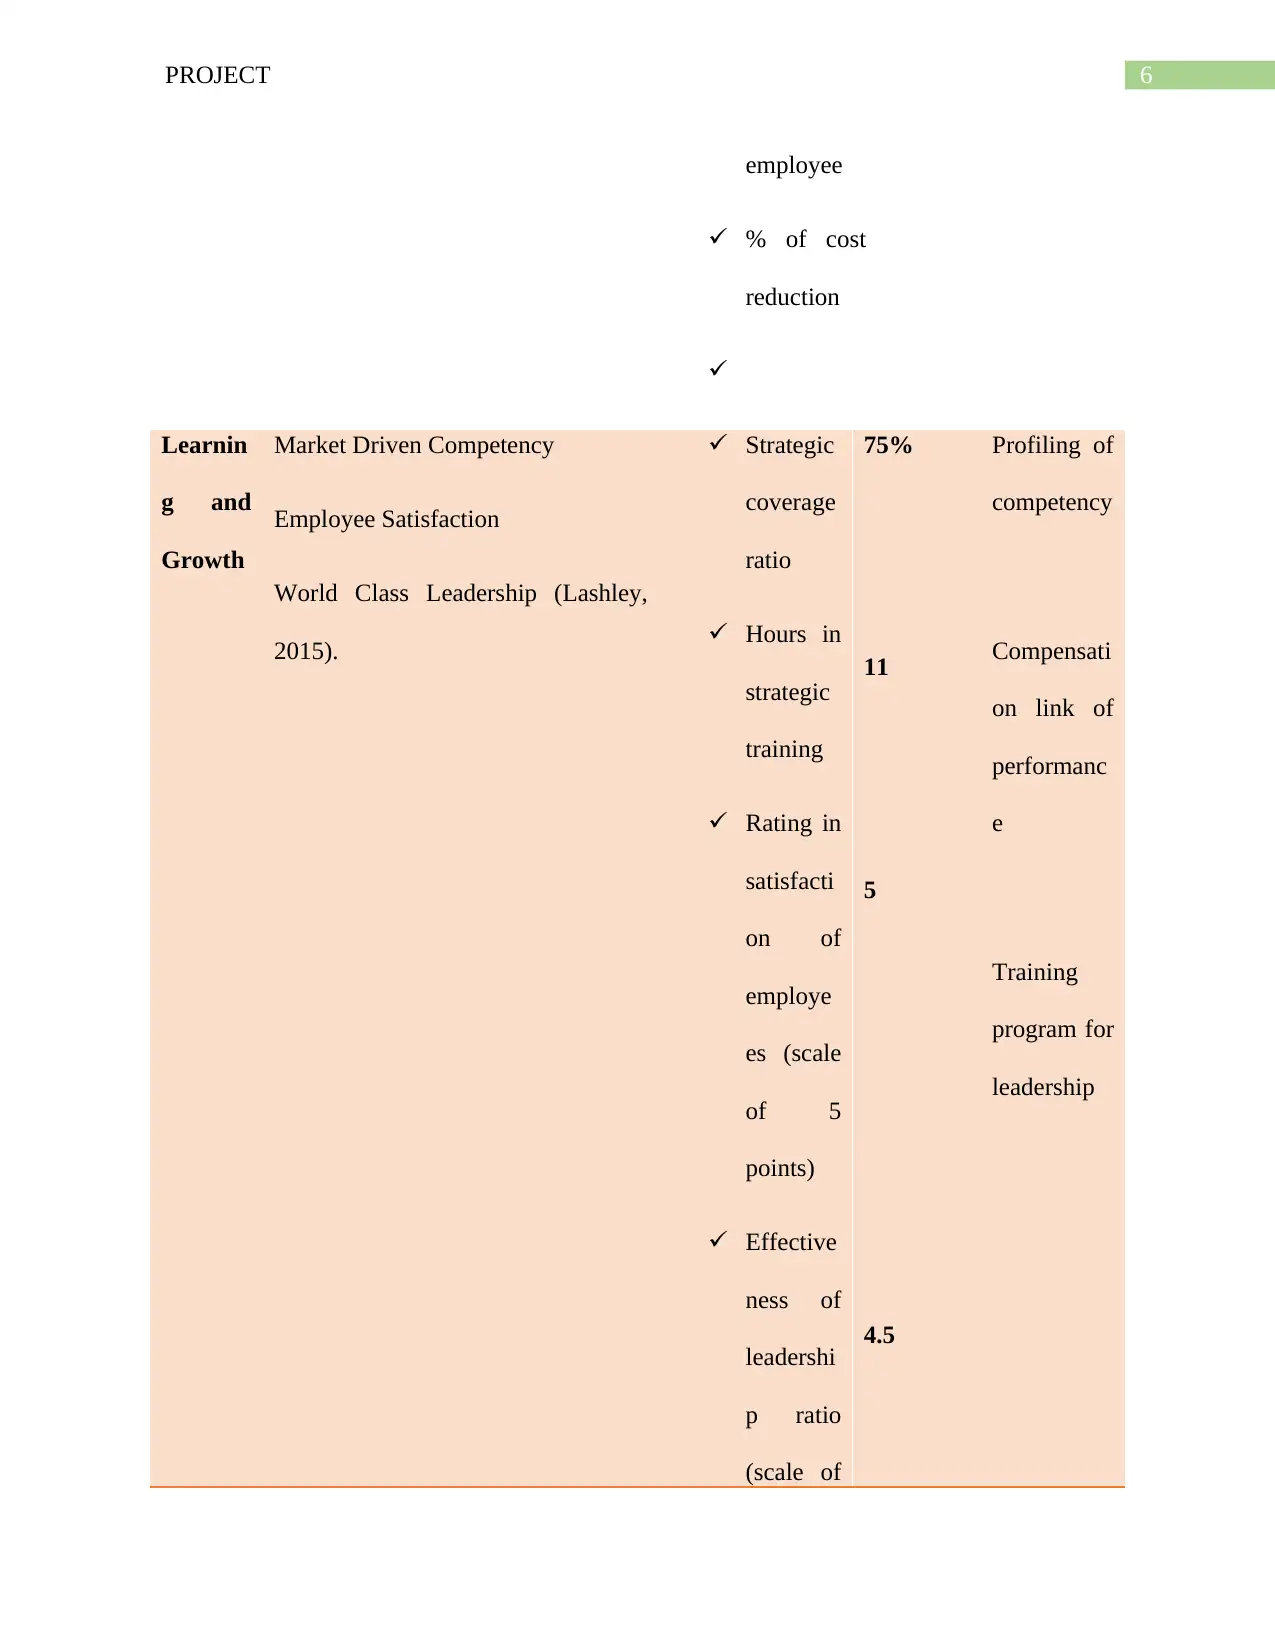
This project focuses on demonstrating understanding of project management principles. It includes a monthly budget template for a band group, incorporating revenue projections and expense estimations based on various factors like show ticket sales, advertising, and operational costs. Additionally, the assignment presents a Balance Score Card outlining key performance indicators (KPIs) across four perspectives: Financial, Customer, Internal Processes, and Learning & Growth. The KPIs are accompanied by targets and initiatives to achieve desired outcomes.
tabler-icon-diamond-filled.svg

Contribute Materials

Your contribution can guide someone’s learning journey. Share your documents today.
Document Page
Running head: PROJECT
Project
Name of the Student:
Name of the University:
Authors Note:
tabler-icon-diamond-filled.svg

Secure Best Marks with AI Grader

Need help grading? Try our AI Grader for instant feedback on your assignments.
Document Page
2PROJECT
Table of Contents
Monthly Budget template................................................................................................................3
Balance Score Card..........................................................................................................................3
Reference.........................................................................................................................................8
Document Page
3PROJECT
Monthly Budget template
The table below shows the monthly budget template. The budget is prepared based on a
particular scenario. The budget below is for a band group that is engaged in shows in different
part of the country. The main revenue of the band is show ticket. The band also earns from other
revenues like advertising, attending events etc. In preparing the budget, it is assumed that the
revenue from ticket will increase by 10% from January to March. Then the business is expected
to decline by 20% from April until August. Then the business is expected to increase by 25%
during the recent of the year. The primary expenses of the band is the travelling expenses,
professional fees and the employee’s compensation. There are many type of expenses that are
incurred during the year that are included in the budgeted result.
Statement showing Budgeted performance of the Project
Particulars January February March April May June July August September October November December Total
Revenue
Ticket Fees $ 150,000.00 $ 165,000.00 $ 181,500.00 $ 145,200.00 $ 116,160.00 $ 92,928.00 $ 74,342.40 $ 59,473.92 $ 74,342.40 $ 92,928.00 $ 116,160.00 $ 145,200.00 $ 1,413,234.72
Other fees $ 85,000.00 $ 93,500.00 $ 102,850.00 $ 82,280.00 $ 65,824.00 $ 52,659.20 $ 42,127.36 $ 33,701.89 $ 42,127.36 $ 52,659.20 $ 65,824.00 $ 82,280.00 $ 800,833.01
Total revenue (A) $ 235,000.00 $ 258,500.00 $ 284,350.00 $ 227,480.00 $ 181,984.00 $ 145,587.20 $ 116,469.76 $ 93,175.81 $ 116,469.76 $ 145,587.20 $ 181,984.00 $ 227,480.00 $ 2,214,067.73
Expenses
Employee Compensation $ 25,000.00 $ 25,000.00 $ 25,000.00 $ 25,000.00 $ 25,000.00 $ 25,000.00 $ 35,000.00 $ 35,000.00 $ 35,000.00 $ 35,000.00 $ 35,000.00 $ 35,000.00 $ 360,000.00
Legal Fees $ 5,000.00 $ 5,000.00 $ 5,000.00 $ 5,000.00 $ 5,000.00 $ 5,000.00 $ 5,000.00 $ 5,000.00 $ 5,000.00 $ 5,000.00 $ 5,000.00 $ 5,000.00 $ 60,000.00
Professional fees $ 25,000.00 $ 27,500.00 $ 30,250.00 $ 24,200.00 $ 19,360.00 $ 15,488.00 $ 12,390.40 $ 9,912.32 $ 12,390.40 $ 15,488.00 $ 19,360.00 $ 24,200.00 $ 235,539.12
Travelling expenes $ 40,000.00 $ 44,000.00 $ 48,400.00 $ 38,720.00 $ 30,976.00 $ 24,780.80 $ 19,824.64 $ 15,859.71 $ 19,824.64 $ 24,780.80 $ 30,976.00 $ 38,720.00 $ 376,862.59
Office Expenses $ 7,000.00 $ 7,000.00 $ 7,000.00 $ 7,000.00 $ 7,000.00 $ 7,000.00 $ 7,000.00 $ 7,000.00 $ 7,000.00 $ 7,000.00 $ 7,000.00 $ 7,000.00 $ 84,000.00
Document Page
4PROJECT
Balance Score Card
Objective Measures Targets Initiatives
FY 1
Financi
al
Optimization of returns
Growth in the profitability
Leverage base of the asset
Management of the operational Cost
ROCE
Revenue
Growth
Utilizatio
n rate of
Asset
Operatio
nal Cost
13%
7%
85%
$150
Custom
er
Increasing the customer loyalty Rating
for
customer
satisfacti
on
85% Customer
loyalty
program
Internal
Process
es
Growth in the business
- Capitalize on different
deregulation opportunities
Revenue
percentage
from
different
17% Development
of
infrastructure
tabler-icon-diamond-filled.svg

Secure Best Marks with AI Grader

Need help grading? Try our AI Grader for instant feedback on your assignments.
Document Page
5PROJECT
- Optimization of different
trading opportunities
- Development of innovative
services
- Utilization of alliances
- Leverage the research and
development
- with the customers
Customer Service Excellence
- Optimization of the asset
utilization
- Optimization of the return on
allocation of the resources
- Management of Cost
- Enterprise wide management
of risk
products
and
services
Revenue %
from news
services
NPV of
different
pipeline
products
and
services
% of
promise
delivery
% rate
capacity
utilization
Productivit
y
improveme
nt of
8%
$400
M
Alliance
Programs
Preventive
maintenance
Service
Dispatch
mechanizatio
n
Document Page
6PROJECT
employee
% of cost
reduction

Learnin
g and
Growth
Market Driven Competency
Employee Satisfaction
World Class Leadership (Lashley,
2015).
Strategic
coverage
ratio
Hours in
strategic
training
Rating in
satisfacti
on of
employe
es (scale
of 5
points)
Effective
ness of
leadershi
p ratio
(scale of
75%
11
5
4.5
Profiling of
competency
Compensati
on link of
performanc
e
Training
program for
leadership
chevron_up_icon
1 out of 6
circle_padding
hide_on_mobile
zoom_out_icon
[object Object]

Your All-in-One AI-Powered Toolkit for Academic Success.

Available 24*7 on WhatsApp / Email

[object Object]