Correlation and ANOVA Analysis of Child Data
VerifiedAdded on 2020/04/15
|10
|1611
|112
AI Summary
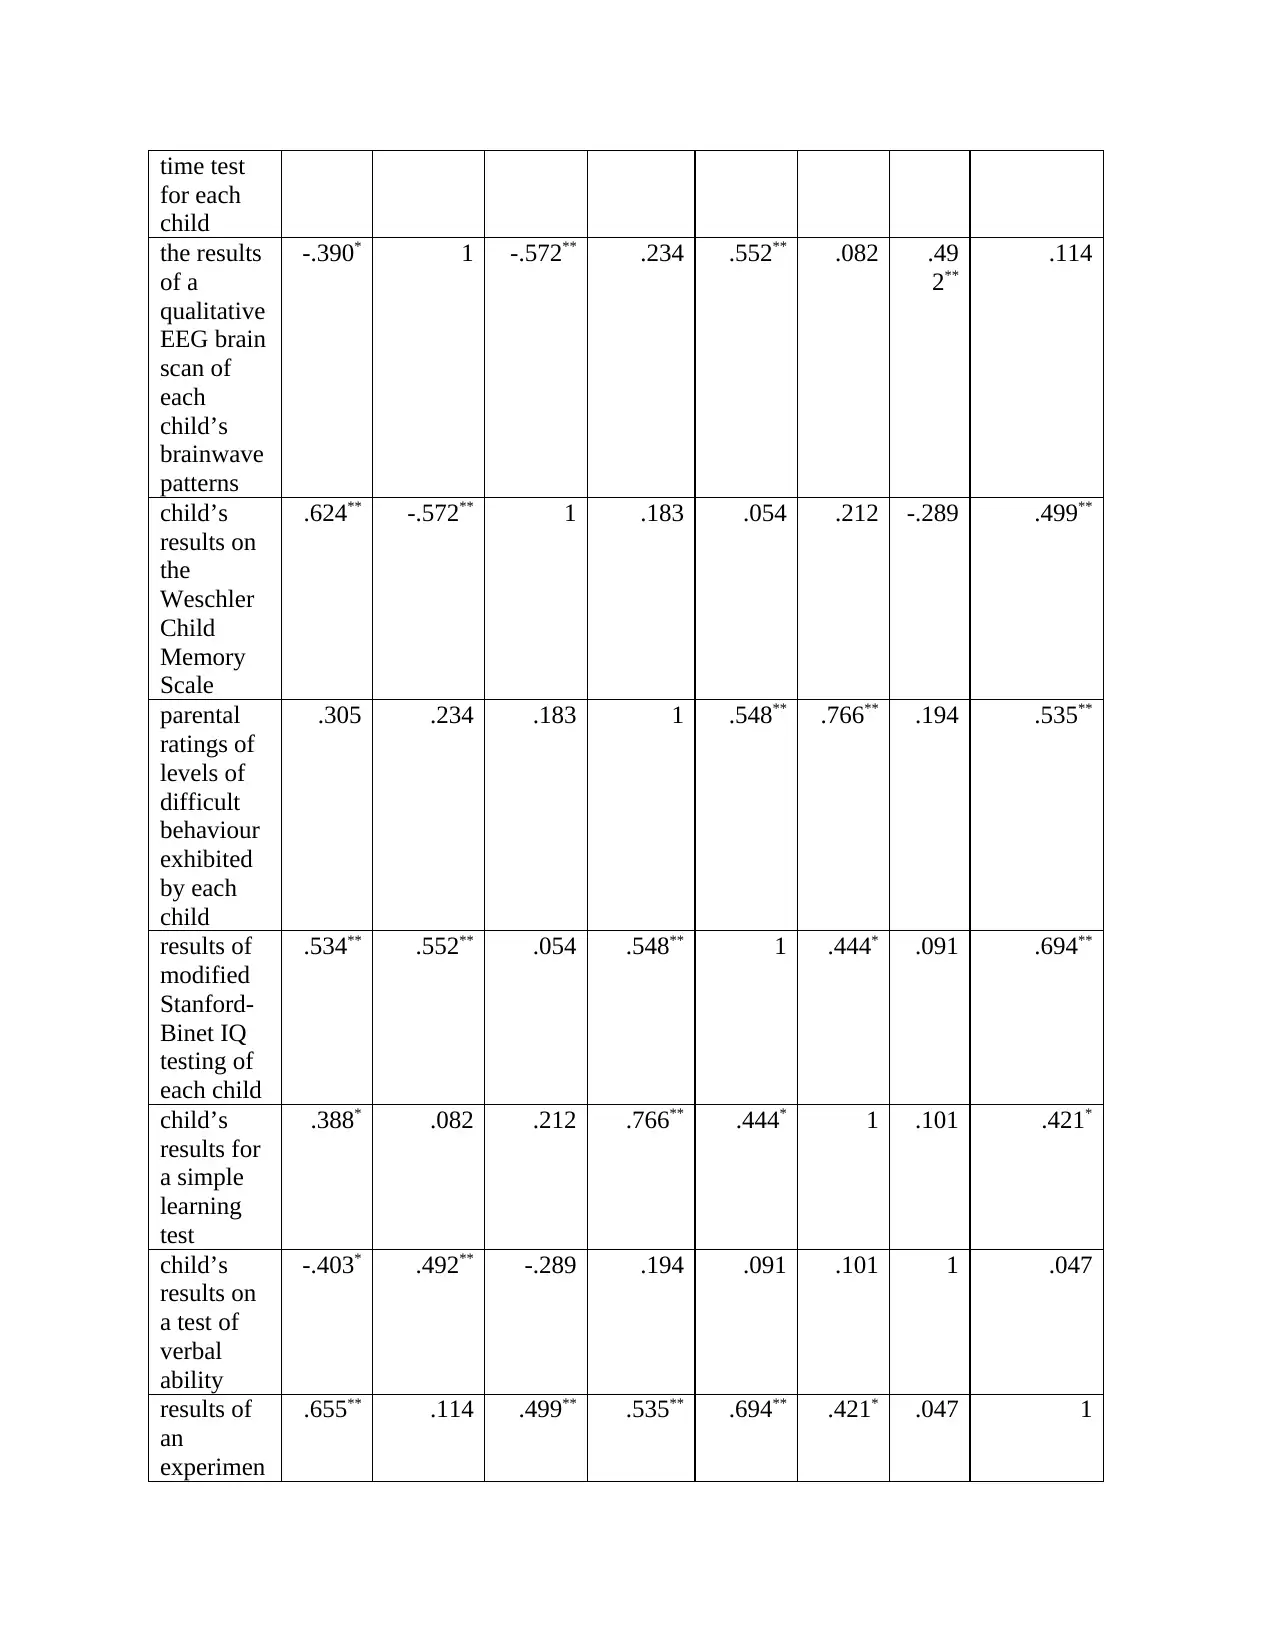
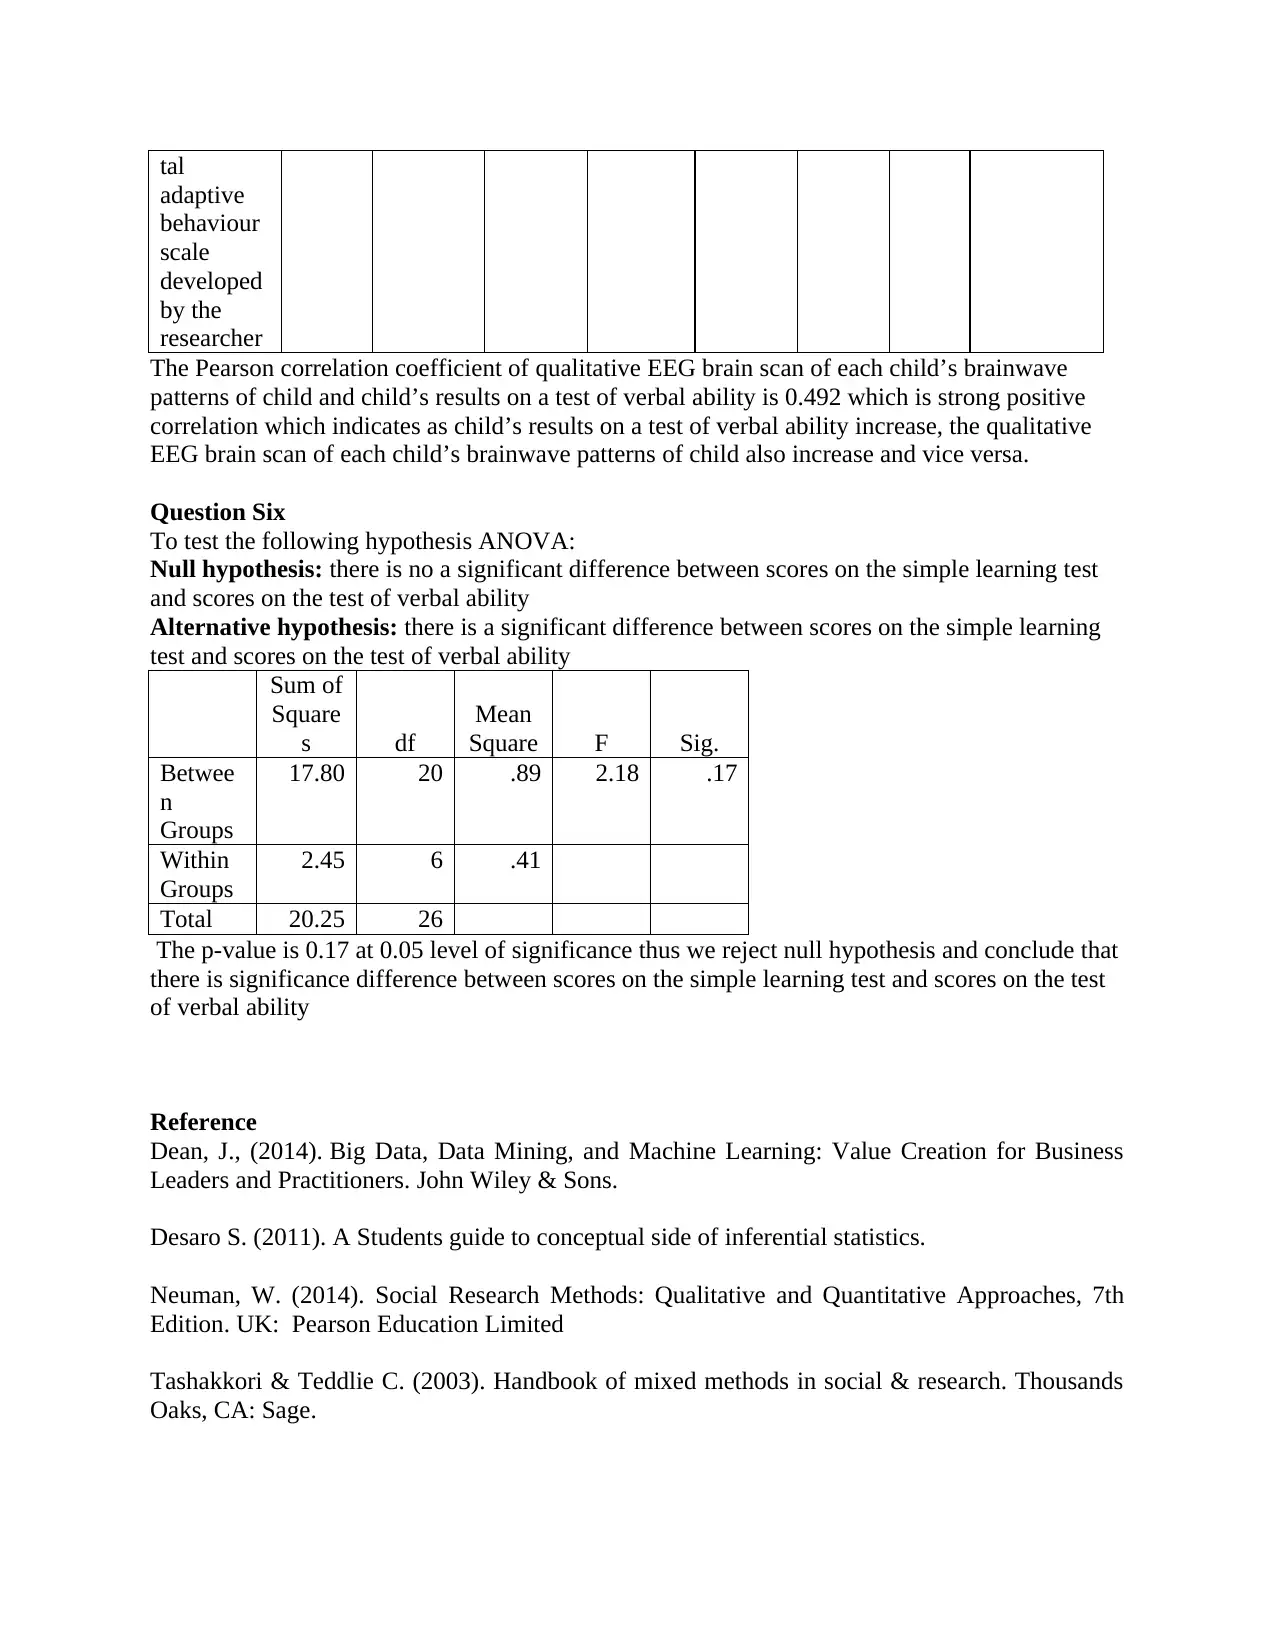
This assignment analyzes a dataset of children's performance on various tests, including modified Stanford-Binet IQ, simple learning, verbal ability, and an experimental adaptive behavior scale. It calculates Pearson correlation coefficients to assess relationships between different test scores and employs ANOVA to compare scores on the simple learning test and verbal ability test. The analysis reveals strong positive correlations between certain variables and provides insights into potential differences in performance across these areas.
Contribute Materials
Your contribution can guide someone’s learning journey. Share your
documents today.
PSYC2012 - PSYCHOLOGY: AN EVIDENCE-BASED APPROACH 2
ASSESSMENT 2
Data Analysis Assignment
Question one
Parametric test assumes that the data is normally distributed, which means that the peak is at the
centre and symmetric about the measure of location that is mean or median. Normally
assumptions eliminate outlier and extreme values which give false inferences about the
distribution of data. Test for normality includes histogram, Q-Q plot and comparing kurtosis and
skewness.
Test of normality using Shapiro-Wilk test for normality at 5% level of significance
Null hypothesis: The data is normally distributed.
Alternative hypothesis: The data is not normally distributed.
Tests of Normality
Kolmogorov-Smirnova Shapiro-Wilk
Statisti
c df Sig.
Statisti
c df Sig.
the results
of a simple
reaction
time test
for each
child
.14 27.00 .200* .97 27.00 .65
the results
of a
qualitative
EEG brain
scan of
each
child’s
brainwave
patterns
.22 27.00 .00 .88 27.00 .00
child’s
results on
the
Weschler
Child
Memory
Scale
.14 27.00 .200* .91 27.00 .02
parental
ratings of
levels of
difficult
behaviour
exhibited
.14 27.00 .16 .97 27.00 .60
Secure Best Marks with AI Grader
Need help grading? Try our AI Grader for instant feedback on your assignments.
by each
child
results of
modified
Stanford-
Binet IQ
testing of
each child
.13 27.00 .200* .96 27.00 .29
child’s
results for a
simple
learning
test
.12 27.00 .200* .96 27.00 .28
child’s
results on a
test of
verbal
ability
.11 27.00 .200* .98 27.00 .86
results of
an
experiment
al adaptive
behaviour
scale
developed
by the
researcher
.13 27.00 .200* .96 27.00 .45
*. This is a lower bound of the true significance.
a. Lilliefors Significance Correction
The p-value for the results of a qualitative EEG brain scan of each child’s brainwave patterns is
0.00 which indicates strong evidence of non-normality. All other variable have p-value greater
than 0.05 (level of significance) thus normally distributed.
The variable can be improved by transformation which includes:
a) Log transformation, finding the logarithm of variable
Tests of Normality
Kolmogorov-Smirnova Shapiro-Wilk
Statistic df Sig. Statistic df Sig.
logx2 .14 27 .20 .95 27 .26
a. Lilliefors Significance Correction
The data now is normally distributed
b) Finding the square root of the variable
Tests of Normality
Kolmogorov-Smirnova Shapiro-Wilk
Statistic Df Sig. Statistic df Sig.
squarex2 .26 27 .00 .75 27 .00
a. Lilliefors Significance Correction
This did not improve the data after squaring the data is still non-normal.
c) Finding the square of variable
Tests of Normality
Kolmogorov-Smirnova Shapiro-Wilk
Statistic df Sig. Statistic df Sig.
sqrtx2 .19 27 .02 .94 27 .10
a. Lilliefors Significance Correction
The transformations improve the data and now are normal.
Question Three
Chi-square assumes the following assumptions:
The data must be categorical in nature that is nominal or ordinal
The variable must have more than two independents categories
Chi-Square Tests
Value df
Asym
p. Sig.
(2-
sided)
Pearson
Chi-
Square
7.00a 2 .03
Likelihoo
d Ratio
9.64 2 .01
Linear-
by-Linear
Associati
on
6.02 1 .01
N of
Valid
Cases
27
Kolmogorov-Smirnova Shapiro-Wilk
Statistic Df Sig. Statistic df Sig.
squarex2 .26 27 .00 .75 27 .00
a. Lilliefors Significance Correction
This did not improve the data after squaring the data is still non-normal.
c) Finding the square of variable
Tests of Normality
Kolmogorov-Smirnova Shapiro-Wilk
Statistic df Sig. Statistic df Sig.
sqrtx2 .19 27 .02 .94 27 .10
a. Lilliefors Significance Correction
The transformations improve the data and now are normal.
Question Three
Chi-square assumes the following assumptions:
The data must be categorical in nature that is nominal or ordinal
The variable must have more than two independents categories
Chi-Square Tests
Value df
Asym
p. Sig.
(2-
sided)
Pearson
Chi-
Square
7.00a 2 .03
Likelihoo
d Ratio
9.64 2 .01
Linear-
by-Linear
Associati
on
6.02 1 .01
N of
Valid
Cases
27
The Pearson Chi-square is 7.00, p=0.03 which shows that there is no statistically significance
between gender and group. Both male and female are equally presented as control group, those
with ADHD and those who have autism.
To measure strength of association Cramer’s V and Phi test are used as shown below which
suggest a weak association between gender and group.
Symmetric Measures
Value
Appro
x. Sig.
Nomin
al by
Nomin
al
Phi .51 .03
Cramer'
s V
.51 .03
The bar chart also reveals an equal representation of both male and female in the study group.
Secure Best Marks with AI Grader
Need help grading? Try our AI Grader for instant feedback on your assignments.
Question Four
Gender
results of
modified
Stanford-
Binet IQ
testing of
each
child
results of an
experimental
adaptive
behaviour
scale
developed
by the
researcher
Male Mean 2.99 47.61
Median 3.25 49.00
Variance 0.41 74.96
Std.
Deviation
0.64 8.66
Female Mean 2.57 41.89
Median 2.50 43.00
Variance 0.75 46.86
Std.
Deviation
0.87 6.85
Null hypothesis: There is a sex difference for the modified Stanford-Binet IQ test
Alternative hypothesis: There is no sex difference for the the modified Stanford-Binet IQ test
The mean results of modified Stanford-Binet IQ testing of each child for male is 2.99 with a
standard deviation of 0.64 the confidence interval for mean [2.35, 3.63] while that of female is
2.57 and standard deviation of 0.87
Independent Samples Test
Levene's Test
for Equality of
Variances t-test for Equality of Means
F Sig. t df
Sig.
(2-
tailed)
Mean
Differenc
e
Std.
Error
Differenc
e
95%
Confidence
Interval of the
Difference
Lower Upper
results
of
Equal
variance
.93 .34 1.24 25.00 .23 .37 .29 -.24 .97
modifie
d
Stanfor
d-Binet
IQ
testing
of each
child
s
assume
d
Equal
variance
s not
assume
d
1.12 12.56 .28 .37 .33 -.34 1.07
The p-value of t-test for equality of means is 0.23 which is show that there is no sex difference
for the modified Stanford-Binet IQ test and thus the mean of male and female is equal. There is
no statistical difference in the two mean as supported by bar graph below
Null hypothesis: There is a sex difference for the scores on the experimental adaptive behaviour
scale
d
Stanfor
d-Binet
IQ
testing
of each
child
s
assume
d
Equal
variance
s not
assume
d
1.12 12.56 .28 .37 .33 -.34 1.07
The p-value of t-test for equality of means is 0.23 which is show that there is no sex difference
for the modified Stanford-Binet IQ test and thus the mean of male and female is equal. There is
no statistical difference in the two mean as supported by bar graph below
Null hypothesis: There is a sex difference for the scores on the experimental adaptive behaviour
scale
Alternative hypothesis: There is no sex difference for the scores on the experimental adaptive
behaviour scale
Levene's Test
for Equality of
Variances t-test for Equality of Means
F Sig. t df
Sig.
(2-
tailed)
Mean
Differen
ce
Std.
Error
Differen
ce
95%
Confidence
Interval of the
Difference
Lower Upper
results of
an
experiment
al adaptive
behaviour
scale
developed
by the
researcher
Equal
varianc
es
assume
d
.85 .36 1.73 25.00 .10 5.72 3.32 -1.11 12.55
Equal
varianc
es not
assume
d
1.87 19.92 .08 5.72 3.06 -.67 12.11
The test assumes the variances of male and female are equal from the population which they
were obtained. This is test using Lavene’s test for equal variance. The P-value=0.36 which is
greater than 0.05 level of significance and thus we have equal variance. The p-value of t-test for
equality of means is 0.10 which is greater than 0.05 (significance level). Thus we conclude that
the mean are different with a difference of 5.72. The mean of male results of an experimental
adaptive behaviour scale developed by the researcher is 47.61 and that of female is 41.88. Thus
we conclude that there is a sex difference for the scores on the experimental adaptive behaviour
scale.
Paraphrase This Document
Need a fresh take? Get an instant paraphrase of this document with our AI Paraphraser
Question Five
the
results
of a
simple
reactio
n time
test
for
each
child
the
results
of a
qualitati
ve EEG
brain
scan of
each
child’s
brainwa
ve
patterns
child’s
results
on the
Weschl
er
Child
Memor
y Scale
parental
ratings
of
levels
of
difficult
behavio
ur
exhibite
d by
each
child
results
of
modifie
d
Stanfor
d-Binet
IQ
testing
of each
child
child’s
results
for a
simple
learni
ng test
child
’s
result
s on
a test
of
verba
l
abilit
y
results of
an
experimen
tal
adaptive
behaviour
scale
developed
by the
researcher
the results
of a
simple
reaction
1 -.390* .624** .305 .534** .388* -.40
3*
.655**
the
results
of a
simple
reactio
n time
test
for
each
child
the
results
of a
qualitati
ve EEG
brain
scan of
each
child’s
brainwa
ve
patterns
child’s
results
on the
Weschl
er
Child
Memor
y Scale
parental
ratings
of
levels
of
difficult
behavio
ur
exhibite
d by
each
child
results
of
modifie
d
Stanfor
d-Binet
IQ
testing
of each
child
child’s
results
for a
simple
learni
ng test
child
’s
result
s on
a test
of
verba
l
abilit
y
results of
an
experimen
tal
adaptive
behaviour
scale
developed
by the
researcher
the results
of a
simple
reaction
1 -.390* .624** .305 .534** .388* -.40
3*
.655**
time test
for each
child
the results
of a
qualitative
EEG brain
scan of
each
child’s
brainwave
patterns
-.390* 1 -.572** .234 .552** .082 .49
2**
.114
child’s
results on
the
Weschler
Child
Memory
Scale
.624** -.572** 1 .183 .054 .212 -.289 .499**
parental
ratings of
levels of
difficult
behaviour
exhibited
by each
child
.305 .234 .183 1 .548** .766** .194 .535**
results of
modified
Stanford-
Binet IQ
testing of
each child
.534** .552** .054 .548** 1 .444* .091 .694**
child’s
results for
a simple
learning
test
.388* .082 .212 .766** .444* 1 .101 .421*
child’s
results on
a test of
verbal
ability
-.403* .492** -.289 .194 .091 .101 1 .047
results of
an
experimen
.655** .114 .499** .535** .694** .421* .047 1
tal
adaptive
behaviour
scale
developed
by the
researcher
The Pearson correlation coefficient of qualitative EEG brain scan of each child’s brainwave
patterns of child and child’s results on a test of verbal ability is 0.492 which is strong positive
correlation which indicates as child’s results on a test of verbal ability increase, the qualitative
EEG brain scan of each child’s brainwave patterns of child also increase and vice versa.
Question Six
To test the following hypothesis ANOVA:
Null hypothesis: there is no a significant difference between scores on the simple learning test
and scores on the test of verbal ability
Alternative hypothesis: there is a significant difference between scores on the simple learning
test and scores on the test of verbal ability
Sum of
Square
s df
Mean
Square F Sig.
Betwee
n
Groups
17.80 20 .89 2.18 .17
Within
Groups
2.45 6 .41
Total 20.25 26
The p-value is 0.17 at 0.05 level of significance thus we reject null hypothesis and conclude that
there is significance difference between scores on the simple learning test and scores on the test
of verbal ability
Reference
Dean, J., (2014). Big Data, Data Mining, and Machine Learning: Value Creation for Business
Leaders and Practitioners. John Wiley & Sons.
Desaro S. (2011). A Students guide to conceptual side of inferential statistics.
Neuman, W. (2014). Social Research Methods: Qualitative and Quantitative Approaches, 7th
Edition. UK: Pearson Education Limited
Tashakkori & Teddlie C. (2003). Handbook of mixed methods in social & research. Thousands
Oaks, CA: Sage.
1 out of 10
Your All-in-One AI-Powered Toolkit for Academic Success.
+13062052269
info@desklib.com
Available 24*7 on WhatsApp / Email
Unlock your academic potential
© 2024 | Zucol Services PVT LTD | All rights reserved.