Applied Biostatistics Assignment

Verified

Added on  2022/11/29

|3
|617
|241
AI Summary
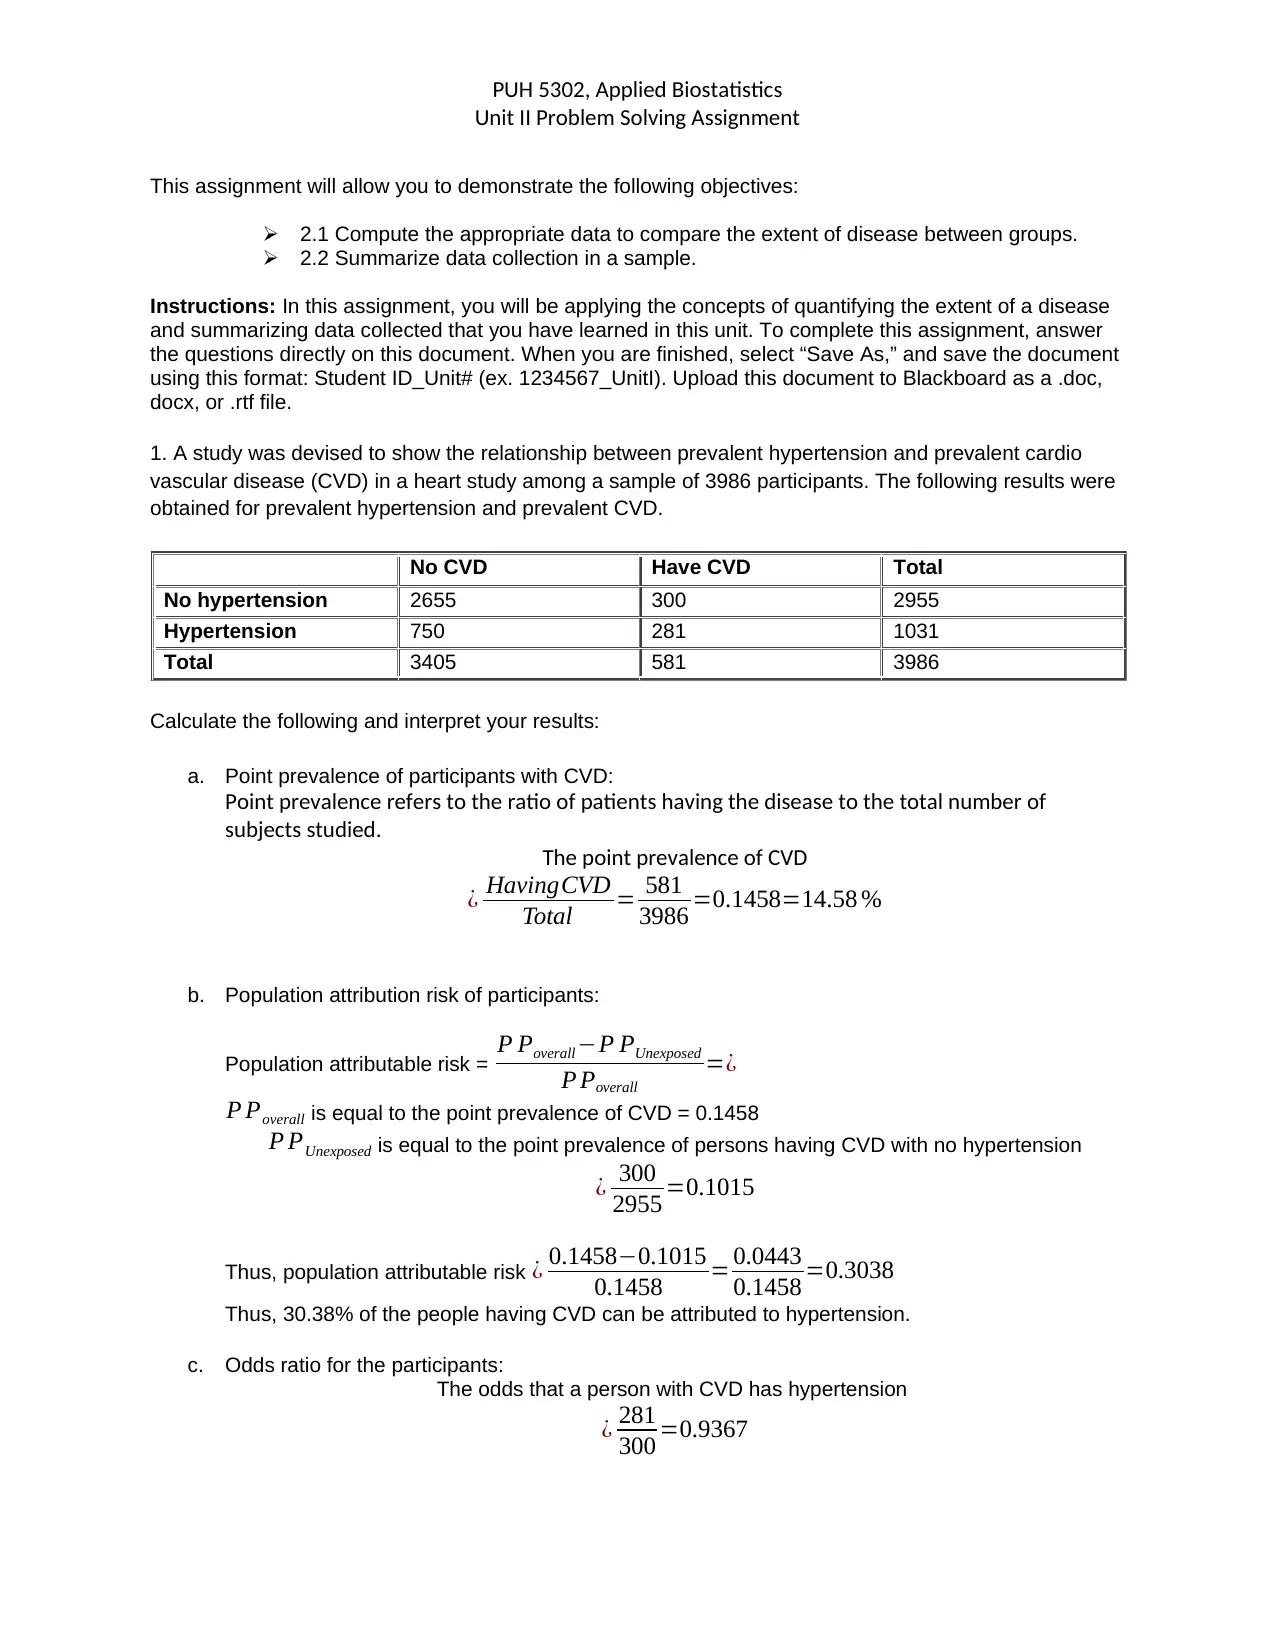
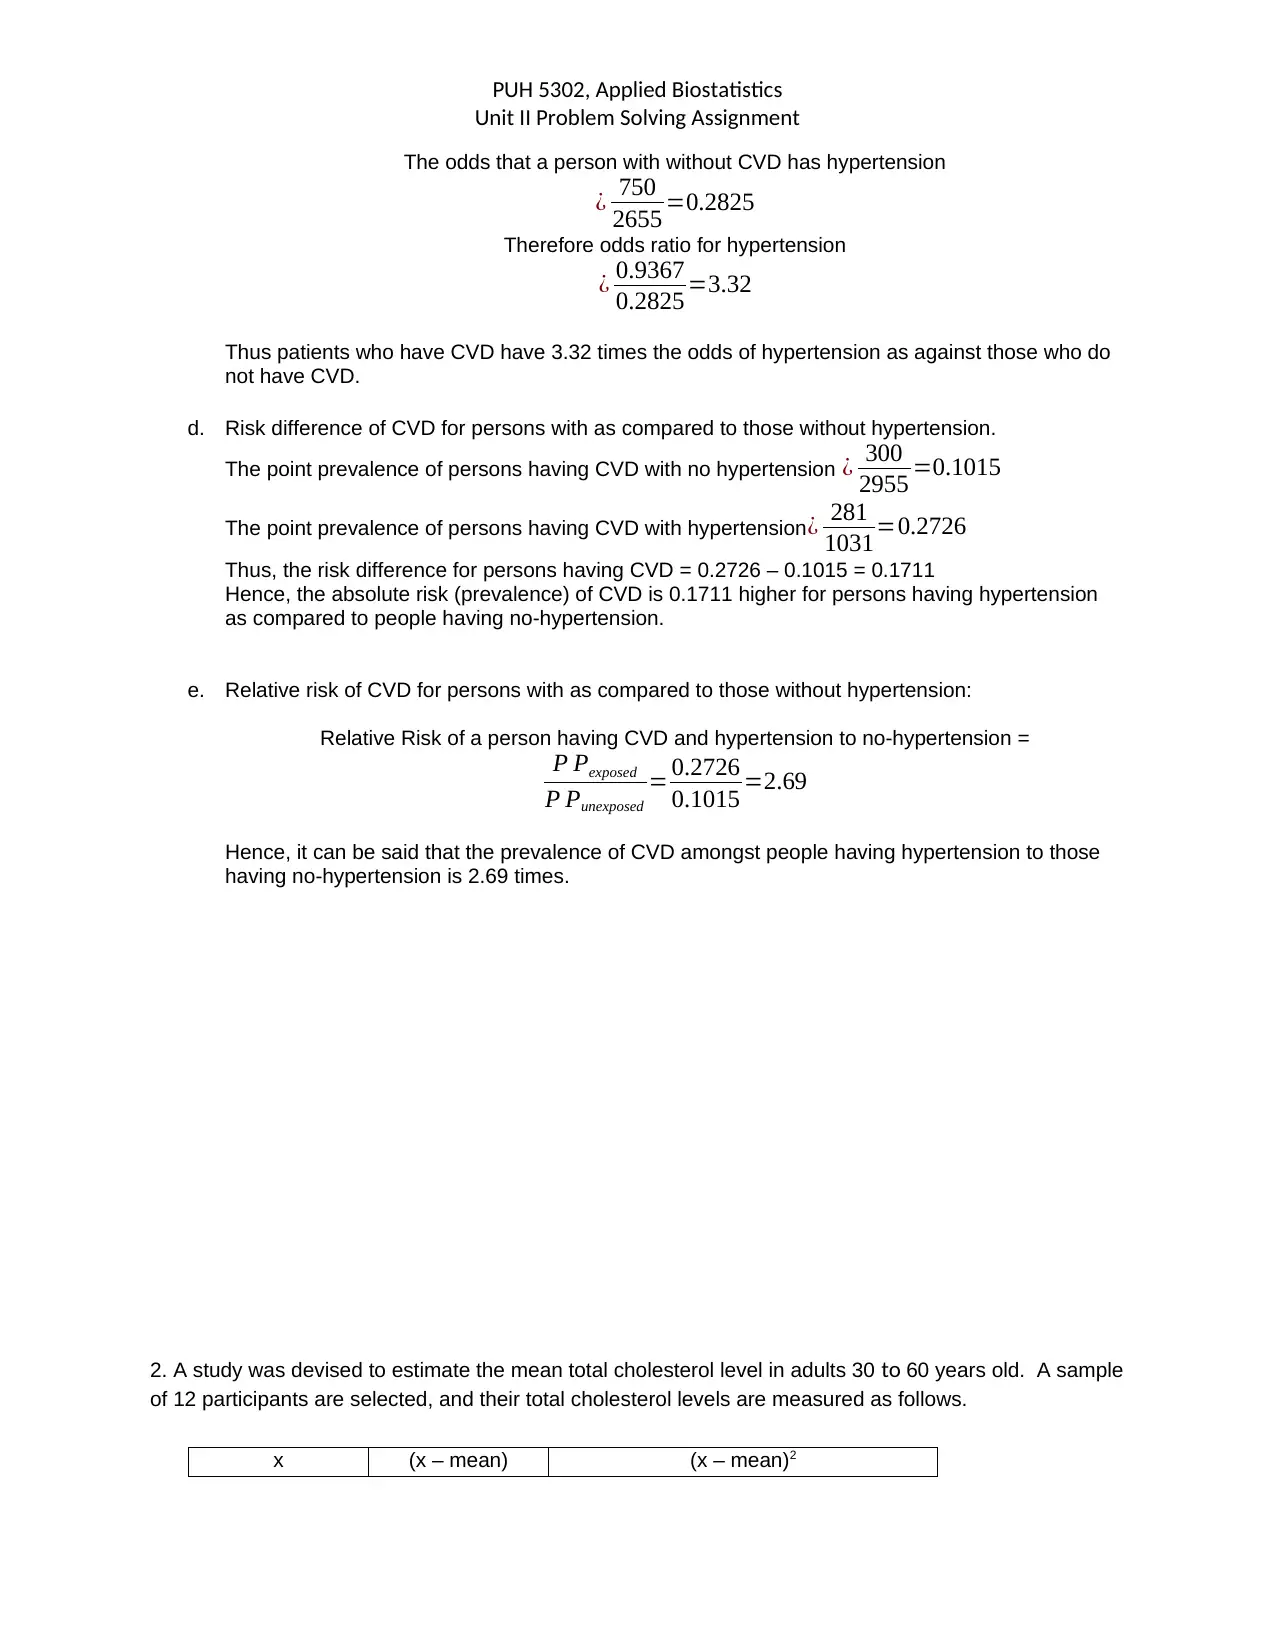
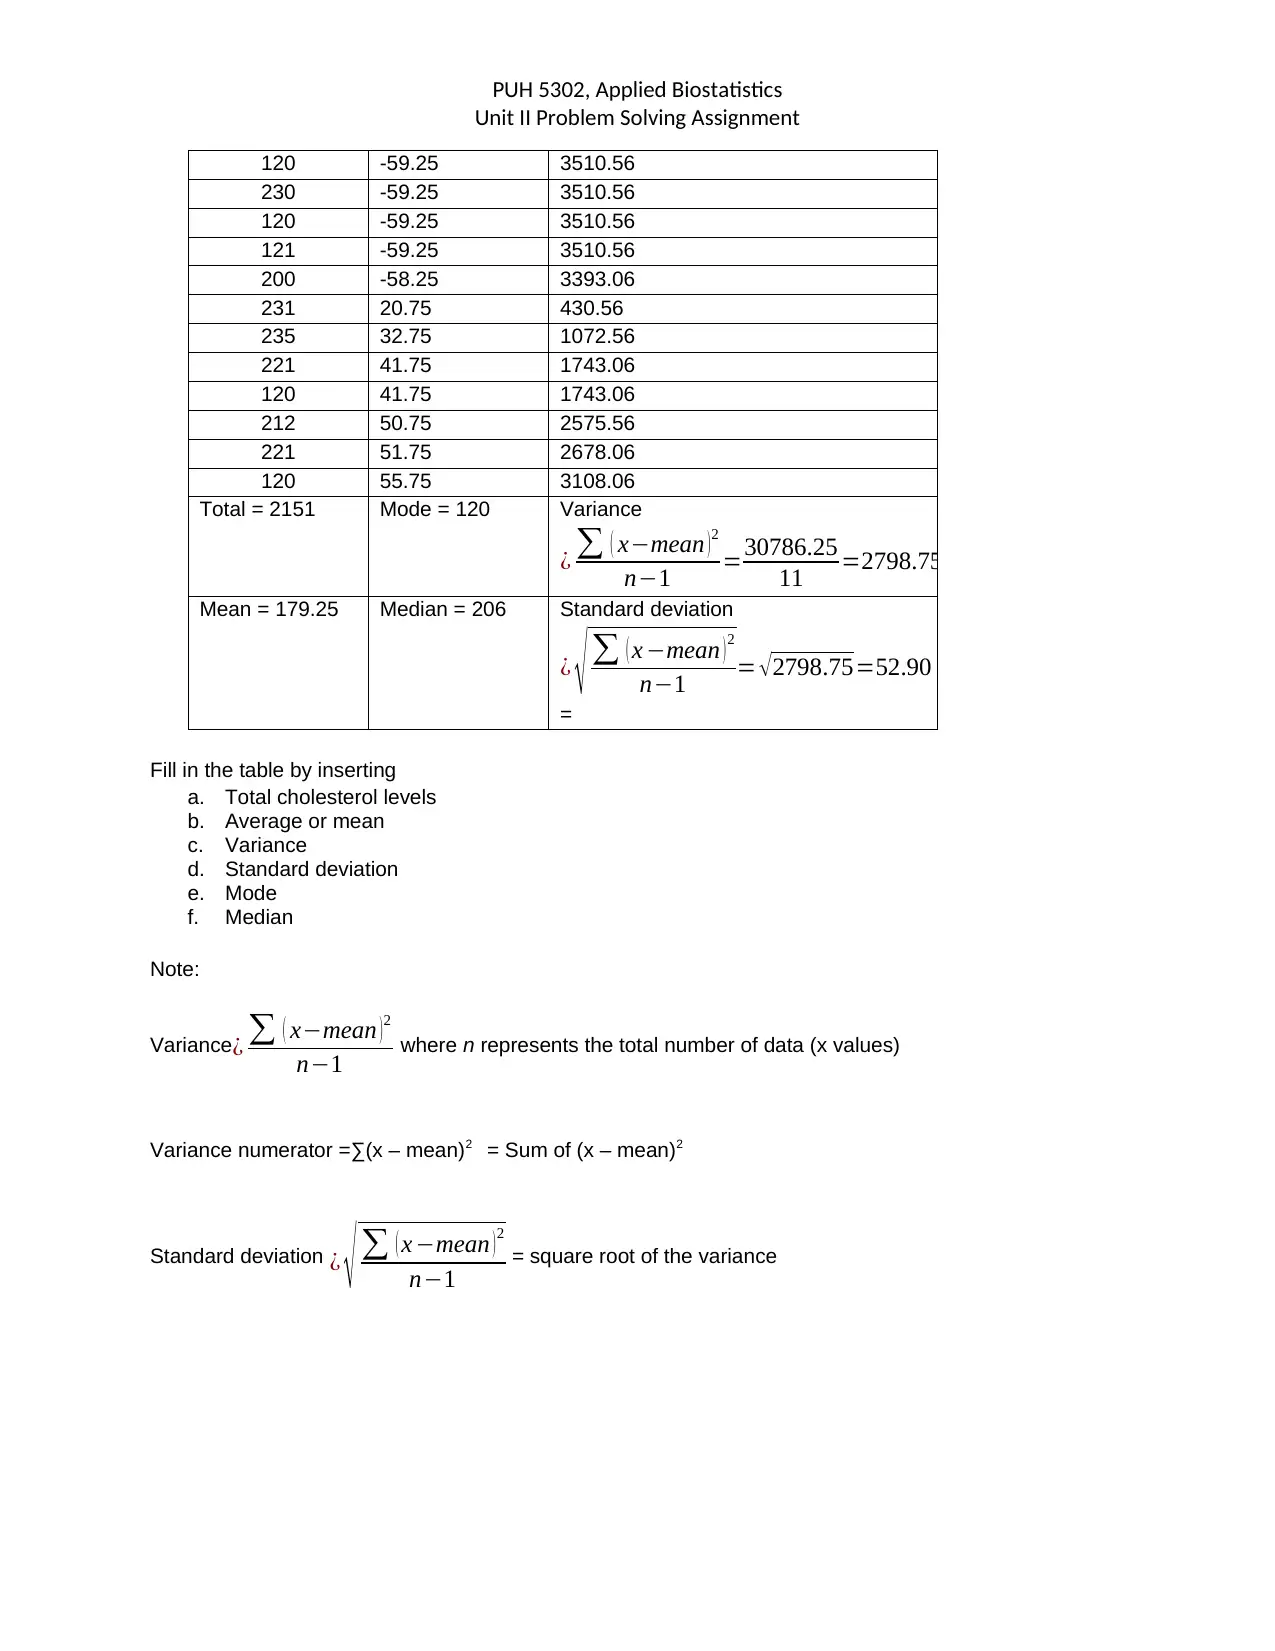
This assignment focuses on applying the concepts of quantifying the extent of a disease and summarizing data collected in the field of biostatistics. It includes calculations and interpretations of point prevalence, population attribution risk, odds ratio, risk difference, and relative risk.
tabler-icon-diamond-filled.svg

Contribute Materials

Your contribution can guide someone’s learning journey. Share your documents today.
Document Page
PUH 5302, Applied Biostatistics
Unit II Problem Solving Assignment
This assignment will allow you to demonstrate the following objectives:
2.1 Compute the appropriate data to compare the extent of disease between groups.
2.2 Summarize data collection in a sample.
Instructions: In this assignment, you will be applying the concepts of quantifying the extent of a disease
and summarizing data collected that you have learned in this unit. To complete this assignment, answer
the questions directly on this document. When you are finished, select “Save As,” and save the document
using this format: Student ID_Unit# (ex. 1234567_UnitI). Upload this document to Blackboard as a .doc,
docx, or .rtf file.
1. A study was devised to show the relationship between prevalent hypertension and prevalent cardio
vascular disease (CVD) in a heart study among a sample of 3986 participants. The following results were
obtained for prevalent hypertension and prevalent CVD.
No CVD Have CVD Total
No hypertension 2655 300 2955
Hypertension 750 281 1031
Total 3405 581 3986
Calculate the following and interpret your results:
a. Point prevalence of participants with CVD:
Point prevalence refers to the ratio of patients having the disease to the total number of
subjects studied.
The point prevalence of CVD
¿ HavingCVD
Total = 581
3986 =0.1458=14.58 %
b. Population attribution risk of participants:
Population attributable risk = P Poverall P PUnexposed
P Poverall
=¿
P Poverall is equal to the point prevalence of CVD = 0.1458
P PUnexposed is equal to the point prevalence of persons having CVD with no hypertension
¿ 300
2955 =0.1015
Thus, population attributable risk ¿ 0.14580.1015
0.1458 = 0.0443
0.1458 =0.3038
Thus, 30.38% of the people having CVD can be attributed to hypertension.
c. Odds ratio for the participants:
The odds that a person with CVD has hypertension
¿ 281
300 =0.9367
tabler-icon-diamond-filled.svg

Secure Best Marks with AI Grader

Need help grading? Try our AI Grader for instant feedback on your assignments.
Document Page
PUH 5302, Applied Biostatistics
Unit II Problem Solving Assignment
The odds that a person with without CVD has hypertension
¿ 750
2655 =0.2825
Therefore odds ratio for hypertension
¿ 0.9367
0.2825 =3.32
Thus patients who have CVD have 3.32 times the odds of hypertension as against those who do
not have CVD.
d. Risk difference of CVD for persons with as compared to those without hypertension.
The point prevalence of persons having CVD with no hypertension ¿ 300
2955 =0.1015
The point prevalence of persons having CVD with hypertension¿ 281
1031=0.2726
Thus, the risk difference for persons having CVD = 0.2726 – 0.1015 = 0.1711
Hence, the absolute risk (prevalence) of CVD is 0.1711 higher for persons having hypertension
as compared to people having no-hypertension.
e. Relative risk of CVD for persons with as compared to those without hypertension:
Relative Risk of a person having CVD and hypertension to no-hypertension =
P Pexposed
P Punexposed
= 0.2726
0.1015 =2.69
Hence, it can be said that the prevalence of CVD amongst people having hypertension to those
having no-hypertension is 2.69 times.
2. A study was devised to estimate the mean total cholesterol level in adults 30 to 60 years old. A sample
of 12 participants are selected, and their total cholesterol levels are measured as follows.
x (x – mean) (x – mean)2
Document Page
PUH 5302, Applied Biostatistics
Unit II Problem Solving Assignment
120 -59.25 3510.56
230 -59.25 3510.56
120 -59.25 3510.56
121 -59.25 3510.56
200 -58.25 3393.06
231 20.75 430.56
235 32.75 1072.56
221 41.75 1743.06
120 41.75 1743.06
212 50.75 2575.56
221 51.75 2678.06
120 55.75 3108.06
Total = 2151 Mode = 120 Variance
¿ ( xmean ) 2
n1 =30786.25
11 =2798.75
Mean = 179.25 Median = 206 Standard deviation
¿ ( x mean ) 2
n1 = 2798.75=52.90
=
Fill in the table by inserting
a. Total cholesterol levels
b. Average or mean
c. Variance
d. Standard deviation
e. Mode
f. Median
Note:
Variance ¿ ( xmean ) 2
n1 where n represents the total number of data (x values)
Variance numerator =∑(x – mean)2 = Sum of (x – mean)2
Standard deviation ¿ ( x mean ) 2
n1 = square root of the variance
chevron_up_icon
1 out of 3
circle_padding
hide_on_mobile
zoom_out_icon
[object Object]

Your All-in-One AI-Powered Toolkit for Academic Success.

Available 24*7 on WhatsApp / Email

[object Object]