Process Control and Out-of-Control Data Analysis
VerifiedAdded on 2020/04/21
|22
|4064
|436
AI Summary
This assignment focuses on analyzing data from a simulated process to determine if it's under or out of control. Students calculate key statistical measures like Standard Deviation, Lower Control Limit (LCL), and Upper Control Limit (UCL). They then interpret the results based on the number of data points falling beyond these limits. The analysis highlights potential causes for process variation, including issues with data collection, sample homogeneity, and improper use of control charts. Finally, students explore non-parametric methods and adjustments to control chart parameters as potential solutions.
Contribute Materials
Your contribution can guide someone’s learning journey. Share your
documents today.
Running Head: QUALITY MANAGEMENT 1
Quality Management
By Name
Course
Instructor
Institution
Location
Date
Quality Management
By Name
Course
Instructor
Institution
Location
Date
Secure Best Marks with AI Grader
Need help grading? Try our AI Grader for instant feedback on your assignments.
QUALITY MANAGEMENT 2
PART A
Question 3: Quality management
Question 3.1
Total quality management is the consistent and continuous effort by both the management
and employees to ensure customer satisfaction and continued loyalty. Employees, as well as the
management, ensure proper research and good feedback when seeking to improve the products
and services of the organization. Total quality management is divided into six categories.
Two of the six categories include the planning phase and the doing phase. The planning
phase is the most significant aspect of quality management. It involves employees coming up
with the problems and issues facing them that need to be addressed by the organization needs .
This involves outlining the main challenges in the organization and looking into the root cause of
the problems facing them. Employees engage in research to help come up with the best possible
remedies to the problems facing them.
On the other hand, the doing phase category plays a major role in transforming into
quality management. It involves establishing the solutions to the problems and implementing
them. Employees develop meaningful strategies to handle their problems. It is in this category
that the efficiency and effectiveness of the solutions and strategies established are measured.
These two categories play a major role in transforming the Japanese approach to quality
management.
QUALITY MANAGEMENT 3
Question 3.2
KAIZEN approach is known for continuous improvement in the business. It has several
benefits, which include, employee satisfaction, where employees are invited to look into the
business processes and give out their suggestions for improvement. Secondly, it improves safety
on the working floor for employees (Jaccard, 2013). This is possible when you incorporate ideas
that help to clean the working area of the workforce, which also allows better use and control of
business processes and equipment. Finally, the KAIZEN approach ensures increased efficiency
where it creates a strong running business. It enables employees to work with speed increasing
productivity in the business.
QUALITY MANAGEMENT 4
PART B
Question 2: Improvement and quality awards
Question 2.1
1. Malcolm Baldrige National Quality Award
It is a formal recognition of both public and private U.S organizations’ performance. It
recognizes organizations in the following sectors education, business, non-profit and
healthcare. This award is constituted by (a) concepts and core values, (b) scoring guidelines,
and (c) criteria for performance excellence. One of its major elements is that it uses the
seven-category point scoring program and the three-level process in judging. Each business
is required to submit applications of at least 75 pages, in which the seven categories are
covered. These seven areas include customer satisfaction, leadership, quality results, analysis
and information, a quality guarantee of services and products, human resource utilization and
strategic quality planning.
2. European Quality Award
European Quality Award is awarded to businesses that demonstrate excellence in their
management of quality and ensure stakeholder, employees, and customer satisfaction in
Europe (Jaccard, & Ljundberg, 2013). Nine categories; people management, customer
Secure Best Marks with AI Grader
Need help grading? Try our AI Grader for instant feedback on your assignments.
QUALITY MANAGEMENT 5
satisfaction, business results, impact on society, resources, policy and strategy, leadership,
people satisfaction and processes, constitutes it.
The major elements of European Quality Award include award applications,
management systems, and improvement systems. These elements seek to analyze the
possible internal connection among winner and further develop the maximum, minimum
number of elements awarded; a total number of common awards in the same organization,
and the maximum and minimum time, an organization takes to win awards.
3. Deming Prize
One major element of Deming prize is that it recognizes both businesses and individuals
in total quality management globally. Another element is that, it does not establish a model
for businesses to follow to measure quality excellence but instead the applicants to this award
are expected to develop their objectives and goals and transform while improving themselves
widely (Sgroi, 2016). The objective of the organization is now measured to see whether they
have been meeting or not.
The following major components constitute it.: institute leadership, adopting own unique
philosophy, ending the norm of awarding businesses on prices alone, breaking obstacles
between the workforce, eliminating numerical quotas, and finally ensuring that everyone
works towards achieving the transformation of the organization.
Question 2.2
Both Baldrige National Quality Award and ISO certification are basic requirements for
establishing a quality system in the business. However, they both have different focuses. While
Baldrige National Quality Award is limited to organizations in the United States only, ISO
QUALITY MANAGEMENT 6
Certification is a quality standard that is recognized in the whole world (De, 2016). When it
comes to Baldrige Award, it can be self-assessed without necessarily applying for the award.
However, ISO Certification needs to be reviewed and audited by a certification body externally.
For an organization that seeks to adopt both strategies, ISO Certification should be the first to be
adopted. This is because it forms a good foundation for the quality management system for the
organization. The Baldrige Award should be adopted later to go past improvement in
establishing processes that help achieve high-performance excellence.
Question 3: Six Sigma
Question 3.1
There are two important elements of Six Sigma. They include customers and employees.
Customers are behind the definition of quality. Customers always expect service, reliability,
accurate transaction processing, on-time delivery and competitive prices (Brue, 2015). Thus to
gain customer delight and preference, an organization needs to produce what the customer wants.
Employees comprise of the other key component. Every organization should involve employees
in the Six Sigma program. It is the role of the business to provide incentives to the employees to
improve their skills in the business.
In a Six Sigma program, all the elements should have clear and well-defined objectives to
attain success. It helps an organization to embrace the change that it should be run in a better
different way.
Question 3.2
Both Lean Operation Principles and Six Sigma have a shared goal. They aim at eliminating
waste and creating the most efficient system for an organization. However, both strategies adopt
QUALITY MANAGEMENT 7
different approaches to achieving this goal. Lean principles is a philosophy that seeks to focus
more on the organizational culture and seek to change the behavior of employees permanently in
order to identify and eliminate waste in the organization. On the other hand, six sigma is a
program that does not seek to alter organizational culture nor change behavior but seeks to
eliminate waste variations in the output processes. In the process of eliminating waste, Lean
Principles believes in continuous improvement in the entire organization, in all operations and
areas, while six sigma focuses on eliminating waste on a specific area of operations, and the
results are only significant to the specific area and not the entire organization.
Both of these methods integrate well with business in continuous quality improvement. They
often work together to make the organization better. Despite six sigma being the best when it
comes to solving emergent and quick customer needs, it cannot bring improvement to the entire
organization thus Lean Principles is needed.
Six Sigma is better aimed for business because it seeks to get perfect results that will cut cost
but help to achieve higher customer satisfaction levels and it focuses more on achieving
continuous and consistent results for the business.
Paraphrase This Document
Need a fresh take? Get an instant paraphrase of this document with our AI Paraphraser
QUALITY MANAGEMENT 8
PART C
Question 1: Pareto diagram
Question 1.2
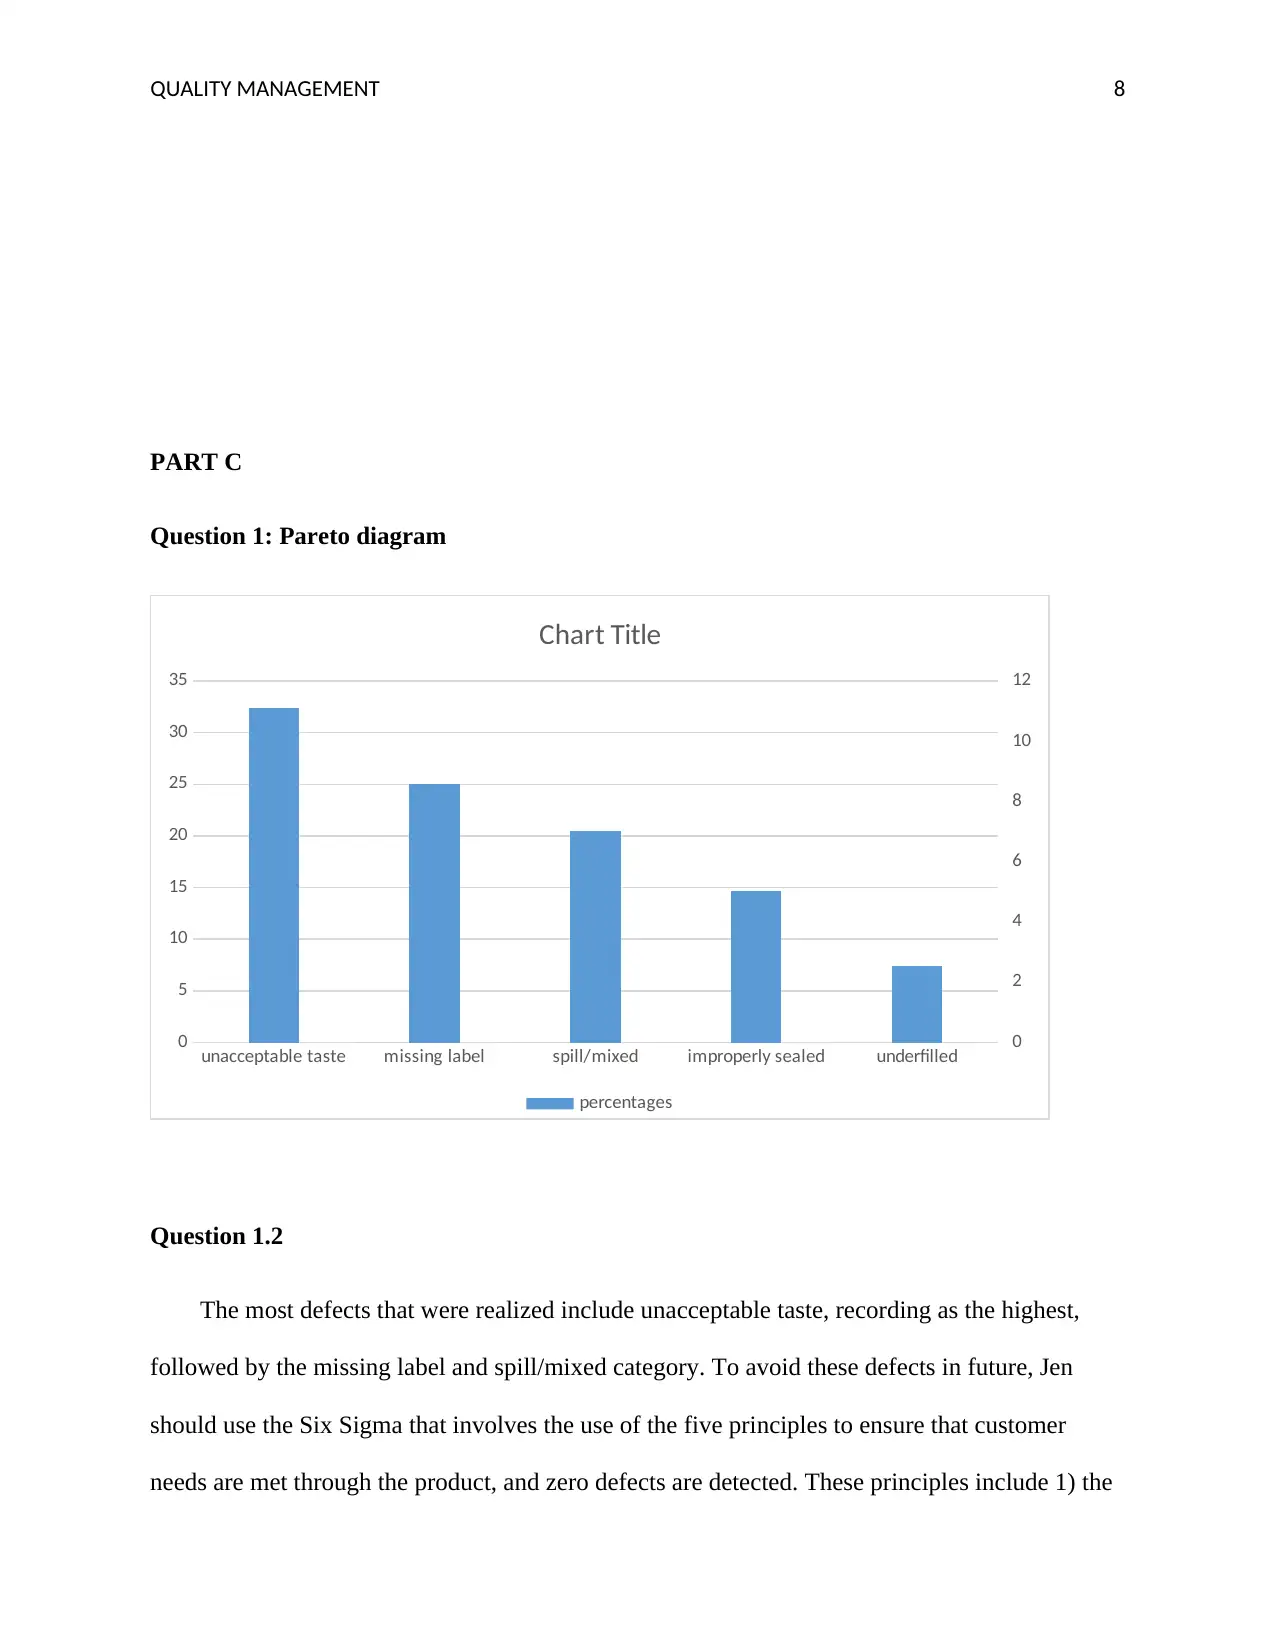
The most defects that were realized include unacceptable taste, recording as the highest,
followed by the missing label and spill/mixed category. To avoid these defects in future, Jen
should use the Six Sigma that involves the use of the five principles to ensure that customer
needs are met through the product, and zero defects are detected. These principles include 1) the
unacceptable taste missing label spill/mixed improperly sealed underfilled
0
5
10
15
20
25
30
35
0
2
4
6
8
10
12
Chart Title
percentages
PART C
Question 1: Pareto diagram
Question 1.2
The most defects that were realized include unacceptable taste, recording as the highest,
followed by the missing label and spill/mixed category. To avoid these defects in future, Jen
should use the Six Sigma that involves the use of the five principles to ensure that customer
needs are met through the product, and zero defects are detected. These principles include 1) the
unacceptable taste missing label spill/mixed improperly sealed underfilled
0
5
10
15
20
25
30
35
0
2
4
6
8
10
12
Chart Title
percentages
QUALITY MANAGEMENT 9
law of the market that states the customer should come first. 2) The law of flexibility that states
that any process should be maneuverable and should be ready for a change. 3) The law of focus
that states that focus should be on the problems of the organization and not the entire
organization. 4) The law of velocity that states that the effort put in a process should be
proportional to the results the organization achieves. 5) Finally, is the law of complexity that
states that all processes in a company should be simple.
Question 1.3
7:12 8:24 9:36 10:48 12:00 13:12 14:24 15:36 16:48
0
2
4
6
8
10
12
14
16
scatter plot for defects occurence
QUALITY MANAGEMENT 10
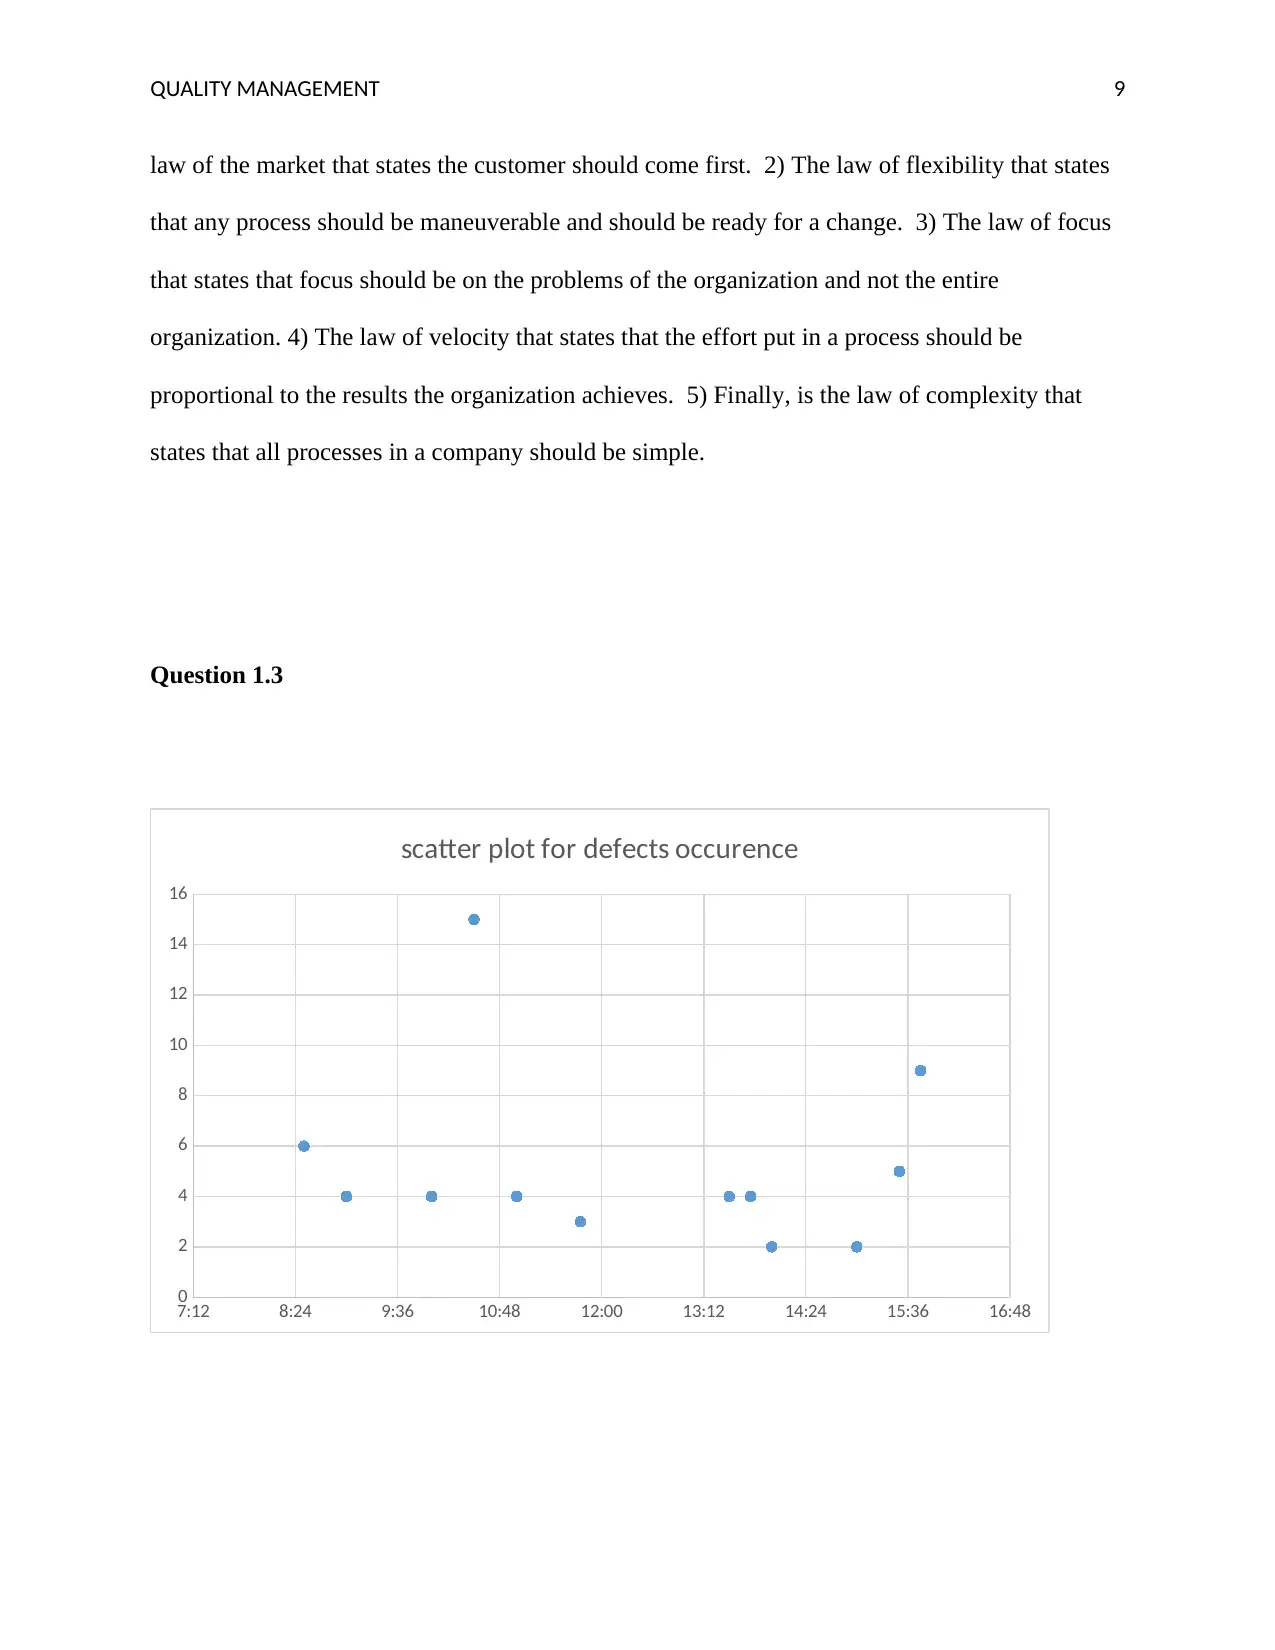
Most defects were detected at around 10:00 -10:30, which means more customers visited at
the time. Also, between 15:00-15:45, the second higher defects were detected. Customers’
complaints were lowest at 14:00. There were no complains raised at 12.
Question 2: Checksheet
Reason Day
June 01 June
08
Jun
e 15
Jun
e
22
June
29
July
06
July
13
July
20
July 27
Out of stock IIIIIIIIII
II
IIII IIII IIII IIIIIII
I
IIIIII
I
IIIIIII
II
IIIIIII
I
IIIIIIIIIII
II
Parking lot I I
Wrong pricing I I I I II
Store Furniture I
Wanted to know
who won the
lottery
I
Secure Best Marks with AI Grader
Need help grading? Try our AI Grader for instant feedback on your assignments.
QUALITY MANAGEMENT 11
Store temperature
conditions
I I I I II I II I
Store cleanliness IIII I II I II I
Telephone out of
order
I I I
Fresh/stale
products
IIIIII
I
IIIII
I
IIII
I
III II I
Checkout lines II II I III I II II
Overcharged/
double
charged/unwanted
charges/underchar
ged
III III IIII
I
I II II III I
Employees II I I I I I
Customer dislikes I I I II I
Customer lost
items
I I I
Broken/Spoilt I I I I I
ATM I
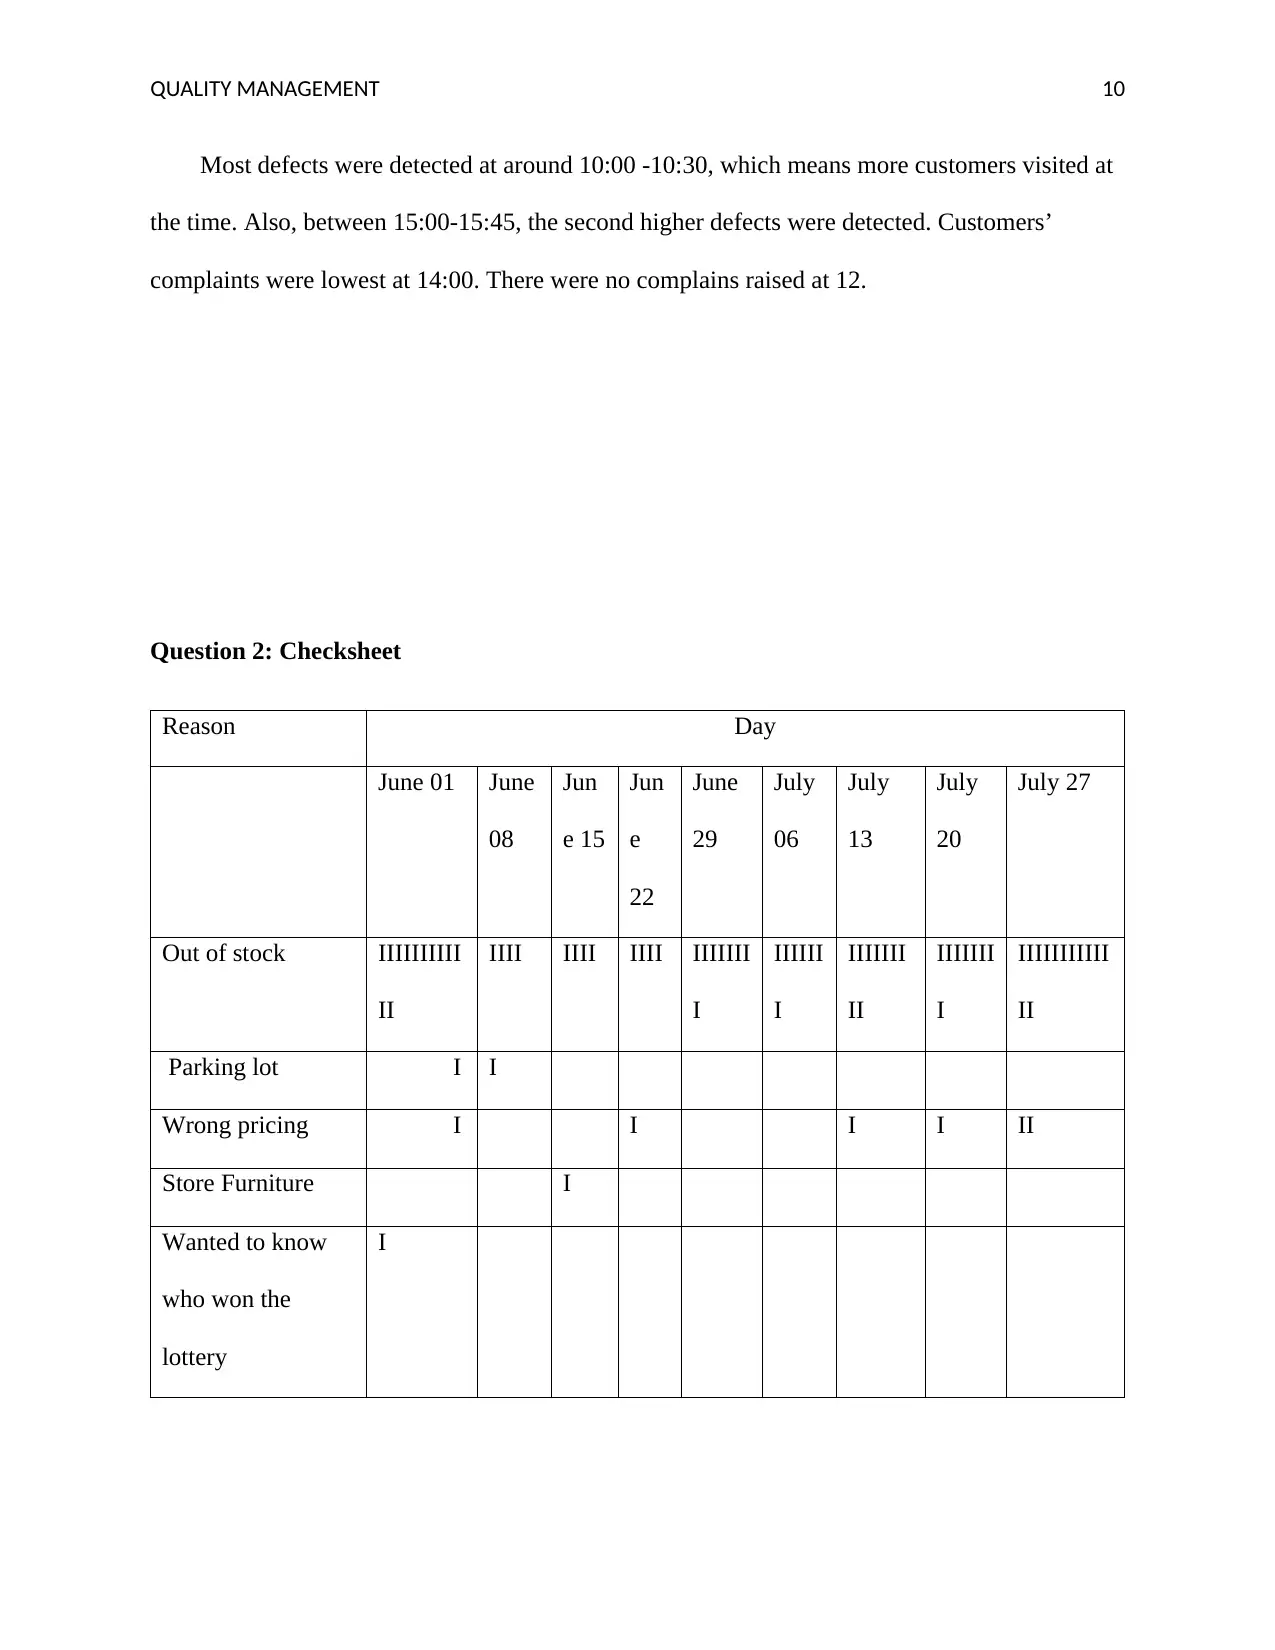
Question 2.1
The complaints from customers have been categorized into various groups due to the
similarity in the complaints. For instances, all the complaints that involved the lack of products
Store temperature
conditions
I I I I II I II I
Store cleanliness IIII I II I II I
Telephone out of
order
I I I
Fresh/stale
products
IIIIII
I
IIIII
I
IIII
I
III II I
Checkout lines II II I III I II II
Overcharged/
double
charged/unwanted
charges/underchar
ged
III III IIII
I
I II II III I
Employees II I I I I I
Customer dislikes I I I II I
Customer lost
items
I I I
Broken/Spoilt I I I I I
ATM I
Question 2.1
The complaints from customers have been categorized into various groups due to the
similarity in the complaints. For instances, all the complaints that involved the lack of products
QUALITY MANAGEMENT 12
in the store and those that could not be found were categorized into out of stock category. There
were a few complaints in the parking lot thus; it was categorized on its own. Other complaints
that pertained to the wrong price in items were categorized under wrong pricing.
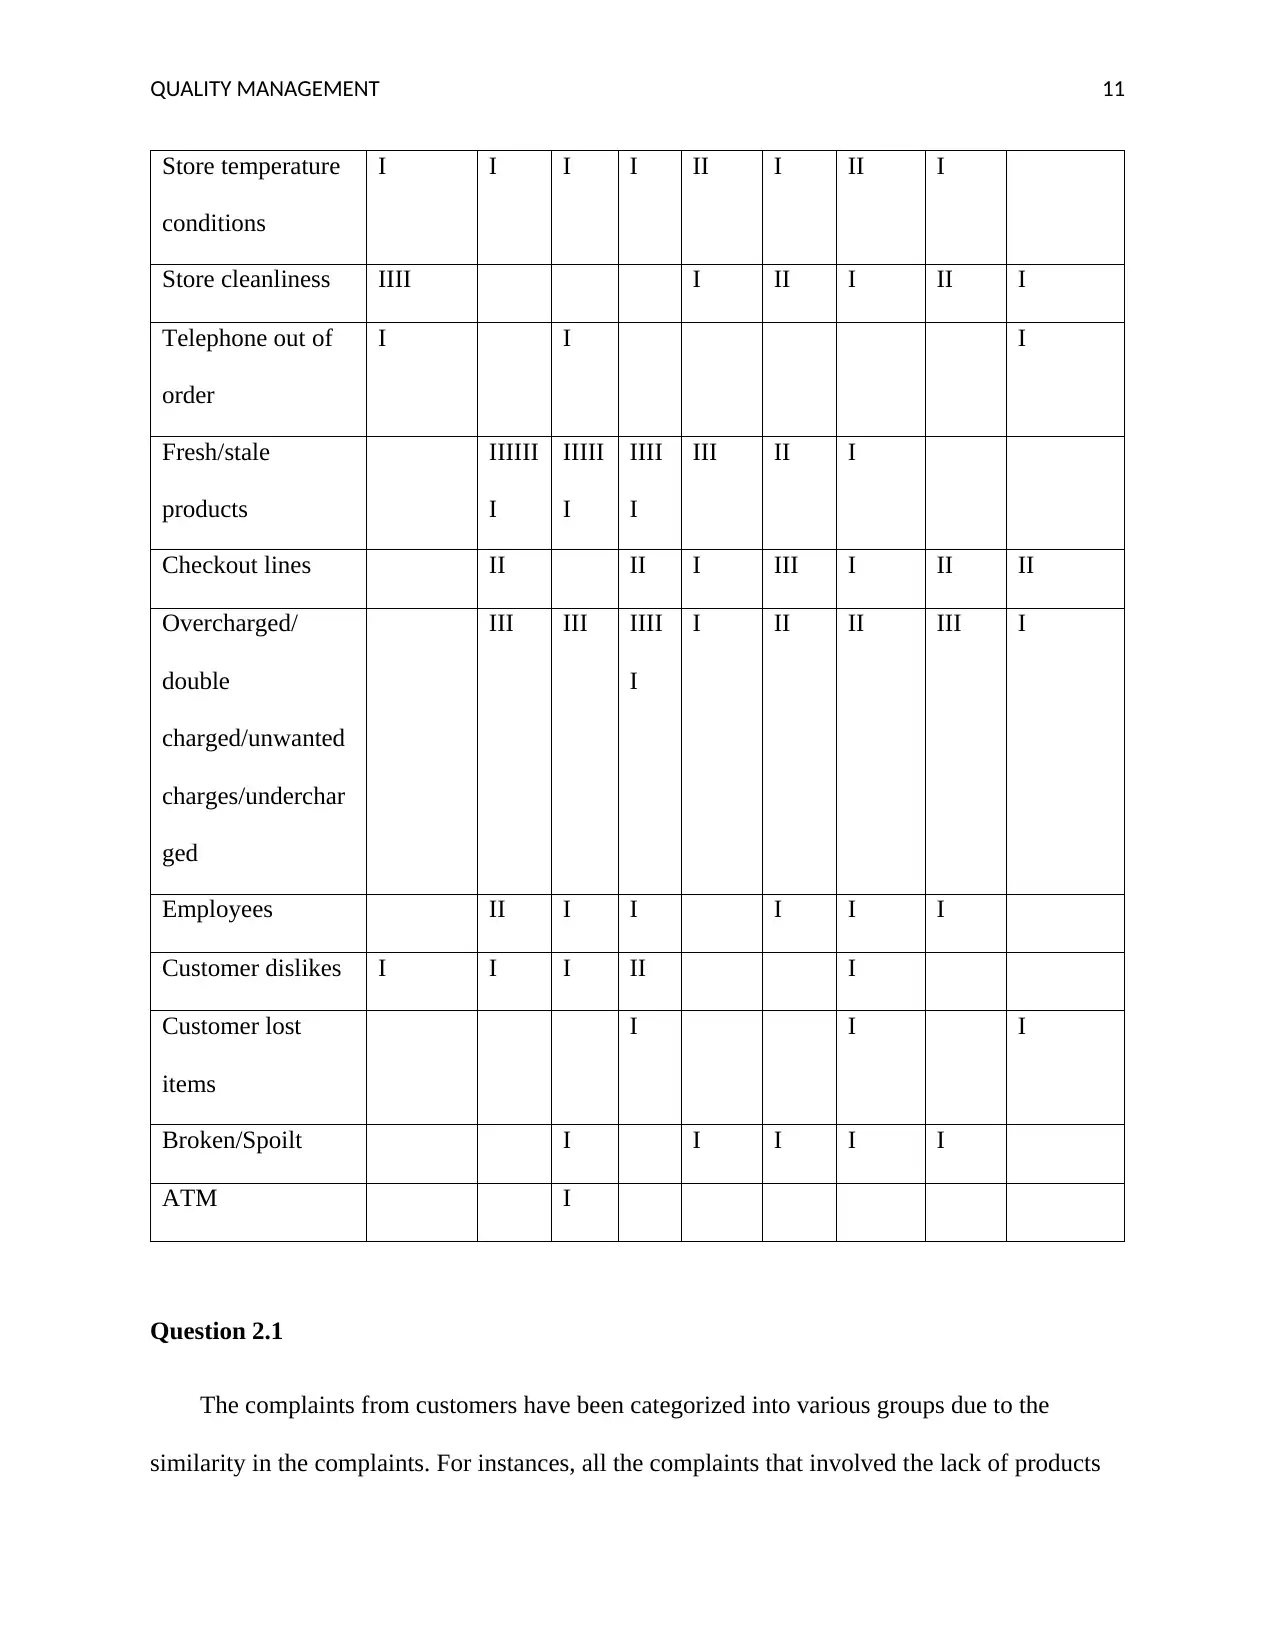
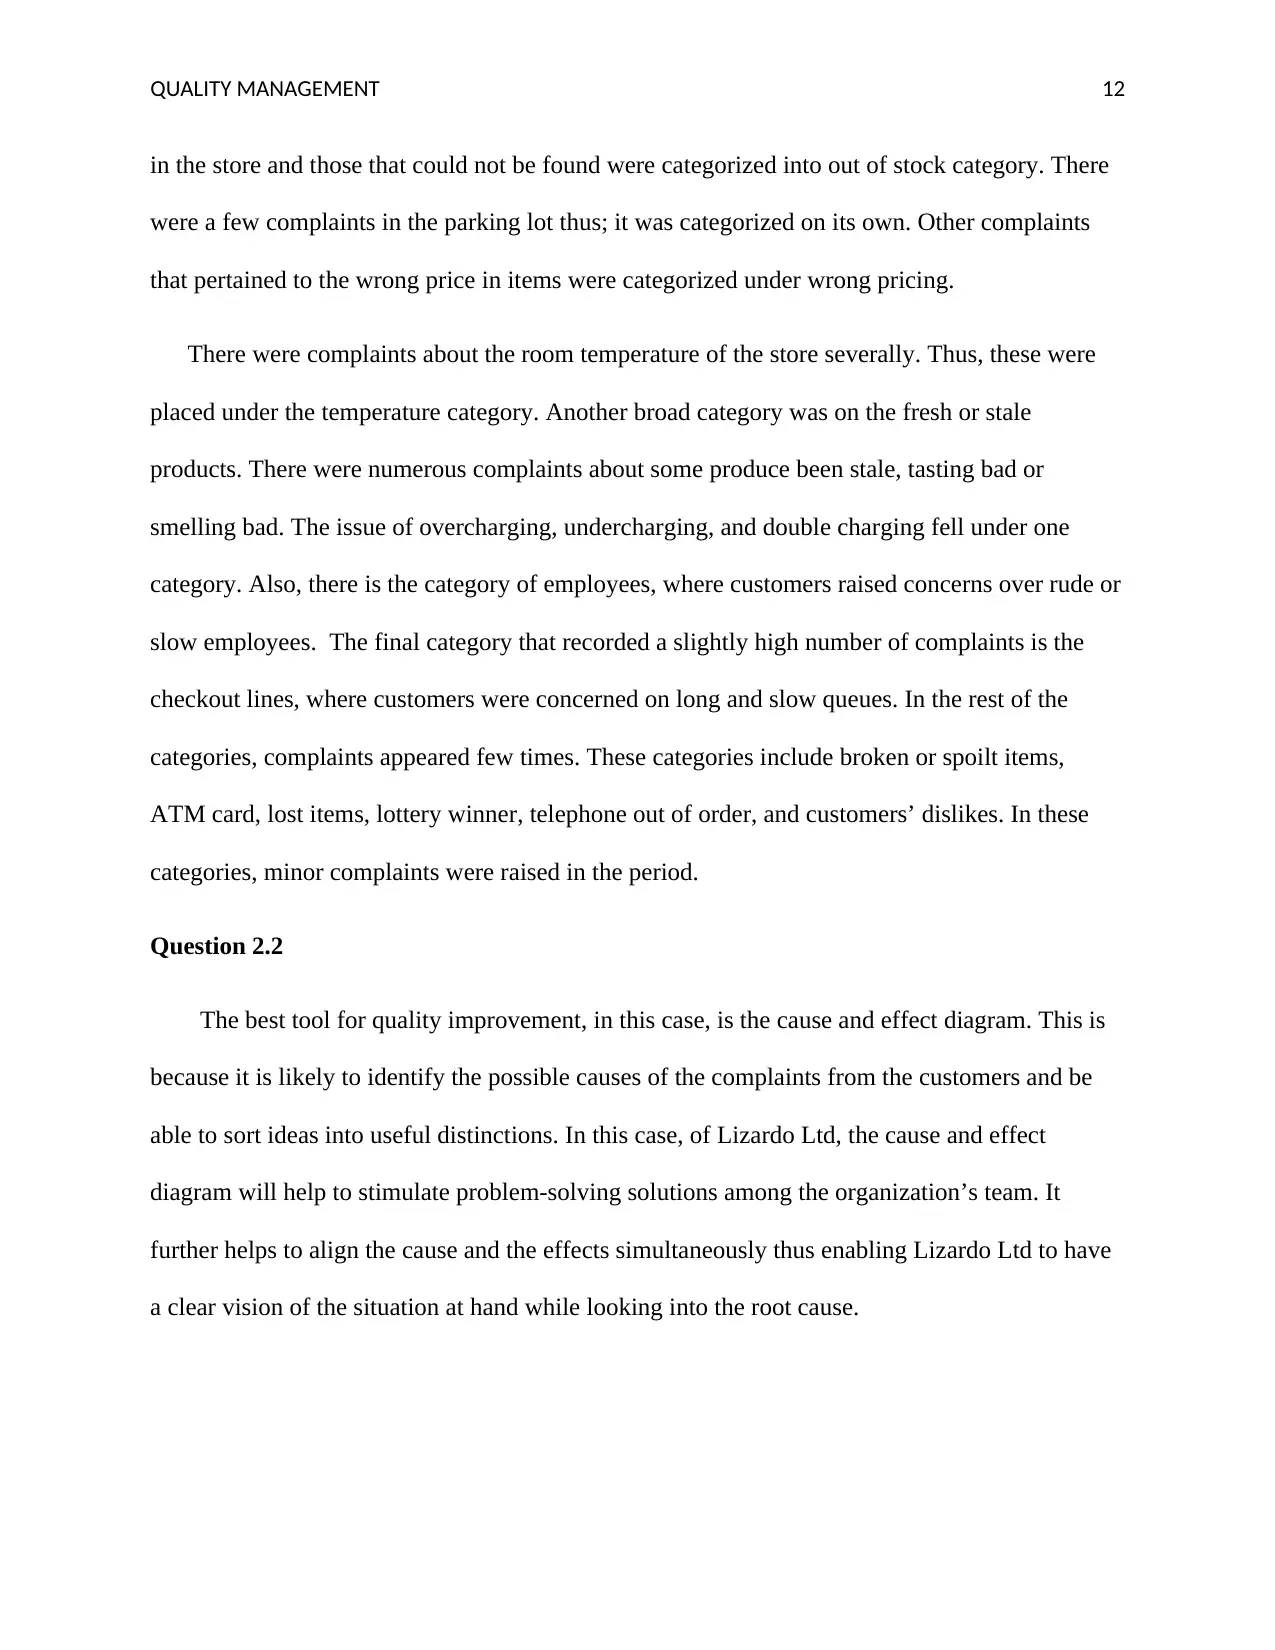
There were complaints about the room temperature of the store severally. Thus, these were
placed under the temperature category. Another broad category was on the fresh or stale
products. There were numerous complaints about some produce been stale, tasting bad or
smelling bad. The issue of overcharging, undercharging, and double charging fell under one
category. Also, there is the category of employees, where customers raised concerns over rude or
slow employees. The final category that recorded a slightly high number of complaints is the
checkout lines, where customers were concerned on long and slow queues. In the rest of the
categories, complaints appeared few times. These categories include broken or spoilt items,
ATM card, lost items, lottery winner, telephone out of order, and customers’ dislikes. In these
categories, minor complaints were raised in the period.
Question 2.2
The best tool for quality improvement, in this case, is the cause and effect diagram. This is
because it is likely to identify the possible causes of the complaints from the customers and be
able to sort ideas into useful distinctions. In this case, of Lizardo Ltd, the cause and effect
diagram will help to stimulate problem-solving solutions among the organization’s team. It
further helps to align the cause and the effects simultaneously thus enabling Lizardo Ltd to have
a clear vision of the situation at hand while looking into the root cause.
in the store and those that could not be found were categorized into out of stock category. There
were a few complaints in the parking lot thus; it was categorized on its own. Other complaints
that pertained to the wrong price in items were categorized under wrong pricing.
There were complaints about the room temperature of the store severally. Thus, these were
placed under the temperature category. Another broad category was on the fresh or stale
products. There were numerous complaints about some produce been stale, tasting bad or
smelling bad. The issue of overcharging, undercharging, and double charging fell under one
category. Also, there is the category of employees, where customers raised concerns over rude or
slow employees. The final category that recorded a slightly high number of complaints is the
checkout lines, where customers were concerned on long and slow queues. In the rest of the
categories, complaints appeared few times. These categories include broken or spoilt items,
ATM card, lost items, lottery winner, telephone out of order, and customers’ dislikes. In these
categories, minor complaints were raised in the period.
Question 2.2
The best tool for quality improvement, in this case, is the cause and effect diagram. This is
because it is likely to identify the possible causes of the complaints from the customers and be
able to sort ideas into useful distinctions. In this case, of Lizardo Ltd, the cause and effect
diagram will help to stimulate problem-solving solutions among the organization’s team. It
further helps to align the cause and the effects simultaneously thus enabling Lizardo Ltd to have
a clear vision of the situation at hand while looking into the root cause.
QUALITY MANAGEMENT 13
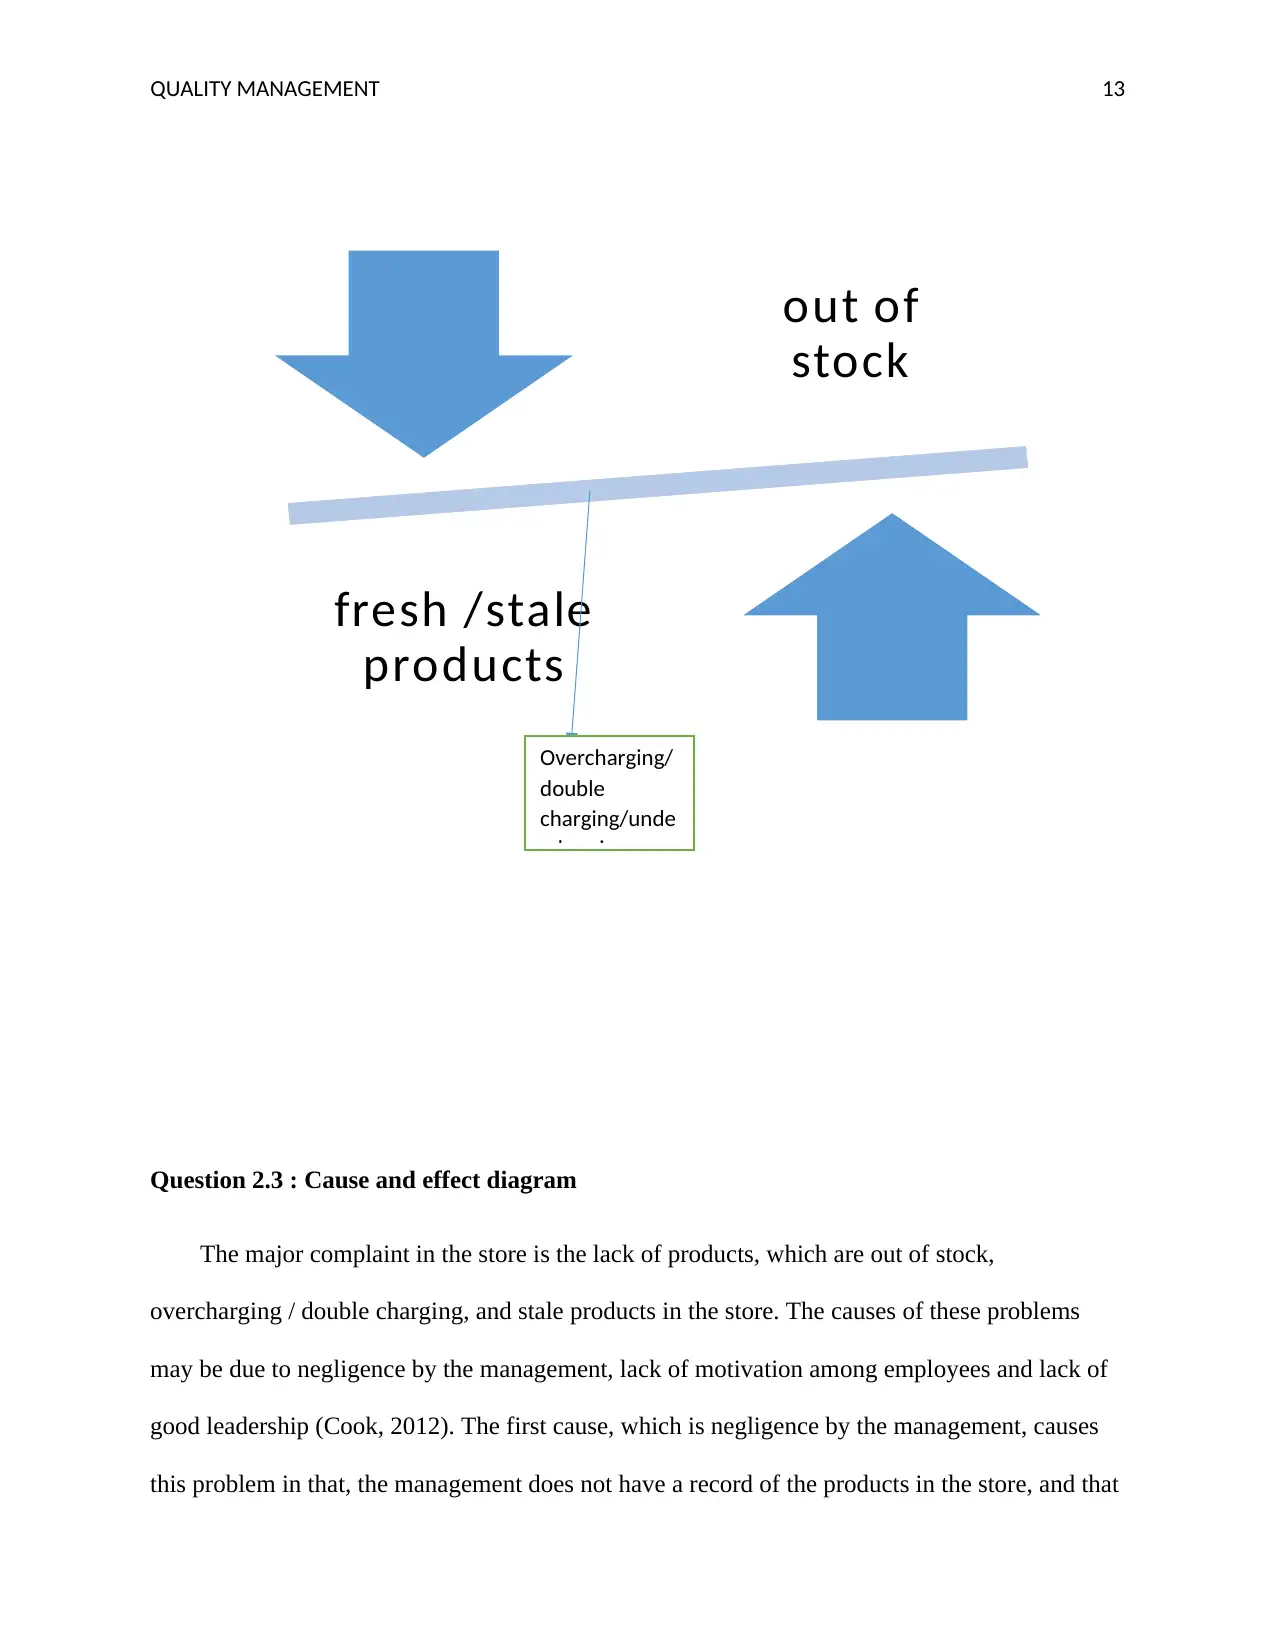
Question 2.3 : Cause and effect diagram
The major complaint in the store is the lack of products, which are out of stock,
overcharging / double charging, and stale products in the store. The causes of these problems
may be due to negligence by the management, lack of motivation among employees and lack of
good leadership (Cook, 2012). The first cause, which is negligence by the management, causes
this problem in that, the management does not have a record of the products in the store, and that
out of
stock
fresh /stale
products
Overcharging/
double
charging/unde
rcharging
Paraphrase This Document
Need a fresh take? Get an instant paraphrase of this document with our AI Paraphraser
QUALITY MANAGEMENT 14
is why they take long to restock. Again, the failure of the management plays a major role in the
way employees are treating customers. The management should change its overall staff to create
a management team that is willing to put effort and improve the performance of the store. Also,
the management can create employee-management sessions to discuss any issues arising in the
store that could affect the productivity performance.
The lack of motivation among employees in the store plays a major role, in the cause of the
problems facing the organization. Employees lack morale and the drive towards their job. They
are not satisfied. To curb this problem, the management should train their employees as well as
provide some modes of motivation to create some morale in the workforce. By so doing the
employees, are likely to love their job. The management should further include employees in
decision making pertaining the store, which creates a sense of belonging among the employees.
The store lacks good leadership, and that is why there are various complaints from
customers. Good leadership will ensure that customers are served right, and their complaints are
handled soon enough before they become a major issue. Good leadership can be achieved by
either training the already existing leaders or choosing new ones to run the store.
QUALITY MANAGEMENT 15
Question 2.4: Run chart
Jan-01
Jan-02
Jan-03
Jan-04
Jan-05
Jan-06
Jan-07
Jan-08
Jan-09
Jan-10
Jan-11
Jan-12
Jan-13
Jan-14
Jan-15
Jan-16
Jan-17
Jan-18
Jan-19
Jan-20
Jan-21
Jan-22
Jan-23
Jan-24
Jan-25
Jan-26
Jan-27
Jan-28
Jan-29
0%
10%
20%
30%
40%
50%
60%
70%
80%
90%
100%
Run chart indicating the number of complaints between
1st June and 27th July.
Series 1 Series 2 Column1
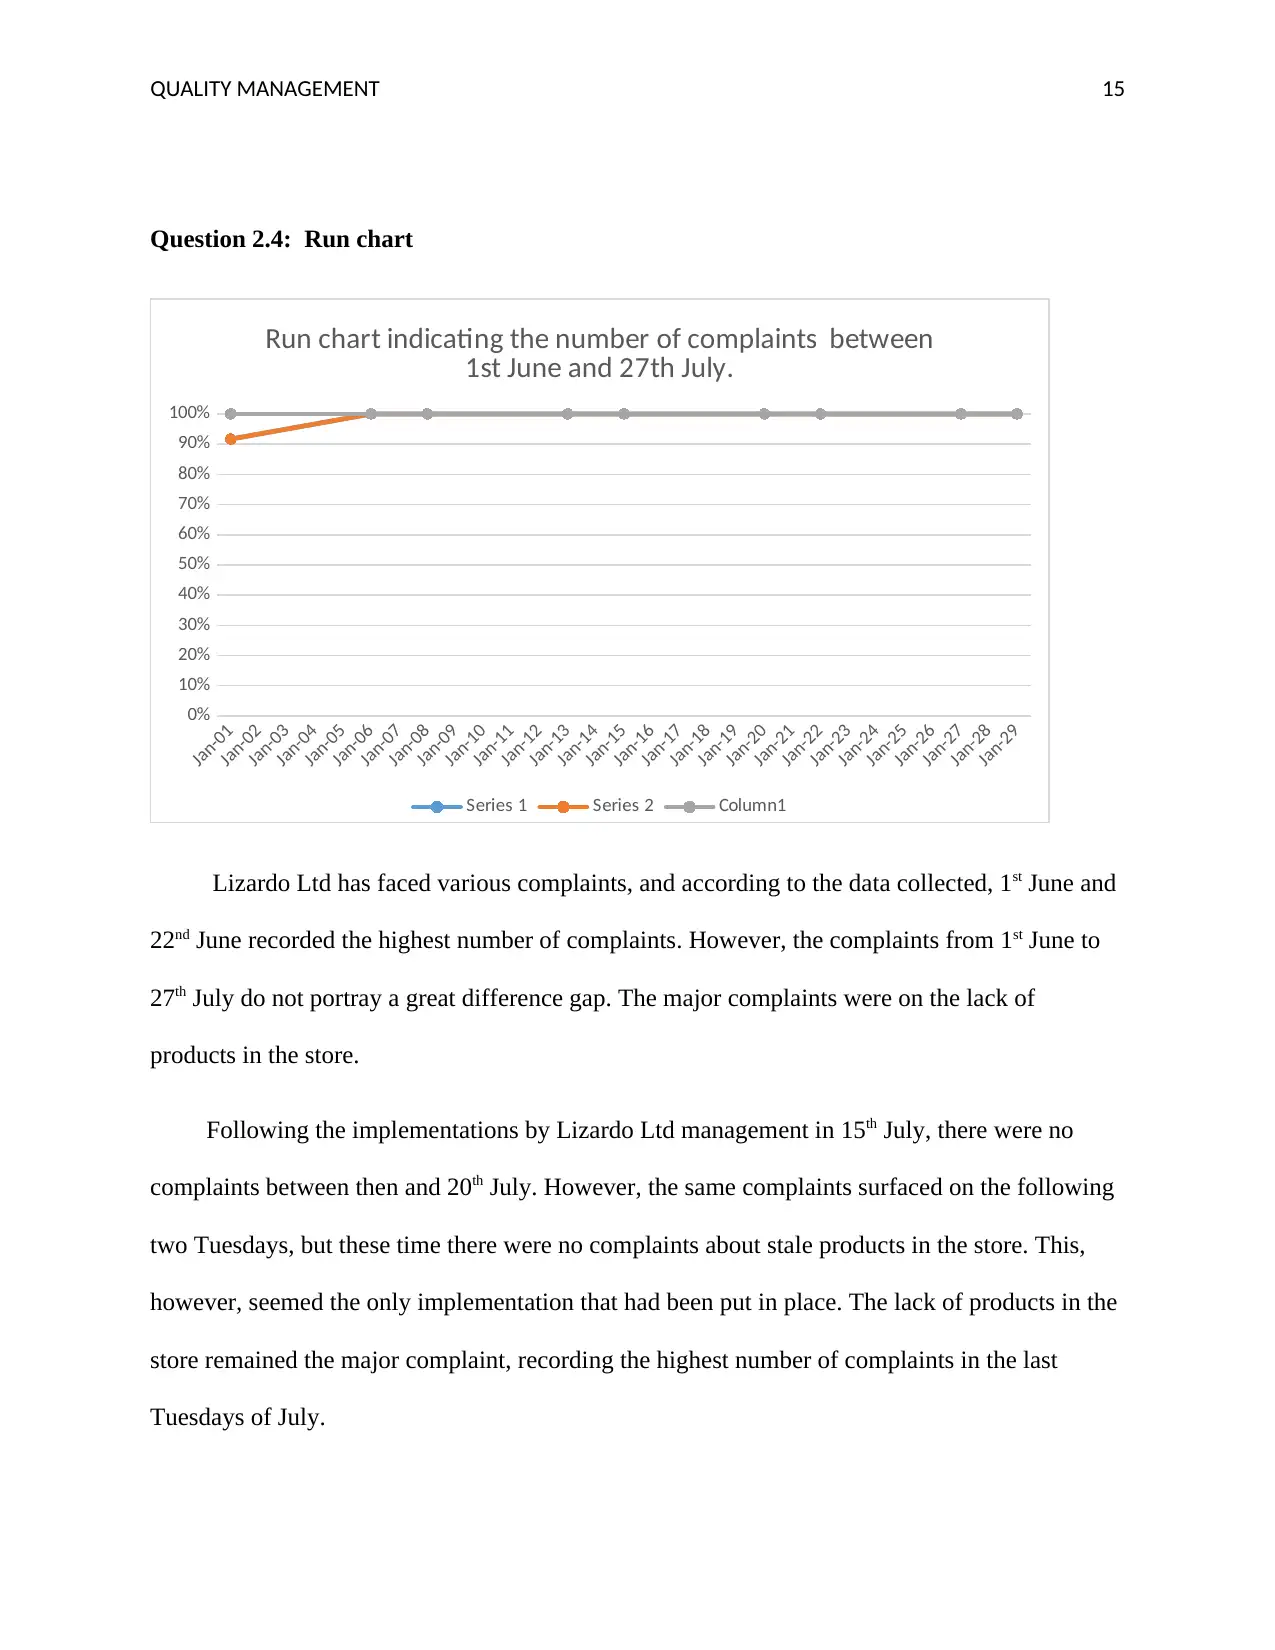
Lizardo Ltd has faced various complaints, and according to the data collected, 1st June and
22nd June recorded the highest number of complaints. However, the complaints from 1st June to
27th July do not portray a great difference gap. The major complaints were on the lack of
products in the store.
Following the implementations by Lizardo Ltd management in 15th July, there were no
complaints between then and 20th July. However, the same complaints surfaced on the following
two Tuesdays, but these time there were no complaints about stale products in the store. This,
however, seemed the only implementation that had been put in place. The lack of products in the
store remained the major complaint, recording the highest number of complaints in the last
Tuesdays of July.
Question 2.4: Run chart
Jan-01
Jan-02
Jan-03
Jan-04
Jan-05
Jan-06
Jan-07
Jan-08
Jan-09
Jan-10
Jan-11
Jan-12
Jan-13
Jan-14
Jan-15
Jan-16
Jan-17
Jan-18
Jan-19
Jan-20
Jan-21
Jan-22
Jan-23
Jan-24
Jan-25
Jan-26
Jan-27
Jan-28
Jan-29
0%
10%
20%
30%
40%
50%
60%
70%
80%
90%
100%
Run chart indicating the number of complaints between
1st June and 27th July.
Series 1 Series 2 Column1
Lizardo Ltd has faced various complaints, and according to the data collected, 1st June and
22nd June recorded the highest number of complaints. However, the complaints from 1st June to
27th July do not portray a great difference gap. The major complaints were on the lack of
products in the store.
Following the implementations by Lizardo Ltd management in 15th July, there were no
complaints between then and 20th July. However, the same complaints surfaced on the following
two Tuesdays, but these time there were no complaints about stale products in the store. This,
however, seemed the only implementation that had been put in place. The lack of products in the
store remained the major complaint, recording the highest number of complaints in the last
Tuesdays of July.
QUALITY MANAGEMENT 16
Question 2.5
The challenge of dealing with customer complaints is that you need to deal with them and
still leave the customer feeling satisfied. I would love to recommend the following strategies for
dealing with customer complaints in future. First, there is need to listen to the customer
attentively without defending yourself first, let the customer speak, and you assure him or her
that the problem will be handled correctly. Secondly, apologize to the customer without blaming.
You need to say sorry and do not put blames on anyone in the organization. Thirdly, ask the
opinion of the customer. What would be the ideal solution to the problem from their side?
Finally, yet importantly, do not challenge the customer’s complaint. Even when the customer is
wrong, just listen to them and thank them for sharing out the problem with your organization.
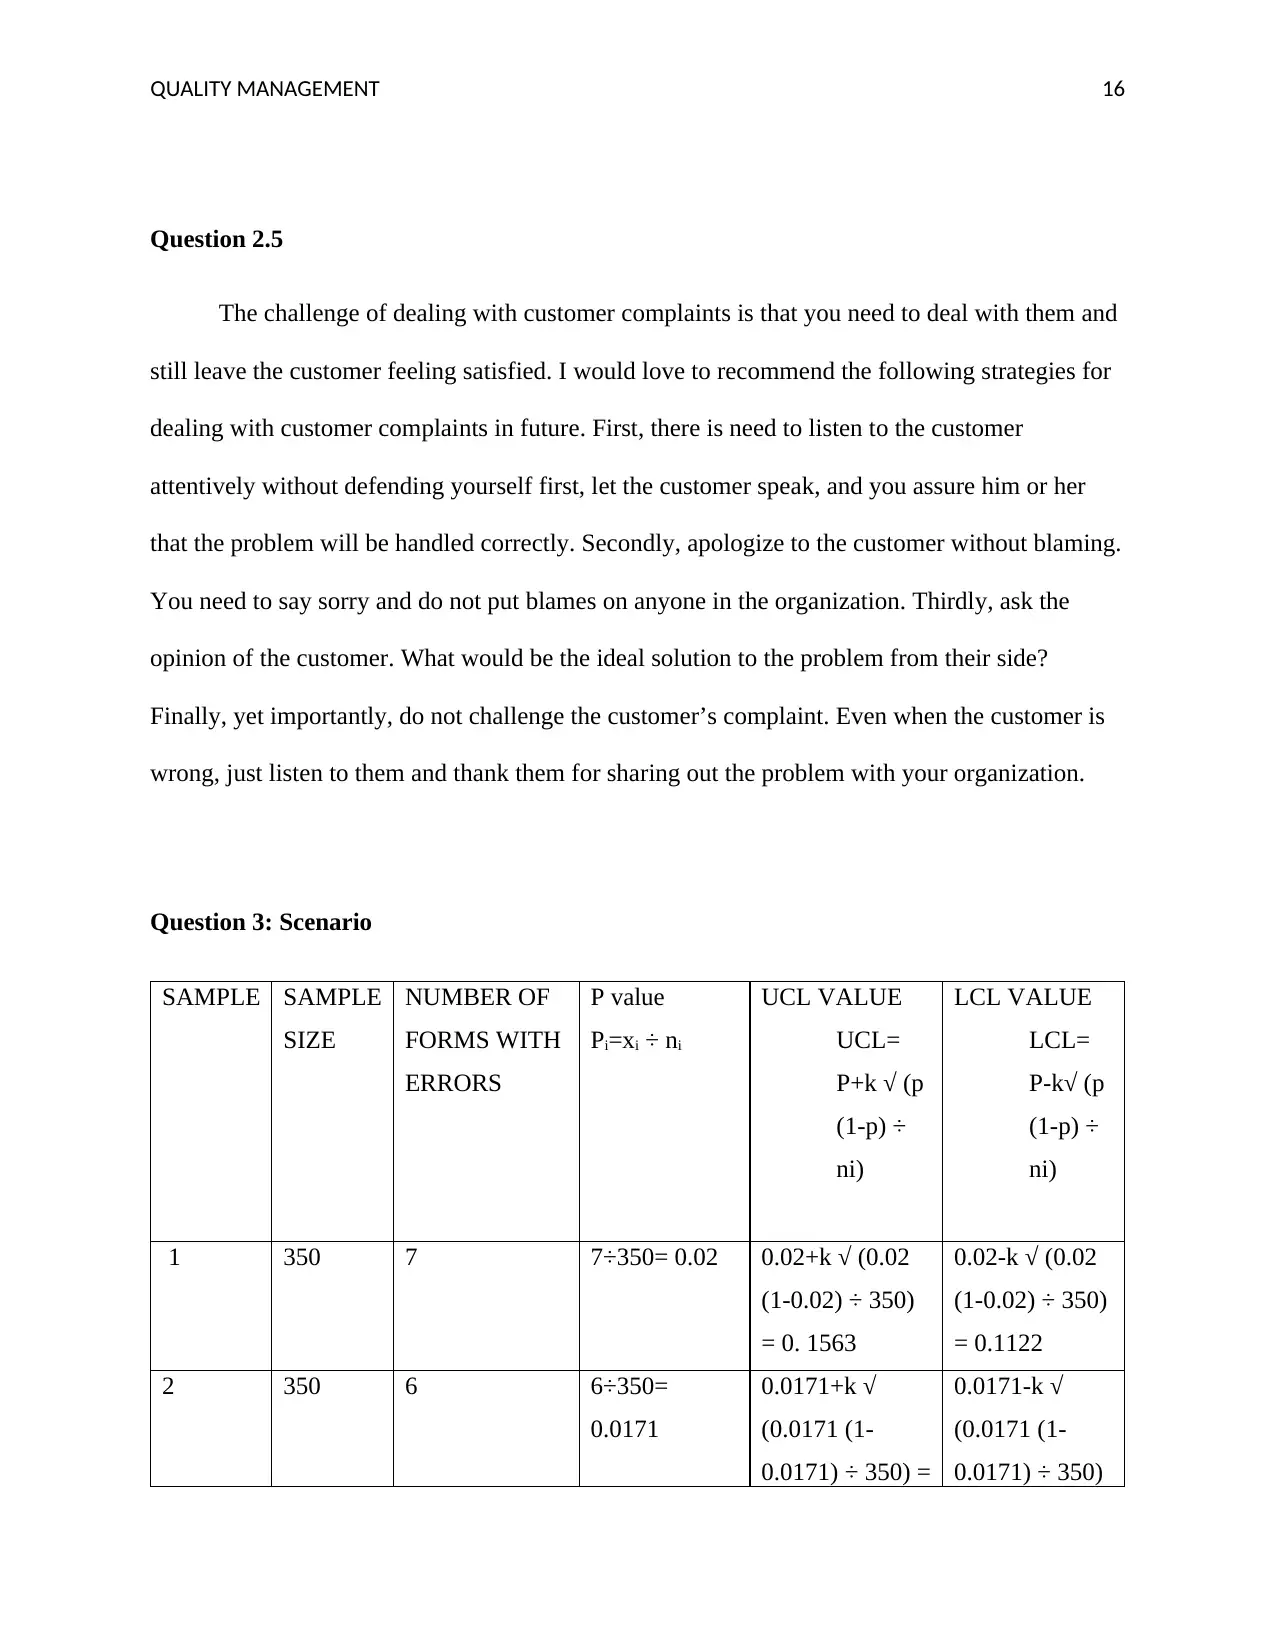
Question 3: Scenario
SAMPLE SAMPLE
SIZE
NUMBER OF
FORMS WITH
ERRORS
P value
Pi=xi ÷ ni
UCL VALUE
UCL=
P+k √ (p
(1-p) ÷
ni)
LCL VALUE
LCL=
P-k√ (p
(1-p) ÷
ni)
1 350 7 7÷350= 0.02 0.02+k √ (0.02
(1-0.02) ÷ 350)
= 0. 1563
0.02-k √ (0.02
(1-0.02) ÷ 350)
= 0.1122
2 350 6 6÷350=
0.0171
0.0171+k √
(0.0171 (1-
0.0171) ÷ 350) =
0.0171-k √
(0.0171 (1-
0.0171) ÷ 350)
Question 2.5
The challenge of dealing with customer complaints is that you need to deal with them and
still leave the customer feeling satisfied. I would love to recommend the following strategies for
dealing with customer complaints in future. First, there is need to listen to the customer
attentively without defending yourself first, let the customer speak, and you assure him or her
that the problem will be handled correctly. Secondly, apologize to the customer without blaming.
You need to say sorry and do not put blames on anyone in the organization. Thirdly, ask the
opinion of the customer. What would be the ideal solution to the problem from their side?
Finally, yet importantly, do not challenge the customer’s complaint. Even when the customer is
wrong, just listen to them and thank them for sharing out the problem with your organization.
Question 3: Scenario
SAMPLE SAMPLE
SIZE
NUMBER OF
FORMS WITH
ERRORS
P value
Pi=xi ÷ ni
UCL VALUE
UCL=
P+k √ (p
(1-p) ÷
ni)
LCL VALUE
LCL=
P-k√ (p
(1-p) ÷
ni)
1 350 7 7÷350= 0.02 0.02+k √ (0.02
(1-0.02) ÷ 350)
= 0. 1563
0.02-k √ (0.02
(1-0.02) ÷ 350)
= 0.1122
2 350 6 6÷350=
0.0171
0.0171+k √
(0.0171 (1-
0.0171) ÷ 350) =
0.0171-k √
(0.0171 (1-
0.0171) ÷ 350)
Secure Best Marks with AI Grader
Need help grading? Try our AI Grader for instant feedback on your assignments.
QUALITY MANAGEMENT 17
0.22881 = 0.012262
3 350 5 5÷350=
0.1428
0.1428+k √
(0.1428 (1-
0.1428) ÷ 350)
0.425252
0.1428-k √
(0.1428 (1-
0.1428) ÷ 350)
= 0.013232
4 350 0 0÷350= 0 0+k √ (0(1-0.) ÷
350)= 0
0-k √ (0(1-0.) ÷
350)= 0
5 350 0 0÷350= 0 0+k √ (0 (1-0) ÷
350)= 0
0-k √ (0 (1-0) ÷
350)= 0
6 350 5 5÷350=
0.1428
0.1428+k √
(0.1428 (1-
0.1428) ÷ 350)=
0.5526267
0.1428-k √
(0.1428 (1-
0.1428) ÷ 350)
= 0.088173
7 350 6 6÷350=
0.0171
0.0171+k √
(0.0171 (1-
0.0171) ÷ 350) =
0.0727
0.0171-k √
(0.0171 (1-
0.0171) ÷ 350)
= 0.018282
8 350 3 3÷350=
0.0085
0.0085+k √
(0.0085 (1-
0.085) ÷ 350)
0.21324
0.0085-k √
(0.0085 (1-
0.085) ÷ 350) =
0.01122
9 350 4 4÷350=0.0114 0.0114+k √
(0.0114 (1-
0.0114) ÷ 350) =
0.0083
0.0114-k √
(0.0114 (1-
0.0114) ÷ 350)
= 0.016262
10 350 2 2÷350=
0.0057
0.0057+k √
(0.0057 (1-
0.0057) ÷ 350) =
0.332414
0.0057-k √
(0.0057 (1-
0.0057) ÷ 350)
= 0.11223
11 350 1 1÷350=
0.0028
0.0028+k √
(0.0028(1-
0.0028-k √
(0.0028(1-
QUALITY MANAGEMENT 18
0.0028) ÷ 350) =
0.373721
0.0028) ÷ 350)
= 0.1222
12 350 8 8÷350=0.0228 0.0228+k √
(0.0228 (1-
0.0228) ÷ 350)
0.0228-k √
(0.0228 (1-
0.0228) ÷ 350)
= 0.0016662
13 350 9 9÷350=0.0257 0.0257+k √
(0.0257 (1-
0.257) ÷ 350)
0.1424
0.0257-k √
(0.0257 (1-
0.257) ÷ 350)
=0.17626762
14 350 10 10÷350=
0.028
0.028+k √
(0.028 (1-0.028)
÷ 350) 0.143242
0.028-k √
(0.028 (1-
0.028) ÷ 350)
0.162662
15 350 11 11÷350=
0.031
0.02+k √ (0.031
(1-0.031) ÷ 350)
= 0. 661553
0.02-k √ (0.031
(1-0.031) ÷
350) =
0.1442552
16 350 6 6÷350=0.0171 0.00171+k √
(0.0171 (1-
0.0171) ÷ 350) =
0.00199
0.00171-k √
(0.0171 (1-
0.0171) ÷ 350)
0.176772
17 350 5 5÷350=
0.1428
0.1428+k √
(0.1428 (1-
0.1428) ÷ 350)
=0.117723
0.1428-k √
(0.1428 (1-
0.1428) ÷ 350)
0.01911
18 350 4 4÷350=
0.0114
0.0114+k √
(0.0114 (1-
0.0114) ÷ 350)
=0.13322
0.0114-k √
(0.0114 (1-
0.0114) ÷ 350)
0.076737
16 350 2 2÷350= 0.0057+k √ 0.0057-k √
QUALITY MANAGEMENT 19
0.0057 (0.0057 (1-
0.0057) ÷ 350)
0.166272
(0.0057 (1-
0.0057) ÷ 350)
=0.08882
20 350 0 0÷350= 0 0+k √ ( (1-0) ÷
350)= 0
0-k √ ( (1-0) ÷
350)= 0
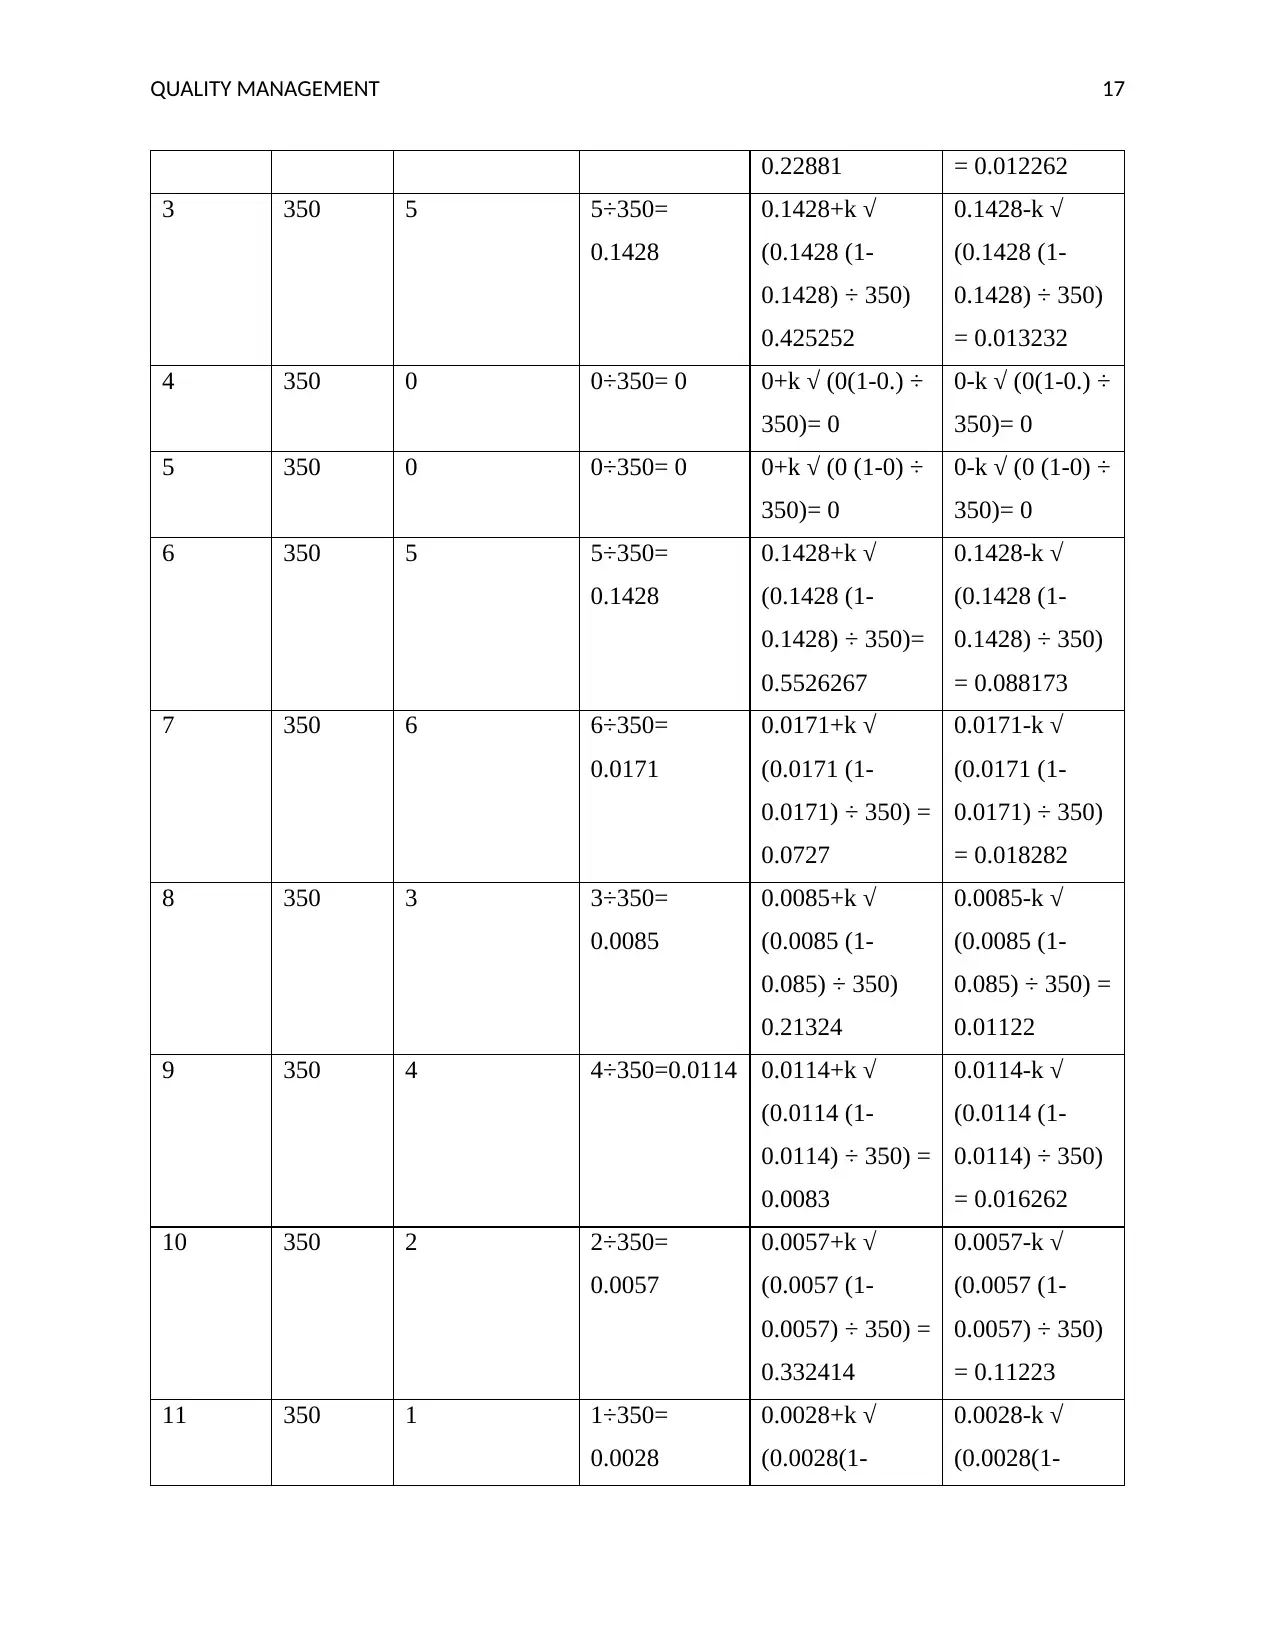
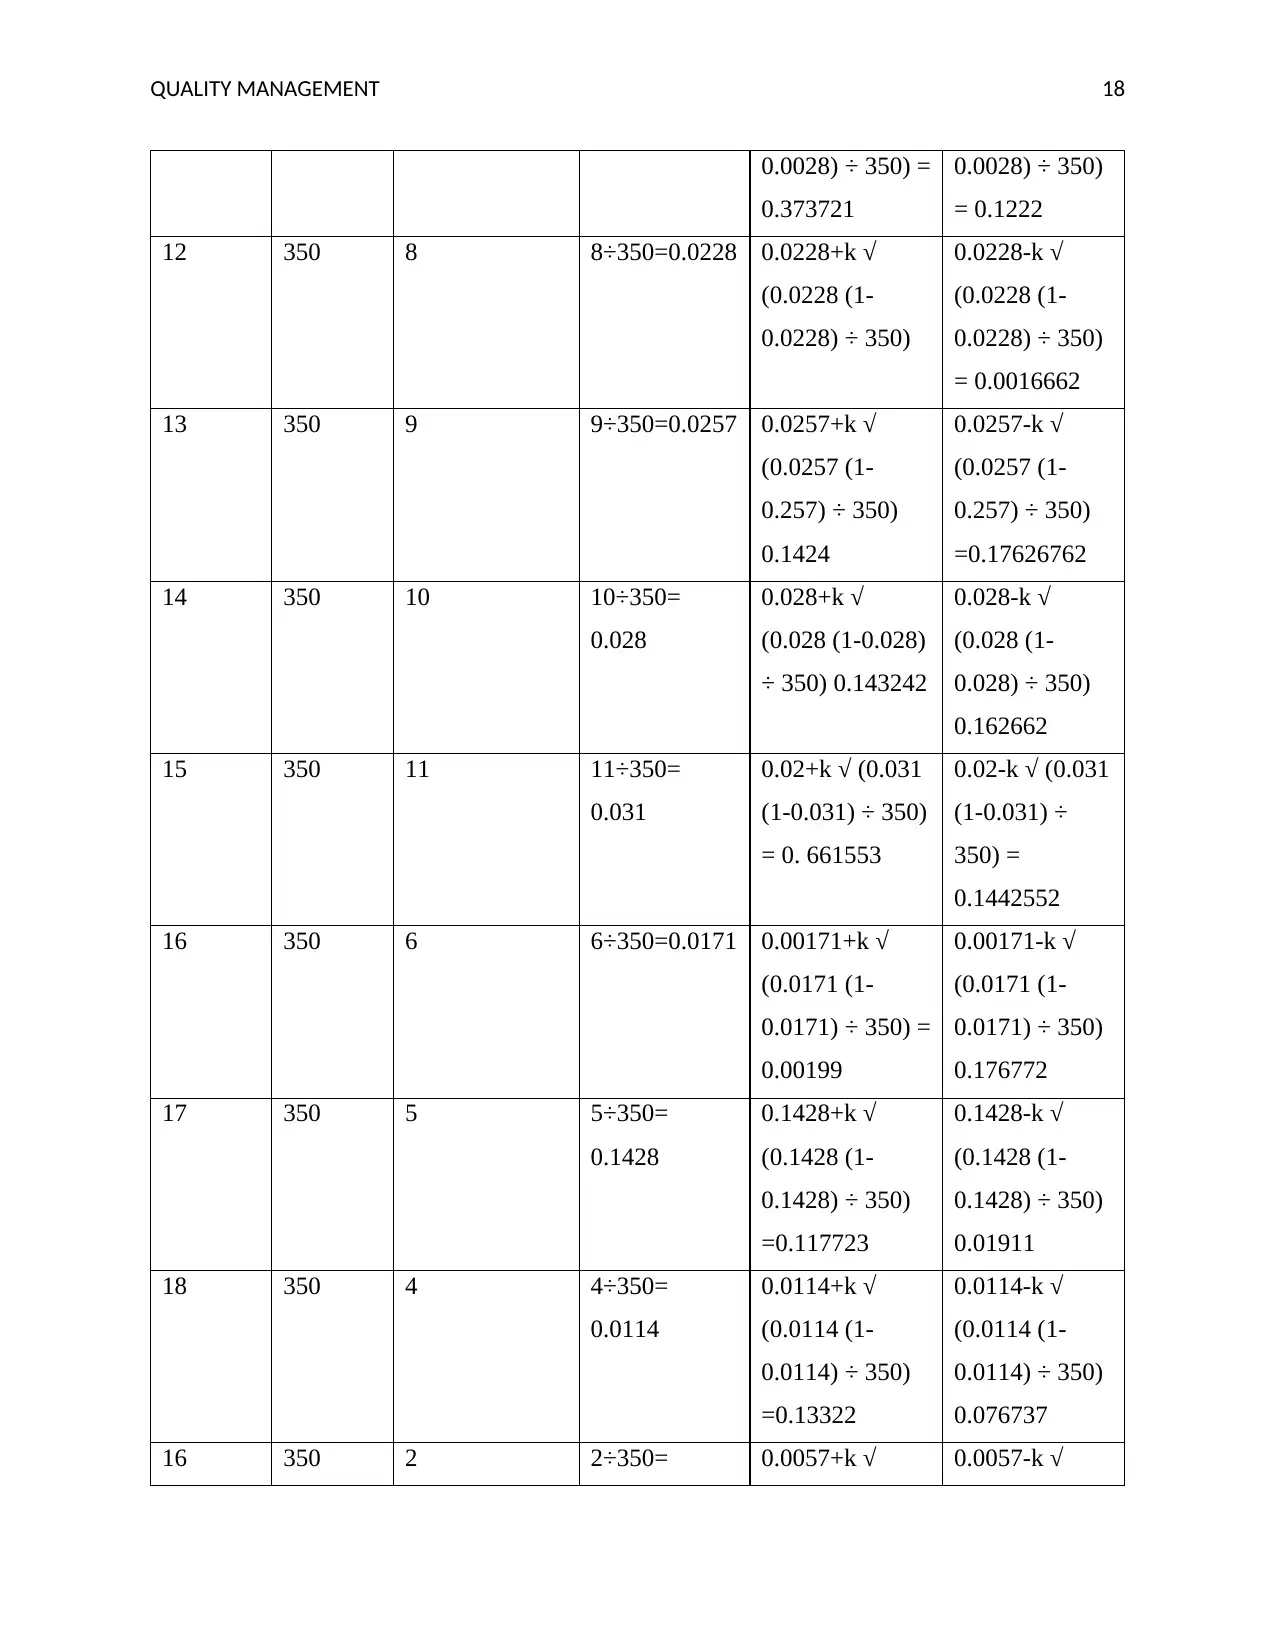
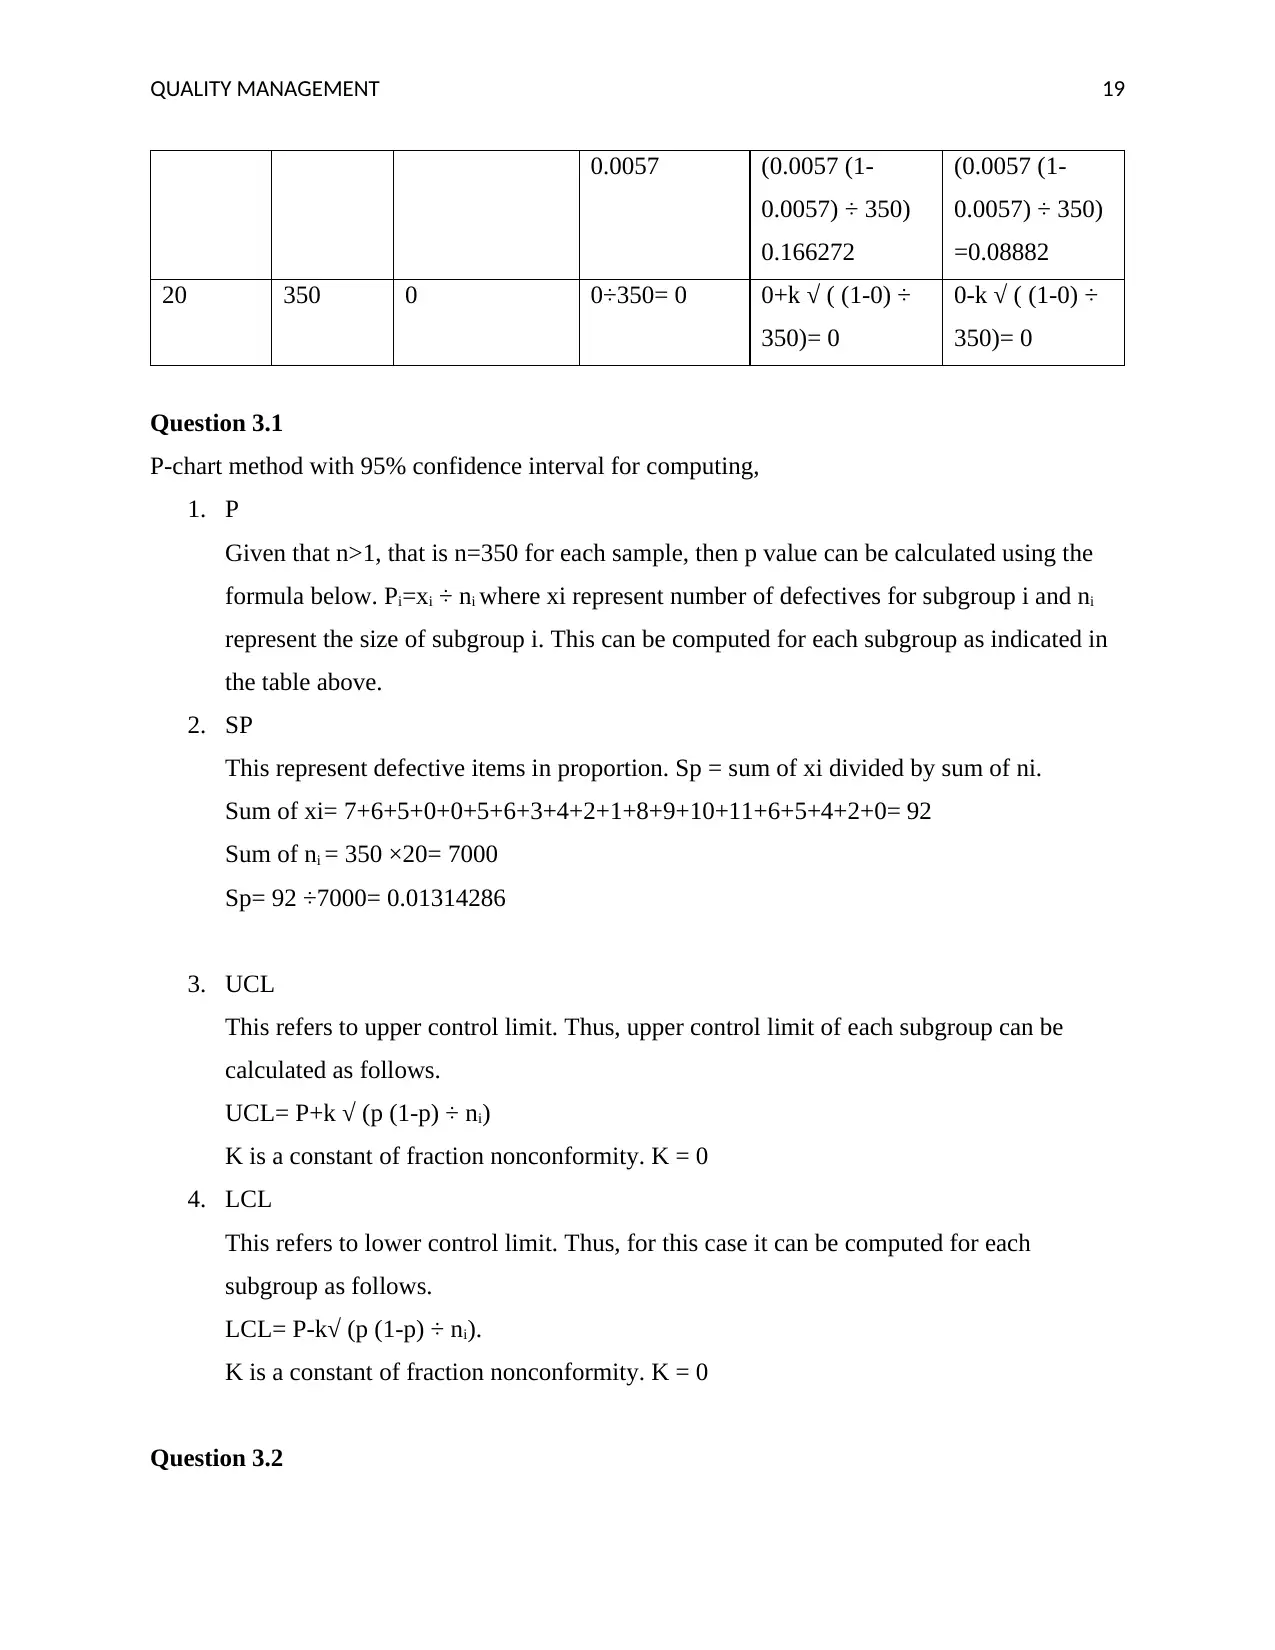
Question 3.1
P-chart method with 95% confidence interval for computing,
1. P
Given that n>1, that is n=350 for each sample, then p value can be calculated using the
formula below. Pi=xi ÷ ni where xi represent number of defectives for subgroup i and ni
represent the size of subgroup i. This can be computed for each subgroup as indicated in
the table above.
2. SP
This represent defective items in proportion. Sp = sum of xi divided by sum of ni.
Sum of xi= 7+6+5+0+0+5+6+3+4+2+1+8+9+10+11+6+5+4+2+0= 92
Sum of ni = 350 ×20= 7000
Sp= 92 ÷7000= 0.01314286
3. UCL
This refers to upper control limit. Thus, upper control limit of each subgroup can be
calculated as follows.
UCL= P+k √ (p (1-p) ÷ ni)
K is a constant of fraction nonconformity. K = 0
4. LCL
This refers to lower control limit. Thus, for this case it can be computed for each
subgroup as follows.
LCL= P-k√ (p (1-p) ÷ ni).
K is a constant of fraction nonconformity. K = 0
Question 3.2
0.0057 (0.0057 (1-
0.0057) ÷ 350)
0.166272
(0.0057 (1-
0.0057) ÷ 350)
=0.08882
20 350 0 0÷350= 0 0+k √ ( (1-0) ÷
350)= 0
0-k √ ( (1-0) ÷
350)= 0
Question 3.1
P-chart method with 95% confidence interval for computing,
1. P
Given that n>1, that is n=350 for each sample, then p value can be calculated using the
formula below. Pi=xi ÷ ni where xi represent number of defectives for subgroup i and ni
represent the size of subgroup i. This can be computed for each subgroup as indicated in
the table above.
2. SP
This represent defective items in proportion. Sp = sum of xi divided by sum of ni.
Sum of xi= 7+6+5+0+0+5+6+3+4+2+1+8+9+10+11+6+5+4+2+0= 92
Sum of ni = 350 ×20= 7000
Sp= 92 ÷7000= 0.01314286
3. UCL
This refers to upper control limit. Thus, upper control limit of each subgroup can be
calculated as follows.
UCL= P+k √ (p (1-p) ÷ ni)
K is a constant of fraction nonconformity. K = 0
4. LCL
This refers to lower control limit. Thus, for this case it can be computed for each
subgroup as follows.
LCL= P-k√ (p (1-p) ÷ ni).
K is a constant of fraction nonconformity. K = 0
Question 3.2
Paraphrase This Document
Need a fresh take? Get an instant paraphrase of this document with our AI Paraphraser
QUALITY MANAGEMENT 20
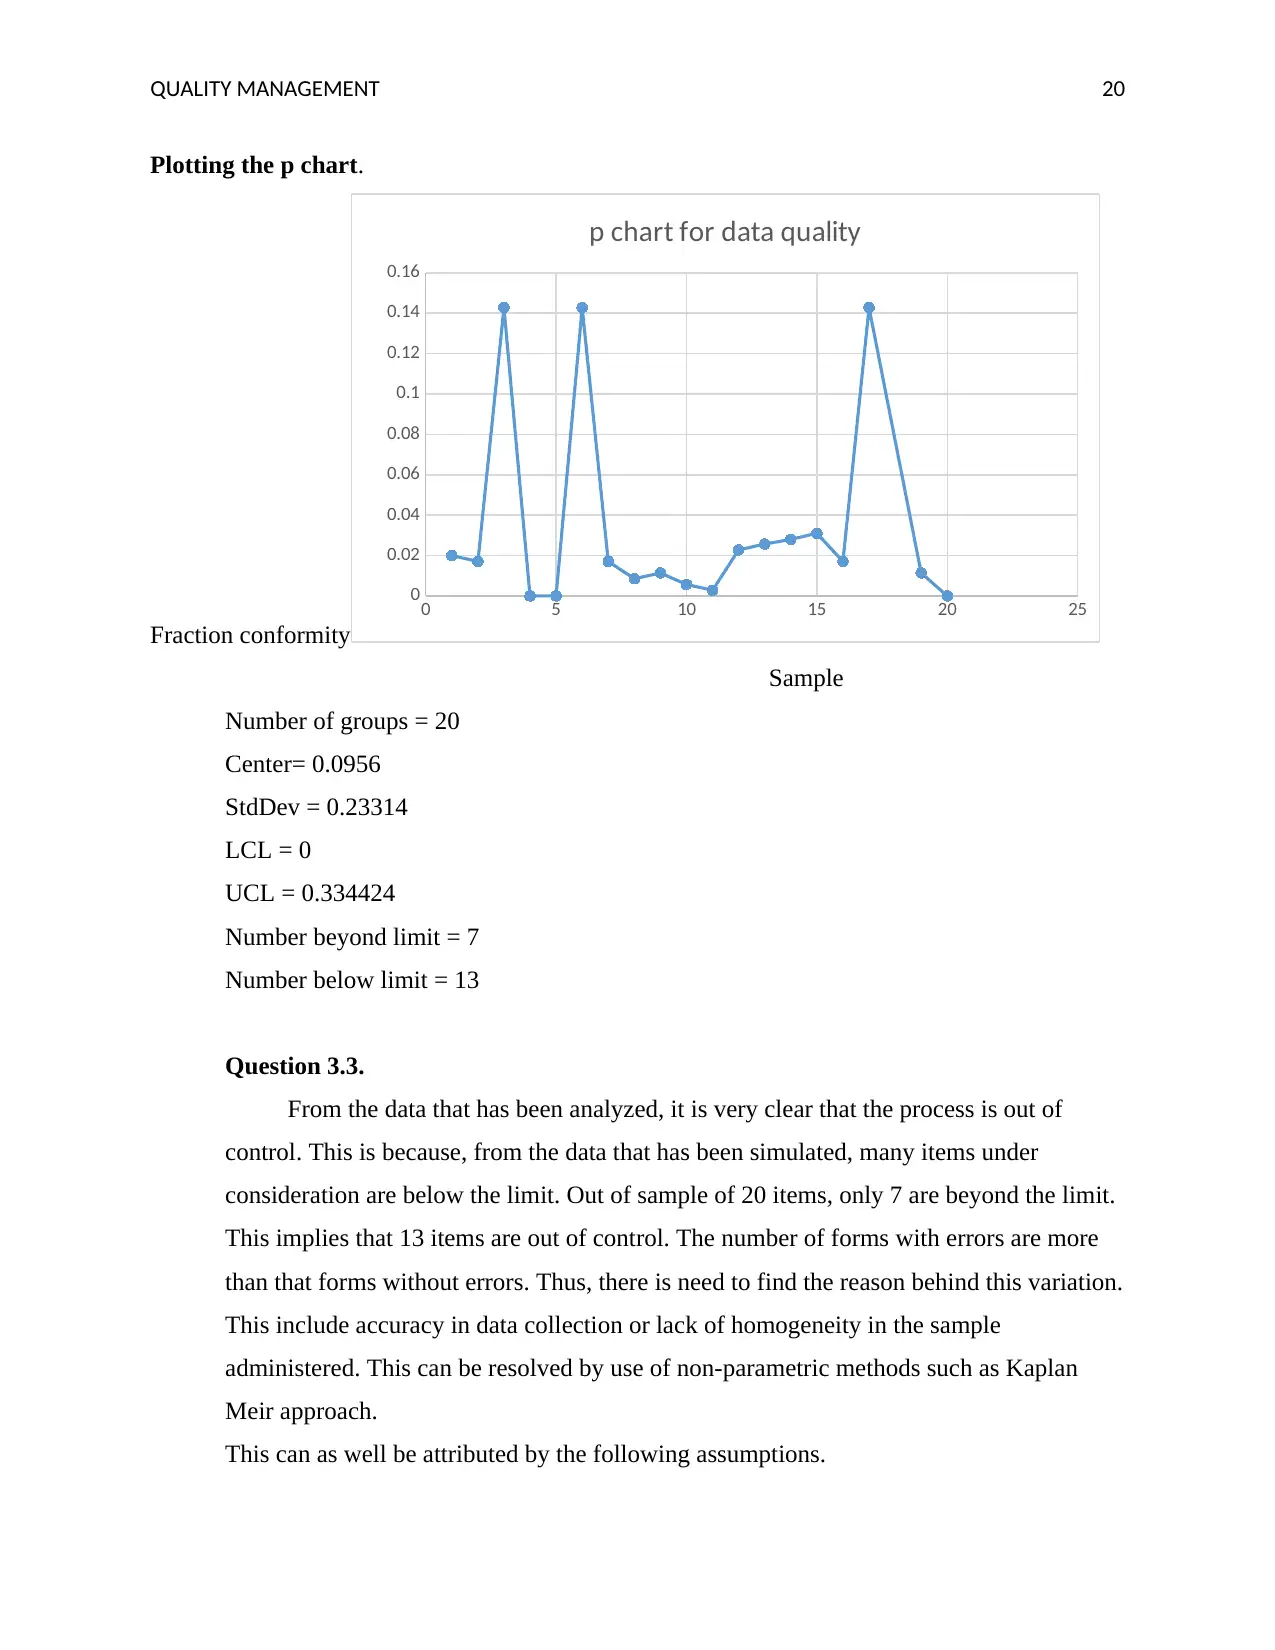
Plotting the p chart.
Fraction conformity
0 5 10 15 20 25
0
0.02
0.04
0.06
0.08
0.1
0.12
0.14
0.16
p chart for data quality
Sample
Number of groups = 20
Center= 0.0956
StdDev = 0.23314
LCL = 0
UCL = 0.334424
Number beyond limit = 7
Number below limit = 13
Question 3.3.
From the data that has been analyzed, it is very clear that the process is out of
control. This is because, from the data that has been simulated, many items under
consideration are below the limit. Out of sample of 20 items, only 7 are beyond the limit.
This implies that 13 items are out of control. The number of forms with errors are more
than that forms without errors. Thus, there is need to find the reason behind this variation.
This include accuracy in data collection or lack of homogeneity in the sample
administered. This can be resolved by use of non-parametric methods such as Kaplan
Meir approach.
This can as well be attributed by the following assumptions.
QUALITY MANAGEMENT 21
1. P, which represent the probability of conformity, was not the same in each unit.
2. Individual unit was not independent of the successor or predecessor unit.
3. Use of control limits from binomial distribution instead of observed sample variance.
4. The p chart may be implemented wrongly due to control limits being too narrow or
too wide.
QUALITY MANAGEMENT 22
References
Brue, G. (2015). Six Sigma for managers.
Cook, S. (2012). Complaint Management Excellence: Creating Customer Loyalty Through
Service Recovery. London: Kogan Page.
De, S. G. M. S. (2016). Basic metrology for iso 9000 certification. Place of publication not
identified: Routledge.
DUPUY, R. O. B. E. R. T. (2015). WHAT YOU SHOULD KNOW WHEN CHOOSING A
CERTIFICATION BODY FOR ISO CERTIFICATION SO YOU DON'T GET... RIPPED
OFF: Are you tired of business un-assurance. S.l.: OUTSKIRTS PRESS.
García-Alcaraz, J. L., Oropesa-Vento, M., & Maldonado-Macías, A. A. (2017). Kaizen planning,
implementing and controlling.
Jaccard, M., & Ljundberg, N. (2013). The objective is quality: Introduction to quality,
performance, and sustainability management systems. Lausanne: EPFL Press.
Jaccard, M. (2013). The objective is quality: Introduction to quality, performance, and
sustainability management systems. Boca Raton, Fla: London.
Karlgaard, R. (2014). The Soft Edge: Where Great Companies Find Lasting Success. Hoboken:
Wiley.
Oakland, J. S. (2014). Total quality management and operational excellence: Text with cases.
Rosmaini, T., & Universiti Tun Hussein Onn Malaysia. (2013). Total Quality management. Batu
Pahat: Penerbit UTHM.
1 out of 22
Related Documents


Your All-in-One AI-Powered Toolkit for Academic Success.
+13062052269
info@desklib.com
Available 24*7 on WhatsApp / Email
![[object Object]](/_next/static/media/star-bottom.7253800d.svg)
Unlock your academic potential
© 2024 | Zucol Services PVT LTD | All rights reserved.