Real World Analytics - Assignment
Added on 2021-06-18
12 Pages2380 Words59 Views
Running head: REAL WORLD ANALYTICSReal World AnalyticsName of Student:Name of University:Course ID:
REAL WORLD ANALYTICS1Table of ContentsBackground:.....................................................................................................................................2Dashboard Reporting:......................................................................................................................2Dashboard 1:................................................................................................................................2Dashboard 2:................................................................................................................................4Dashboard 3:................................................................................................................................4Dashboard 4:................................................................................................................................5Dashboard 5:................................................................................................................................6Dashboard 6:................................................................................................................................7Dashboard 7:................................................................................................................................8Conclusion:......................................................................................................................................8Recommendation:............................................................................................................................9References:....................................................................................................................................10
REAL WORLD ANALYTICS2Background:The population of the world is growing rapidly in recent years. To find the solution ofpopulation explosion, high amount of food and agricultural stuffs has become necessary toproduce food and agricultural products. The solutions depend on growth of production. Theconsidered data set provides an insight on the production worldwide. It focuses on a comparisonbetween food produced for human production of food and feed generation for animals. The FAOdata base of 2013 depends on the historical food balance sheet of 1961. The climate of recentdays is changing and it is both hampering and affecting the agricultural production. Food andagricultural organizations and entrepreneurs along with stake-holders are concentrating on thefactors of food production these days (Maye, 2016). The food production and food productionseem to be a hot topic these days as the population is expected to grow from 7.3 billion to 9.7billion till the end of 2050. The various types of food production and consumptions are regarded in this currentanalysis. The verities of “Items” and “Elements” such as “Food” (The amount that human bodyintakes) and “Feed” (The amount that livestock and poultry intake) are the key factors of theanalysis. The variability of consuming different types of items and elements are concentrated inthis occasion. Dashboard Reporting:The dashboard reporting is based on four crucial factors that are- “Objectives”, “CriticalMeasures”, “Projects” and “Action items”. Dashboards graphically focus on looks and layouts.The dashboards help us to manage the big data analysis. The considerable information, keyaspects, critical idea and action items could be delivered by dashboard representation. Thedashboard intelligence is a data visualization tool that depicts the current status of “KeyPerformance Indicators” (KPI) for an organization (Chen, Chiang & Storey, 2012). Thedashboard consolidates and prepare the performance scoreboards of essential features ofBusiness intelligence dashboard production or commodities (Hoyt et al., 2016). The dashboardsfeature the customizable interface and capability to pull real-time data from multiple sources.
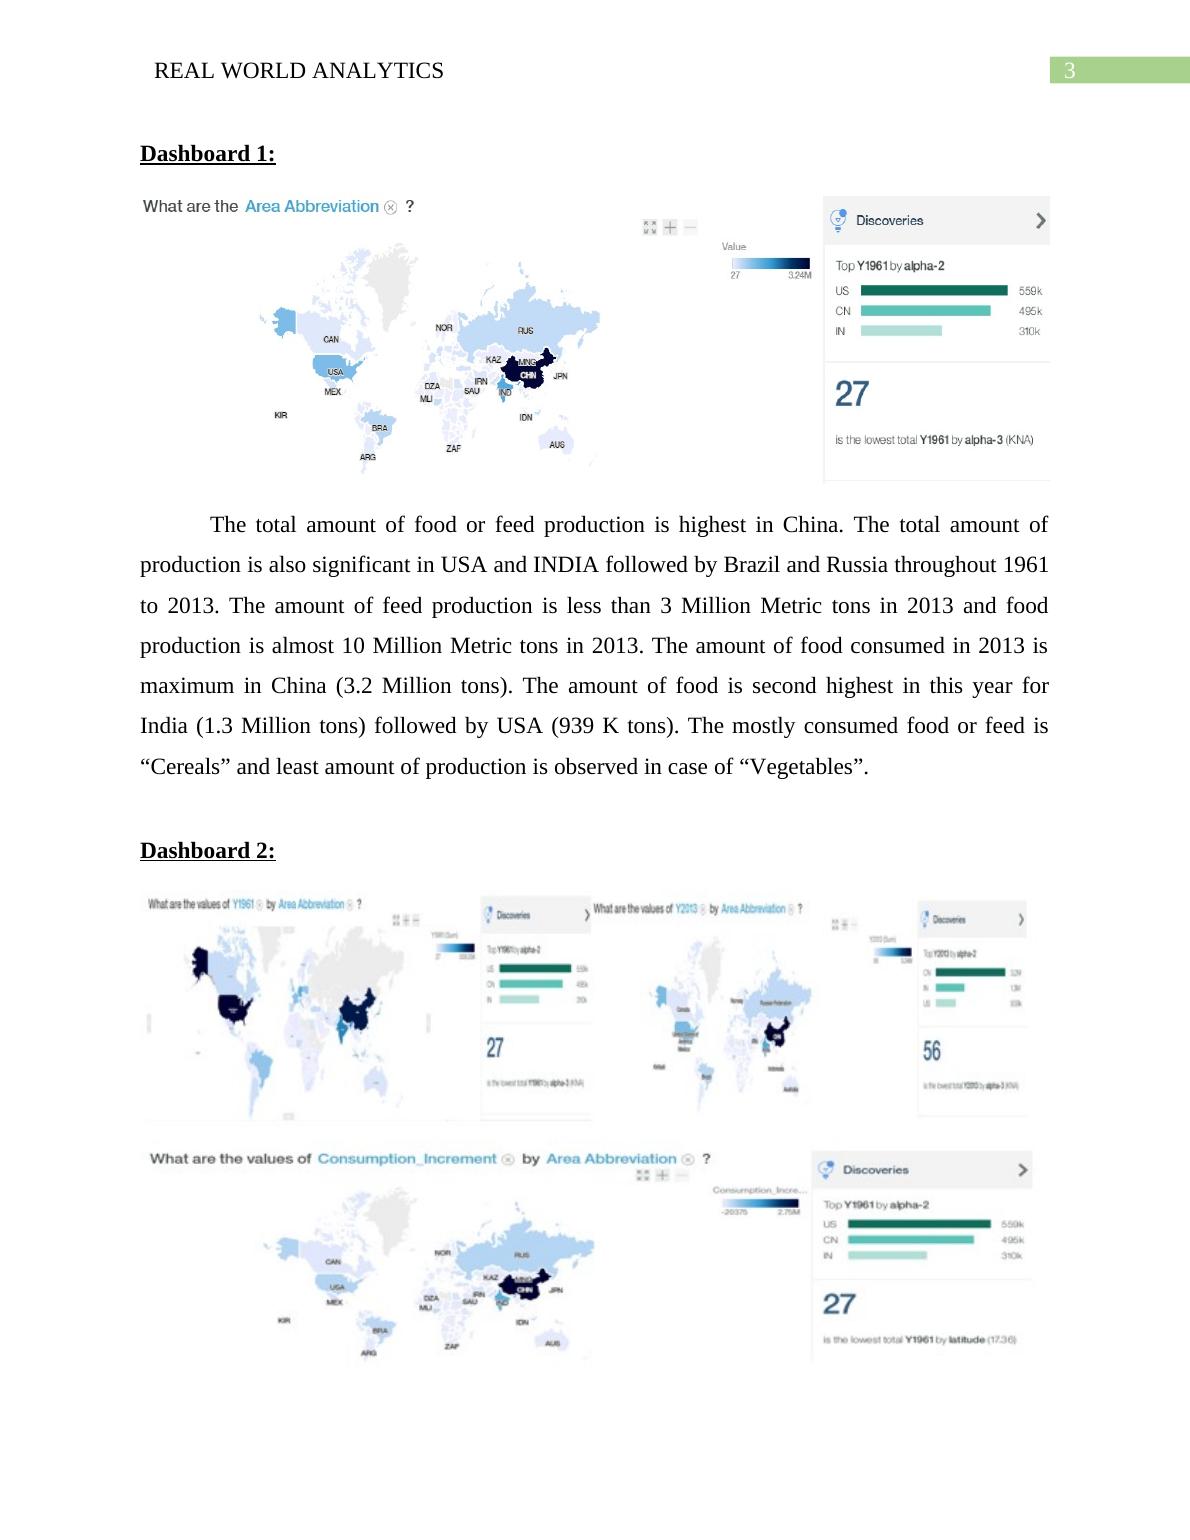
REAL WORLD ANALYTICS3Dashboard 1:The total amount of food or feed production is highest in China. The total amount ofproduction is also significant in USA and INDIA followed by Brazil and Russia throughout 1961to 2013. The amount of feed production is less than 3 Million Metric tons in 2013 and foodproduction is almost 10 Million Metric tons in 2013. The amount of food consumed in 2013 ismaximum in China (3.2 Million tons). The amount of food is second highest in this year forIndia (1.3 Million tons) followed by USA (939 K tons). The mostly consumed food or feed is“Cereals” and least amount of production is observed in case of “Vegetables”. Dashboard 2:
End of preview
Want to access all the pages? Upload your documents or become a member.
Related Documents
(PDF) Real-Time Big Data Analyticslg...
|15
|3504
|158
Statistics and Business research Methodlg...
|14
|2609
|40
Real Time Analytics for Food Production and Consumptionlg...
|16
|2525
|177
Real Time Analytics for Global Food Consulting Firmlg...
|17
|4264
|334
Real World Analytics: Trends in Production and Consumption of Food, Feed and Meatlg...
|12
|2651
|266
Study of Consumption of Wheat and Products over the World: Real Time Analyticslg...
|18
|4359
|133