Comprehensive Literature Review: Regression Models and Analysis
VerifiedAdded on 2023/06/13
|14
|2679
|126
Literature Review
AI Summary
This literature review provides a comprehensive overview of regression models and their applications, starting with an introduction to regression analysis, its origins, and its role in studying the relationship between response and predictor variables. It discusses various regression techniques, including linear, logistic, polynomial, stepwise, ridge, and lasso regression, highlighting their specific uses and advantages. The review also identifies key stakeholders involved in regression analysis projects and outlines the necessary resources, such as statistical software and hardware components like the Cyton board. Furthermore, it details the practical steps for setting up and utilizing the Cyton board for data acquisition, emphasizing the importance of proper configuration and connectivity. The review concludes by underscoring the benefits of regression analysis in identifying significant relationships, assessing the impact of independent variables, and facilitating comparisons across different scales.

Name of the Student
Name of the professor
Institution Affiliation
City/State
Year/ Month/ Day
Name of the professor
Institution Affiliation
City/State
Year/ Month/ Day
Paraphrase This Document
Need a fresh take? Get an instant paraphrase of this document with our AI Paraphraser

LITERATURE REVIEW
Introduction
Regression model
Regression analysis is among the common methods used for statistical analysis. It was
founded by Sir Francis Galton. Regression assists in studying how a response variable depends
on single or many predictors. Low dimensional sufficient summary plot is pursued in regression
graphics. These are the type of plots which do not require construction model but they have all
the information needed from the predictors. Regression analysis is also an extension of
correlation and it provides the evaluator with an opportunity to relationship outcome with an
interval-level variable. Dependent variable sometimes is known as Y- caused by other variables
and independent variables which is also referred to as X- and it is caused changes independent
variables [1]. The proper predictor when the correlation is zero is the mean
Numerous simulation procedures were developed in order to facilitate the performance. The
calibration procedure for programs assists in the formation of baseline models which were
developed in the 1990s. a graphical procedure is developed to allow visual based analysis of data
based on computer simulation. The calibrated approaches are used follow;
Either the post-retrofit or base year data unreliable or unavailable
The facility and the data can be modeled by well-documented simulation software
An experienced simulation professional is available and is funded adequately by the
collecting appropriate input data and calibrating the simulation model [2].
Regression approach also allows modeling, examining and exploring spatial relationship
and explain the factors such as observing the spatial pattern. It can also be used for prediction
and it is also a starting point for all spatial regression analyses. Mapping is also done in
regression. It simply involves re-projecting the entire map in order to fit the other one. Mapping
regression is carried out by comparing the features individually and the process involves
resolving differences between the map scales [1].
The neural network helps in the provision of the attractive way to determine the data on
the dependent factors [3]. The neural network is appropriately viewed as a set of powerful non-
⊘ This is a preview!⊘
Do you want full access?
Subscribe today to unlock all pages.
Trusted by 1+ million students worldwide
linear factors. The neural network can also be used as a pre-processor in order to replace the data
which are missing.
Scope of work
The regression model is a statistical procedure which enables a researcher to estimate the
linear, or straight line, a relationship that shows the relation between two or more variables. It is
this linear relationship that summarizes the amount of change in another variable(s). This model
may sometimes be used in testing the statistical importance, for instance, to test whether the
observed linear relationship could have emerged by chance or not. It is in this second course that
statistical methods, multivariate regression with relationships among several variables are
examined and discussed [4].
The two major variable regression model assigns one of the variables the status of an
independent variable while assigning the other variable the status of a dependent variable. The
independent variable is known to be the causative agent of changes in the dependent variable, or
the independent variable may occur prior in time to the independent variable. It can be noticed
that the researcher in our case cannot be certain of a causal relationship, even with the regression
model [5]. Moreover, if at all the researcher has a to make one of the variables an independent
variable, then the manner in which this independent variable is associated with changes in the
dependent variable can be estimated. When using the regression model, one needs to examine the
expression of the straight line first and this is given in the next section. It is by following this
procedure that we can arrive at the formula for determining the regression line from the observed
data [2].
Paraphrase This Document
Need a fresh take? Get an instant paraphrase of this document with our AI Paraphraser
Linear Relationships
In the regression model, the independent variable is labeled as X variable whereas the
dependent variable is named a Y variable. The relationship that exists between the X and Y
variables can be shown on a graph, with the independent variable X along the horizontal axis and
the dependent variable Y along the vertical axis. The purpose of the regression model is to
determine the straight line relationship which connects the X and Y.
The algebraic expression of a straight line connecting any two variables, that X and Y, is
given by the following equation; Y = a + bX, Where a = Y intercept, b = slope of the line. So, as
long as the intercept and the slope of the line can be determined, then this can entirely enable a
researcher to determine the straight line. The slope of the line, b, which is the steepness of the
line regardless of its sharp rise or maybe a fair flatness [7].
The aim of the regression model is to find a slope and intercept so that the straight line with
that slope and intercept best fits the points in the scatter diagram as closely as possible [8]. It is
also possible for an individual to note that only two points are enough to help determine a
straight line. In a case where only one point is given, then it implies that there could be many
lines passing through this point, but whenever two points are given, then it authentically defines
the straight line that passes through these two points [9]. The below section shows how a straight
line that provides the best fit to the points of the scatter diagram can be found;
Regression analysis is used in modeling the relationship between a response variable and
one or more predictor variables. There are multiple benefits of using regression analysis. They
are as follow;

It indicates the significant relationship between independent relationships and
dependent relationship
It indicates the strength of impact of multiple independent variables on the dependent
variable on a dependent variable.
Regression also allows as to make the comparison of the effects of the variable
measured on different scales. These benefits enable the data analyst to eliminate and
evaluate the best set of variables.
Stakeholders
There a number of stakeholders who will be involved in this project namely
Project manager; who will be the project leader
Project team members who will the group executing the project but under the management of
the manager [6].
Project sponsor and this will assist my project with finance
Steering Committee who will assist my project with advisory services on key decisions.
The executive will be needed for this project to assist in executing the project.
The resource managers will also be needed to assist in controlling the resources needed for
executing the project
Types of regression techniques
These are numerous kinds of regression technique and they are mostly driven by three
metrics that are the number of independent variables, type of dependent variables and shape of
the regression line.
⊘ This is a preview!⊘
Do you want full access?
Subscribe today to unlock all pages.
Trusted by 1+ million students worldwide
Linear regression
It is one the most known method for modeling. Linear regression establishes a relationship
between independent variable (X) and dependent variables using a best fit straight line which is
known as the regression line. It is represented by an equation Y=a+bX+e. The equation can be
used in predicting the value of target variable based on the predictor variable. Multiple linear
regression consists of independent variables while simple linear regression has one independent
only.
Logistic Regression
This type of regression is used in finding the probability of event-success and event failure.
The logistic regression is used when the dependent variable is binary in nature [10].
Polynomial Regression
A regression is referred as the polynomial regression in case the independent variable power
is more than 1 and its best fit line is not a straight line but a curve.
Stepwise Regression
This type of regression is applied when dealing with multiples independent variables. An
automatic process is applied in this technique in the selection of independent variables [11]. The
aim of this modeling approach is maximizing the number of predictor variables with a minimized
number of the predictor. This method assists in handling higher dimensionality of data set.
Ridge Regression
Paraphrase This Document
Need a fresh take? Get an instant paraphrase of this document with our AI Paraphraser

This ridge regression technique is used when the data suffers from multicollinearity
independent variables. Ridge regression uses shrinkage parameter in solving multicollinearity
problems [12].
Lasso regression
This type of regression is similar to ridge regression but it is capable of reducing the
variability and improving the linear regression models. This model is capable of improving the
accuracy and reducing the variability of linear regression models [13].
The following factors need to be practical in order to select the appropriate regression
model such as if the data set has multiple confounding variables, depends on objective, high
dimensionality, and multicollinearity among the variables
Resources needed for the project
A number of resources are needed for regression analysis namely; the met calculator which
contain statistics calculator which enables the user to input some data and plots logarithmic
function, linear quadratic, exponential and cubic [14].
Cyton Board Technical Specification
OpenBCI 32bit Board;
Low noise input channels.
Compatible with an active and passive electrode
Channel data resolution of 24-bit
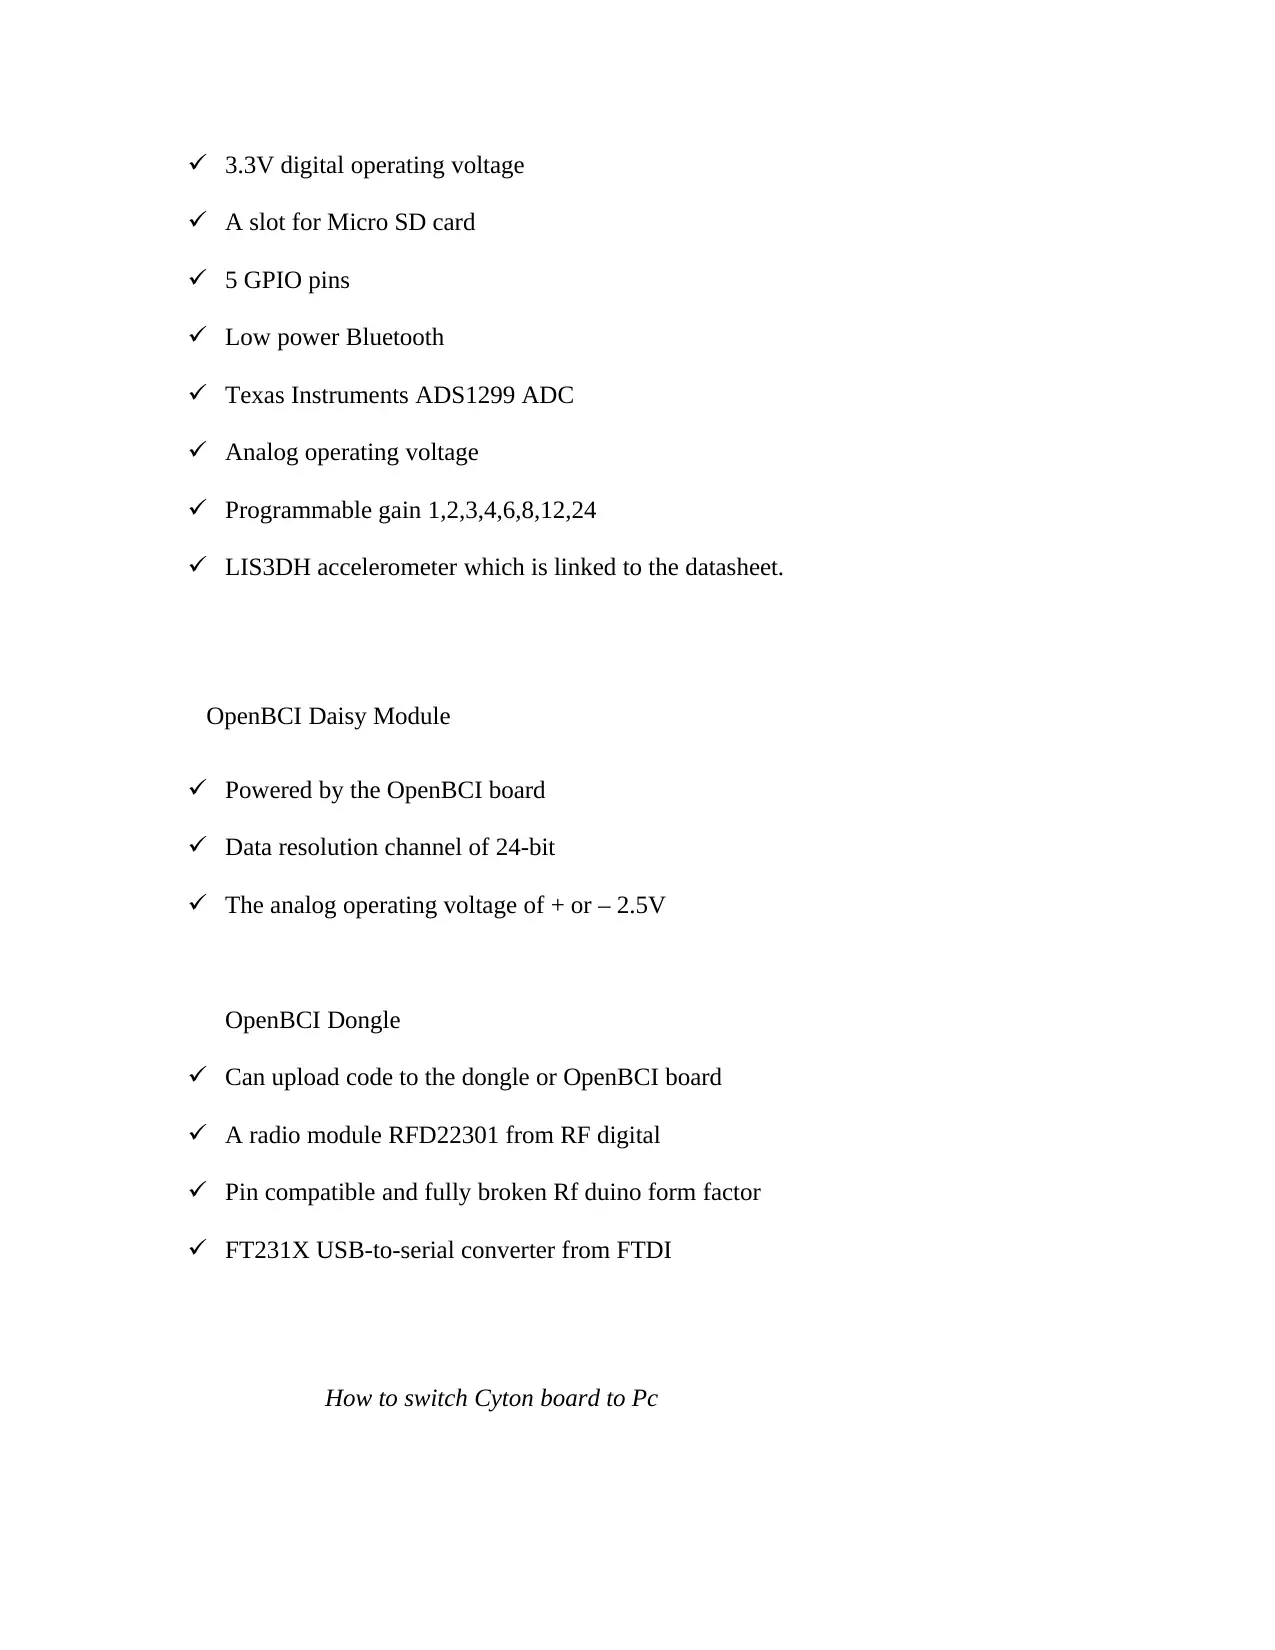
3.3V digital operating voltage
A slot for Micro SD card
5 GPIO pins
Low power Bluetooth
Texas Instruments ADS1299 ADC
Analog operating voltage
Programmable gain 1,2,3,4,6,8,12,24
LIS3DH accelerometer which is linked to the datasheet.
OpenBCI Daisy Module
Powered by the OpenBCI board
Data resolution channel of 24-bit
The analog operating voltage of + or – 2.5V
OpenBCI Dongle
Can upload code to the dongle or OpenBCI board
A radio module RFD22301 from RF digital
Pin compatible and fully broken Rf duino form factor
FT231X USB-to-serial converter from FTDI
How to switch Cyton board to Pc
⊘ This is a preview!⊘
Do you want full access?
Subscribe today to unlock all pages.
Trusted by 1+ million students worldwide

The small switch should be moved on the right side of the board from OFF to PC. A blue LED
blink as soon as the operation is done. If the LED fails to blink, ensure that the battery is full and
if the battery is full then there is need of consulting hardware section. It is important to plug in
dongle before the Cyton board is turned on and in case the data stream is broken, then you need
to unplug your USB Dongle then proceed to power down the Cyton board [15].
Connect to your Cyton board from the GUI
Relaunch your OpenBCI GUI
After installation of FTDI the drivers, there is need of launching the OpenBCI.
Select LIVE (from Cyton)
The data source should be selected to be live in order to connect to your cyton in the first
section of the system control panel. The configuration of Cytonic board is done before pressing
the Start System button [8].
Locate the USB Dongles Serial/ COM port
The COM port name or the Dongles serial is found in the LIVE section (from Cyton) sub-
panel. The USB Dongles port name will probably be at the top of the list and in case it is not
there then; make sure the dongle is plugged in and switched to the GPIO 6, Click the button for
refresh list in the serial section of the sub-panel and lastly, make sure that the installation of the
latest FTDI drivers have been done. If in case it is still not appearing, then there I possibility of
debugging the hardware’s connection.
Select your channels count (8 or 16)
Paraphrase This Document
Need a fresh take? Get an instant paraphrase of this document with our AI Paraphraser
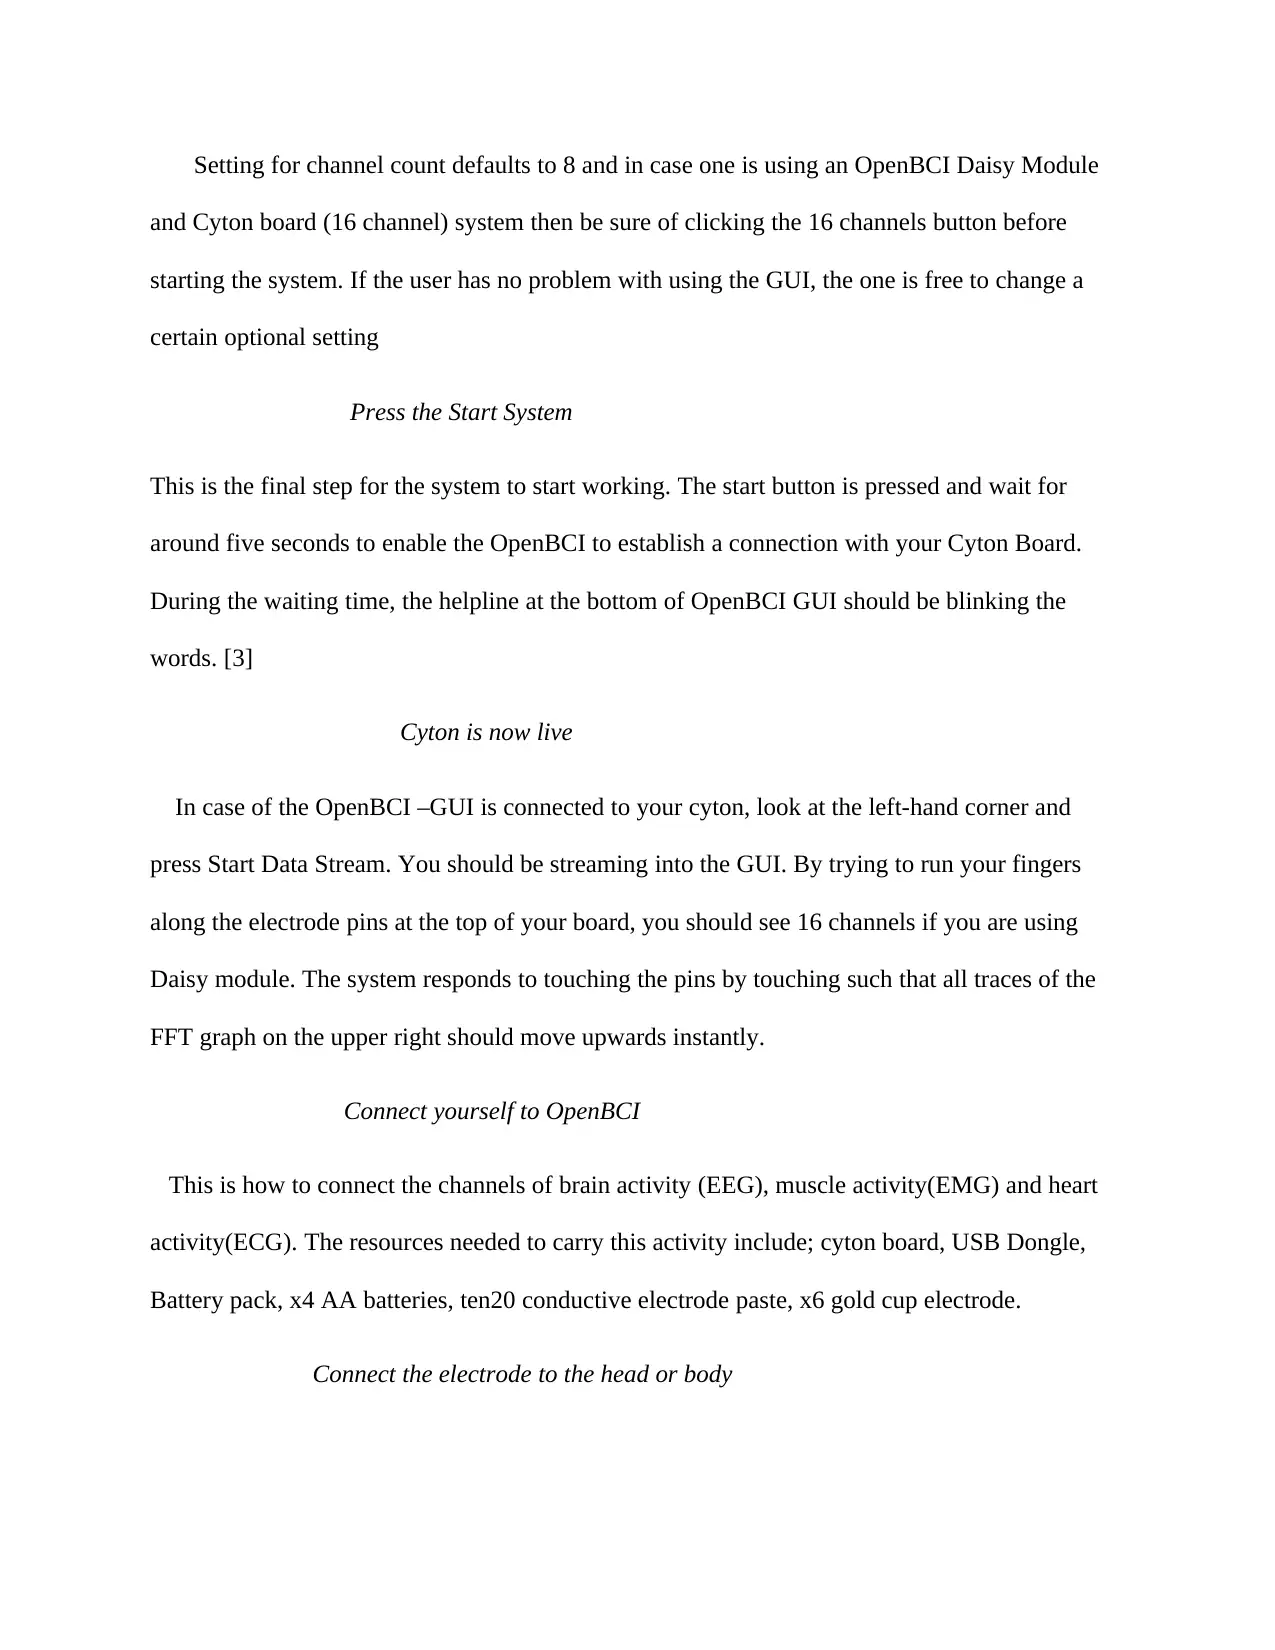
Setting for channel count defaults to 8 and in case one is using an OpenBCI Daisy Module
and Cyton board (16 channel) system then be sure of clicking the 16 channels button before
starting the system. If the user has no problem with using the GUI, the one is free to change a
certain optional setting
Press the Start System
This is the final step for the system to start working. The start button is pressed and wait for
around five seconds to enable the OpenBCI to establish a connection with your Cyton Board.
During the waiting time, the helpline at the bottom of OpenBCI GUI should be blinking the
words. [3]
Cyton is now live
In case of the OpenBCI –GUI is connected to your cyton, look at the left-hand corner and
press Start Data Stream. You should be streaming into the GUI. By trying to run your fingers
along the electrode pins at the top of your board, you should see 16 channels if you are using
Daisy module. The system responds to touching the pins by touching such that all traces of the
FFT graph on the upper right should move upwards instantly.
Connect yourself to OpenBCI
This is how to connect the channels of brain activity (EEG), muscle activity(EMG) and heart
activity(ECG). The resources needed to carry this activity include; cyton board, USB Dongle,
Battery pack, x4 AA batteries, ten20 conductive electrode paste, x6 gold cup electrode.
Connect the electrode to the head or body

The electrode can be applied to the earlobe and given support by a medical tape. All the EEG
electrode on the head will be measured in comparison to the Uv reading appearing in the GUI
EEG DATA montage. Note that the hair needs to be pulled aside so that the nesting of the
electrode is done deeply as possible in order to make a conductive connection between the gold
cup and the scalp.
electrode on the head will be measured in comparison to the Uv reading appearing in the GUI
EEG DATA montage. Note that the hair needs to be pulled aside so that the nesting of the
electrode is done deeply as possible in order to make a conductive connection between the gold
cup and the scalp.
⊘ This is a preview!⊘
Do you want full access?
Subscribe today to unlock all pages.
Trusted by 1+ million students worldwide
1 out of 14
Related Documents


Your All-in-One AI-Powered Toolkit for Academic Success.
+13062052269
info@desklib.com
Available 24*7 on WhatsApp / Email
![[object Object]](/_next/static/media/star-bottom.7253800d.svg)
Unlock your academic potential
Copyright © 2020–2026 A2Z Services. All Rights Reserved. Developed and managed by ZUCOL.