logo

Statistical Inference and Regression and Correlation Task

This project involves a statistical analysis of fuel price data from petrol stations in an Australian state.

12 Pages1540 Words189 Views
   

Added on  2023-04-26

About This Document

In this assignment we will discuss about statistical Inference and below are the summaries point:-

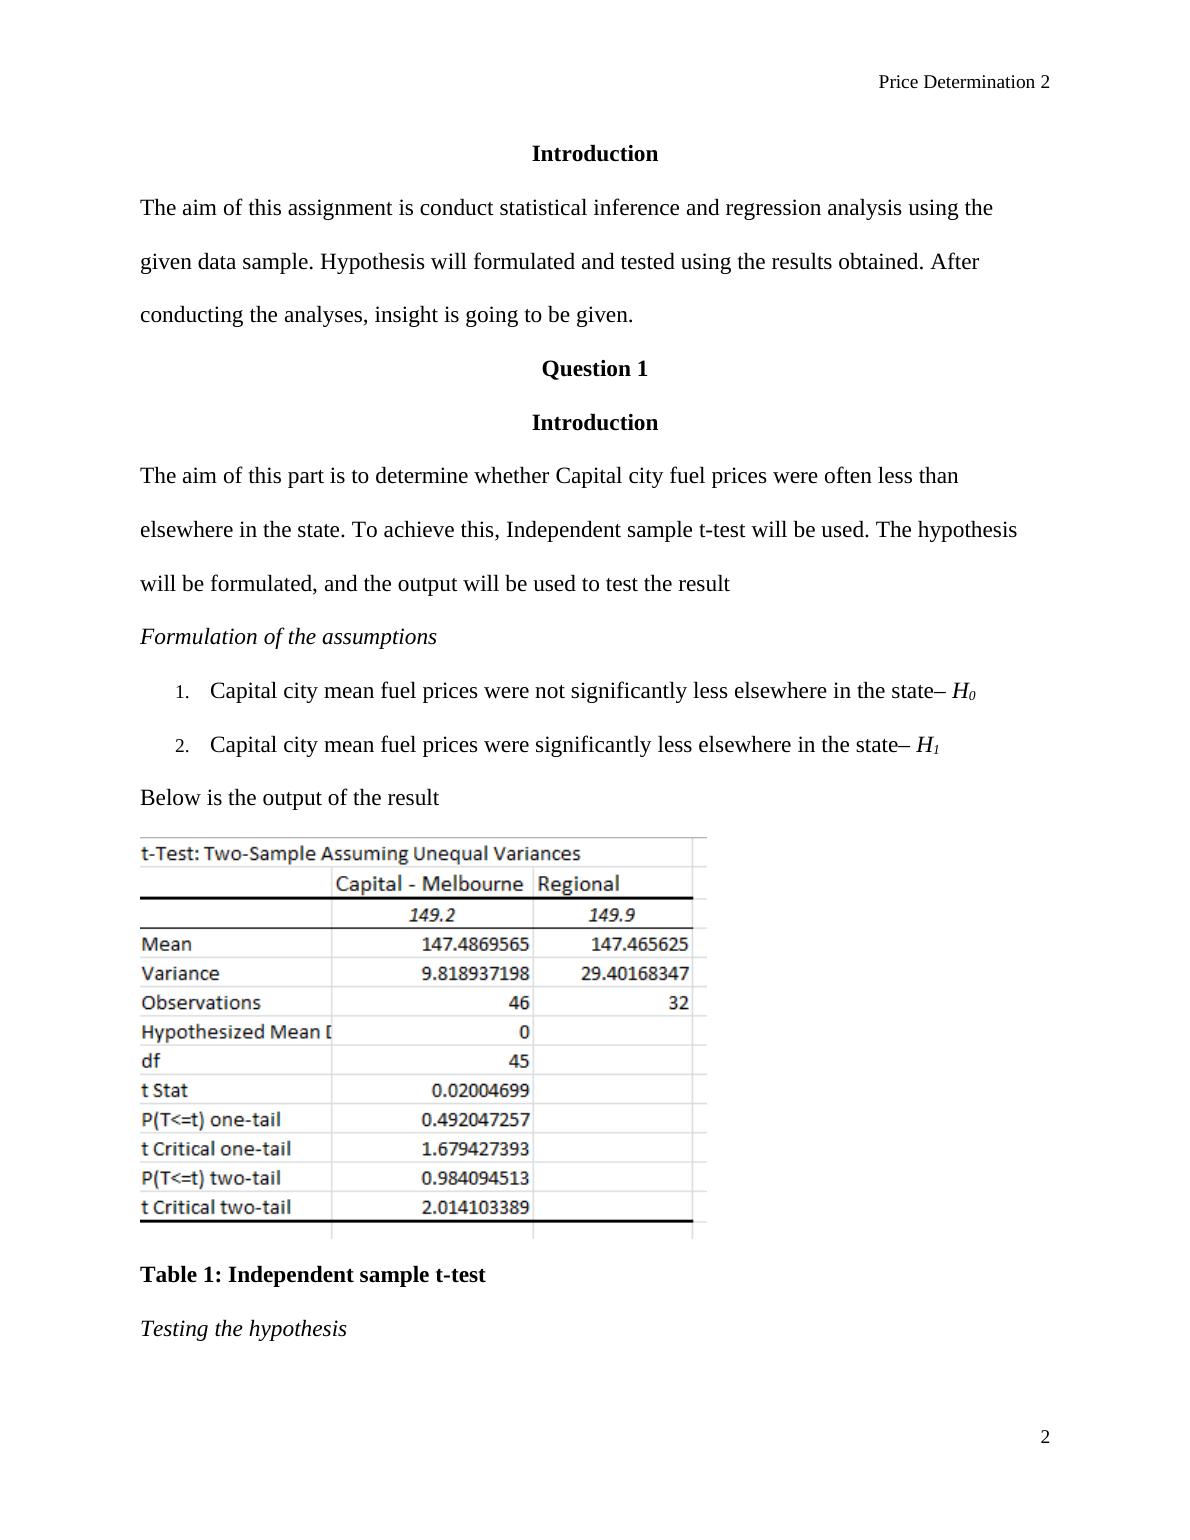
  • Aim: determine if Capital city fuel prices were often less than elsewhere in the state

  • Statistical test used: independent sample t-test

  • Hypotheses: H0 = Capital city mean fuel prices were not significantly less elsewhere in the state; H1 = Capital city mean fuel prices were significantly less elsewhere in the state

  • Result: Null hypothesis is accepted, meaning Capital city fuel prices were often not less than elsewhere in the state.

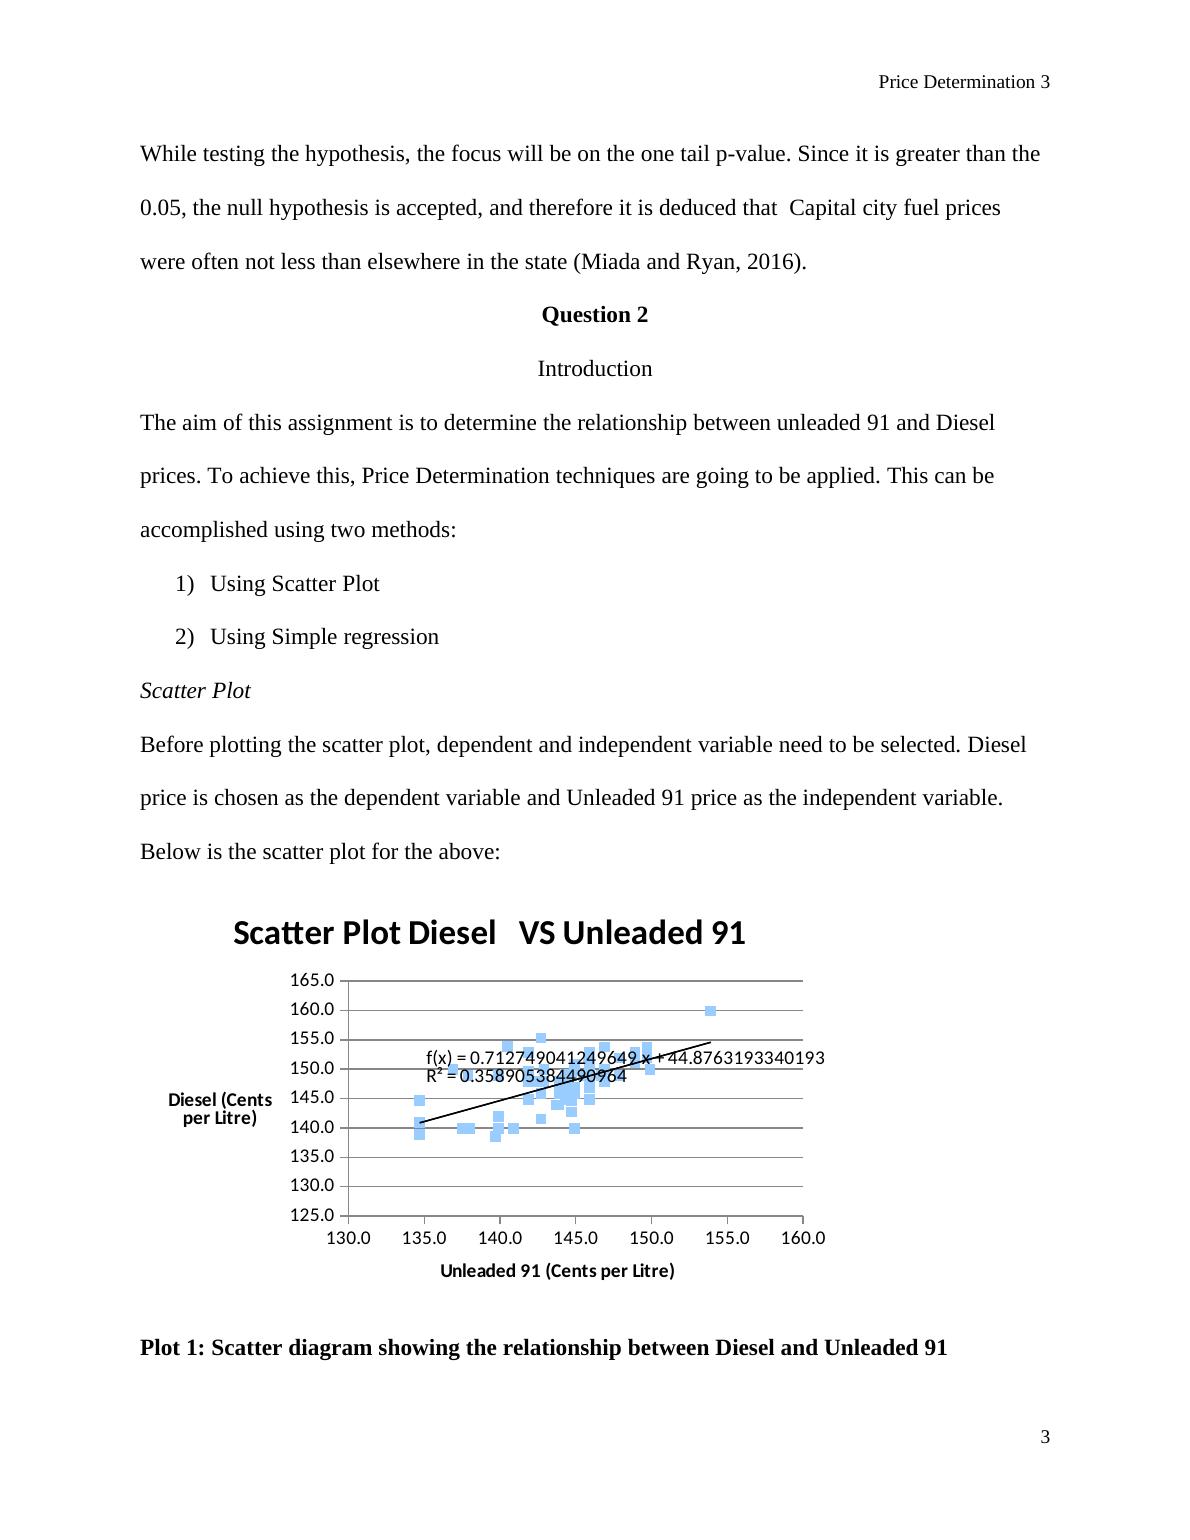
  • Aim: determine the relationship between unleaded 91 and diesel prices

  • Methods used: scatter plot and simple regression

  • Scatter plot used to visualize the relationship between variables

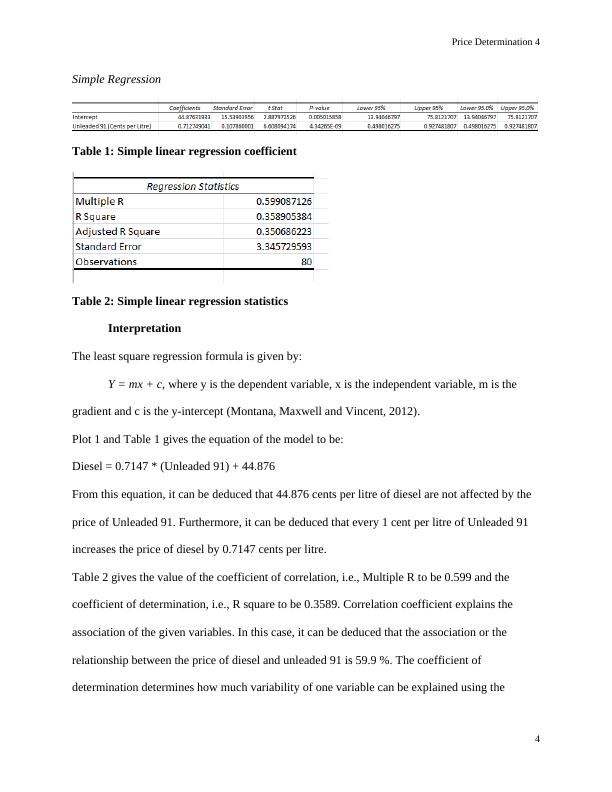
  • Simple regression used to find the least square regression equation, which is Diesel = 0.7147 * (Unleaded 91) + 44.876

  • Coefficient of correlation (Multiple R) = 0.599 and coefficient of determination (R square) = 0.3589, indicating a moderate positive relationship between the two variables and that 35.89% of the variability in diesel prices can be explained by the variability in unleaded 91 prices.


Statistical Inference and Regression and Correlation Task

This project involves a statistical analysis of fuel price data from petrol stations in an Australian state.

   Added on 2023-04-26

ShareRelated Documents
Price Determination 1
Statistical Inference and Regression and Correlation Tasks
Name
Institution
Course
1
Statistical Inference and Regression and Correlation Task_1
Price Determination 2
Introduction
The aim of this assignment is conduct statistical inference and regression analysis using the
given data sample. Hypothesis will formulated and tested using the results obtained. After
conducting the analyses, insight is going to be given.
Question 1
Introduction
The aim of this part is to determine whether Capital city fuel prices were often less than
elsewhere in the state. To achieve this, Independent sample t-test will be used. The hypothesis
will be formulated, and the output will be used to test the result
Formulation of the assumptions
1. Capital city mean fuel prices were not significantly less elsewhere in the state– H0
2. Capital city mean fuel prices were significantly less elsewhere in the state– H1
Below is the output of the result
Table 1: Independent sample t-test
Testing the hypothesis
2
Statistical Inference and Regression and Correlation Task_2
Price Determination 3
While testing the hypothesis, the focus will be on the one tail p-value. Since it is greater than the
0.05, the null hypothesis is accepted, and therefore it is deduced that Capital city fuel prices
were often not less than elsewhere in the state (Miada and Ryan, 2016).
Question 2
Introduction
The aim of this assignment is to determine the relationship between unleaded 91 and Diesel
prices. To achieve this, Price Determination techniques are going to be applied. This can be
accomplished using two methods:
1) Using Scatter Plot
2) Using Simple regression
Scatter Plot
Before plotting the scatter plot, dependent and independent variable need to be selected. Diesel
price is chosen as the dependent variable and Unleaded 91 price as the independent variable.
Below is the scatter plot for the above:
130.0 135.0 140.0 145.0 150.0 155.0 160.0
125.0
130.0
135.0
140.0
145.0
150.0
155.0
160.0
165.0
f(x) = 0.712749041249649 x + 44.8763193340193
R² = 0.358905384490964
Scatter Plot Diesel VS Unleaded 91
Unleaded 91 (Cents per Litre)
Diesel (Cents
per Litre)
Plot 1: Scatter diagram showing the relationship between Diesel and Unleaded 91
3
Statistical Inference and Regression and Correlation Task_3
Price Determination 4
Simple Regression
Table 1: Simple linear regression coefficient
Table 2: Simple linear regression statistics
Interpretation
The least square regression formula is given by:
Y = mx + c, where y is the dependent variable, x is the independent variable, m is the
gradient and c is the y-intercept (Montana, Maxwell and Vincent, 2012).
Plot 1 and Table 1 gives the equation of the model to be:
Diesel = 0.7147 * (Unleaded 91) + 44.876
From this equation, it can be deduced that 44.876 cents per litre of diesel are not affected by the
price of Unleaded 91. Furthermore, it can be deduced that every 1 cent per litre of Unleaded 91
increases the price of diesel by 0.7147 cents per litre.
Table 2 gives the value of the coefficient of correlation, i.e., Multiple R to be 0.599 and the
coefficient of determination, i.e., R square to be 0.3589. Correlation coefficient explains the
association of the given variables. In this case, it can be deduced that the association or the
relationship between the price of diesel and unleaded 91 is 59.9 %. The coefficient of
determination determines how much variability of one variable can be explained using the
4
Statistical Inference and Regression and Correlation Task_4

End of preview

Want to access all the pages? Upload your documents or become a member.

Related Documents
Fuel Price Comparison in Western Australia: Statistical Analysis Reveals Insights
|10
|1689
|107

Regression Analysis of Fuel Prices
|11
|1421
|439

Analysis of Fuel Prices and Relationships: Melbourne, Victoria
|7
|1280
|179

MAT10251 Statistical Analysis Data Analysis Project Part C
|15
|2521
|395

MAT10251- Sample Questions on Statistical Analysis
|5
|806
|268

MAT10251 Statistical Analysis Project Part C | Southern Cross University
|11
|1553
|213