Sample Statistics For Management Assignment
Added on 2021-01-02
21 Pages4438 Words218 Views
Statistics for Management
Table of Contents
INTRODUCTION...........................................................................................................................1
ACTIVITY 1....................................................................................................................................1
P1 & P2 Evaluation of business and economic data using different sources..............................1
..........................................................................................................................................................3
..........................................................................................................................................................4
ACTIVITY 2....................................................................................................................................6
P3 evaluation of qualitative and quantitative raw business data..................................................6
ACTIVITY 3....................................................................................................................................9
P4 Range of statistical method.....................................................................................................9
ACTIVITY 4..................................................................................................................................11
P5. Using of appropriate charts finding.....................................................................................11
CONCLUSION..............................................................................................................................16
REFERENCES..............................................................................................................................17
INTRODUCTION
Business statistics is process for analysing situation and making good decisions in order
to face and overcome from future uncertainties. The statistics are collected for the pre
determined purpose. This is a process of collecting data, presentation of data, analysis of data
and interpretation of data. With the help of statistical data organisation used to forecast the data.
As it is a tool which is used by business to make quantitative decisions in company. The present
report discuss about the evaluation of business and economic data. The raw business data using
number of statistical methods is being explained in this report. As there are various statistical
method in business planning which is being discussed in this report. The appropriate chart has
been prepared to communicate findings.
ACTIVITY 1
P1 & P2 Evaluation of business and economic data using different sources
Data is facts and figures which is helpful in reaching on a proper conclusion. This is a
collection of facts or information and assist in make effective decision in company. There are
two types of data, first is qualitative data and second is quantitative data. The qualitative data
talks about characteristics, style of person etc. This can be collected by observation, interview
and interactions. Quantitative data is a type of data which deals with measurable information.
The quantitative data is used in data analysis for evaluation purposes as it provides the
quantifiable and easy to understand results (Wheeler, Shaw and Barr, 2013).
A&B. CPI, CPIH and RPI using office of national statistics website and appropriate tables
and graph.
CPI and CPIH:
Consumer price index is a measure or technique which examines the weighted average
price of different types of consumer goods and services such as transportation, food and medical
care etc. This is calculated by taking price changes for every item in preset basket of goods and
averaging them. Consumer price index is one of most frequently used statistics for determining
time period of inflation and deflation. This is very useful tool which is used by government,
business houses and people to get an idea about price change is economy and than according to
that take decisions. The CPIH is Consumer Price Index Housing cost, is new addition to CPI in
which housing cost of owner occupiers is measured. The CPIH includes owner occupiers'
1
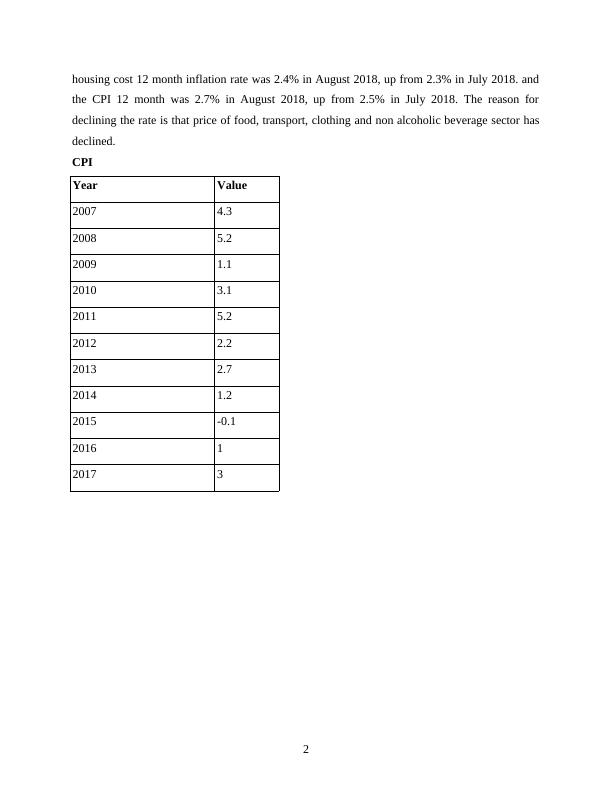
housing cost 12 month inflation rate was 2.4% in August 2018, up from 2.3% in July 2018. and
the CPI 12 month was 2.7% in August 2018, up from 2.5% in July 2018. The reason for
declining the rate is that price of food, transport, clothing and non alcoholic beverage sector has
declined.
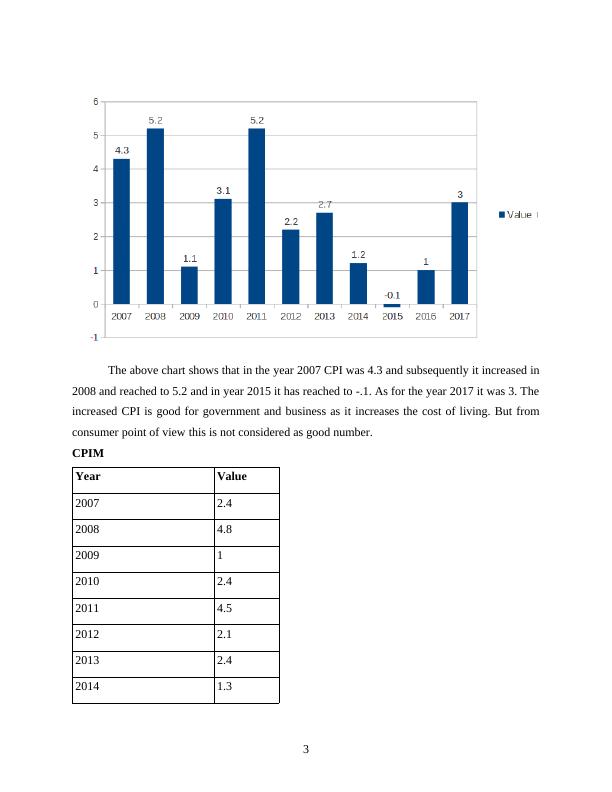
CPI
Year Value
2007 4.3
2008 5.2
2009 1.1
2010 3.1
2011 5.2
2012 2.2
2013 2.7
2014 1.2
2015 -0.1
2016 1
2017 3
2
the CPI 12 month was 2.7% in August 2018, up from 2.5% in July 2018. The reason for
declining the rate is that price of food, transport, clothing and non alcoholic beverage sector has
declined.
CPI
Year Value
2007 4.3
2008 5.2
2009 1.1
2010 3.1
2011 5.2
2012 2.2
2013 2.7
2014 1.2
2015 -0.1
2016 1
2017 3
2
The above chart shows that in the year 2007 CPI was 4.3 and subsequently it increased in
2008 and reached to 5.2 and in year 2015 it has reached to -.1. As for the year 2017 it was 3. The
increased CPI is good for government and business as it increases the cost of living. But from
consumer point of view this is not considered as good number.
CPIM
Year Value
2007 2.4
2008 4.8
2009 1
2010 2.4
2011 4.5
2012 2.1
2013 2.4
2014 1.3
3
2015 0.2
2016 1.3
2017 2.8
4
2016 1.3
2017 2.8
4

End of preview
Want to access all the pages? Upload your documents or become a member.
Related Documents
Statistical Management Assignmentlg...
|22
|5015
|472
(Solution) Statistics for Management : PDFlg...
|22
|3705
|474
Statistics for Management Assignment Solved - (Doc)lg...
|20
|3601
|398
Statistics for Management Assignment Solutionlg...
|16
|3449
|157
Statistics for Management: Nature, Process, and Evaluation of Datalg...
|21
|3384
|97
(PDF) Statistics for management | Assignment Samplelg...
|15
|2703
|98