Statistical Management Assignment
22 Pages5015 Words472 Views
Added on 2020-10-22
Statistical Management Assignment
Added on 2020-10-22
ShareRelated Documents
Statistical Management
Table of Contents
INTRODUCTION...........................................................................................................................1
ACTIVITY 1....................................................................................................................................1
P1 Evaluation of business and economic data........................................................................1
P2 Data from variety of sources using various methods of analysis......................................4
M1 Analysis of price indices other than Office of National Statistics...................................6
D1 Differentiation between the exploratory, confirmatory and descriptive analysis with
examples.................................................................................................................................6
ACTIVITY 2....................................................................................................................................7
P3 Evaluation of raw business data using a number of statistical methods...........................7
M2 Assessment of different statistical application...............................................................11
ACTIVITY 3..................................................................................................................................12
P4 Application of statistical methods in business planning.................................................12
M3 Justification and use of statistical methods....................................................................13
D2 Explanation and recommendation for activity 3.............................................................13
ACTIVITY 4..................................................................................................................................14
P5 Using of appropriate charts finding communicate..........................................................14
M4 Graphical representation assessed in activity one and second.......................................18
D3 Use of tables and graphical representations in activity 1 and 2......................................18
CONLUSION................................................................................................................................18
REFERENCES..............................................................................................................................20
INTRODUCTION
Statistical management is the process of formulating right decisions so that uncertainties
can be faced appropriately in future. It is used in financial analysis, auditing, production,
econometrics and operations that are performed to modify services and market research. The
procedure of statistical management involves collection and scrutinisation of business data.
Managers of the organisations need to collect quantitative history of occurrence elements on
optimal repairs and procedures. It helps to forecast the use of material in every sector of the
business so that the shortage can be ignored. It is very important for a business entity as it can
help to ensure quality, make connections and for provide effective judgements.
This report covers various topics such as evaluation of business, economic data, raw
business data by using a number of statistical methods, application of statistical methods in
business planning, communication of findings by using appropriate charts and tables.
ACTIVITY 1
P1 Evaluation of business and economic data
Nature of data and information can help to manipulate them by different techniques of
statistical analysis. There are two different types of data these are qualitative and quantitative.
First one is qualitative that includes characteristics and the another type contain the data in
numeric format. Data can be turned into information and information in to knowledge (Carlson
and Wu, 2012). Data is unprocessed facts and figures that are recorded without interpretation
when the recorded data get interpreted than it will become information. Knowledge is the
combination of different type of information.
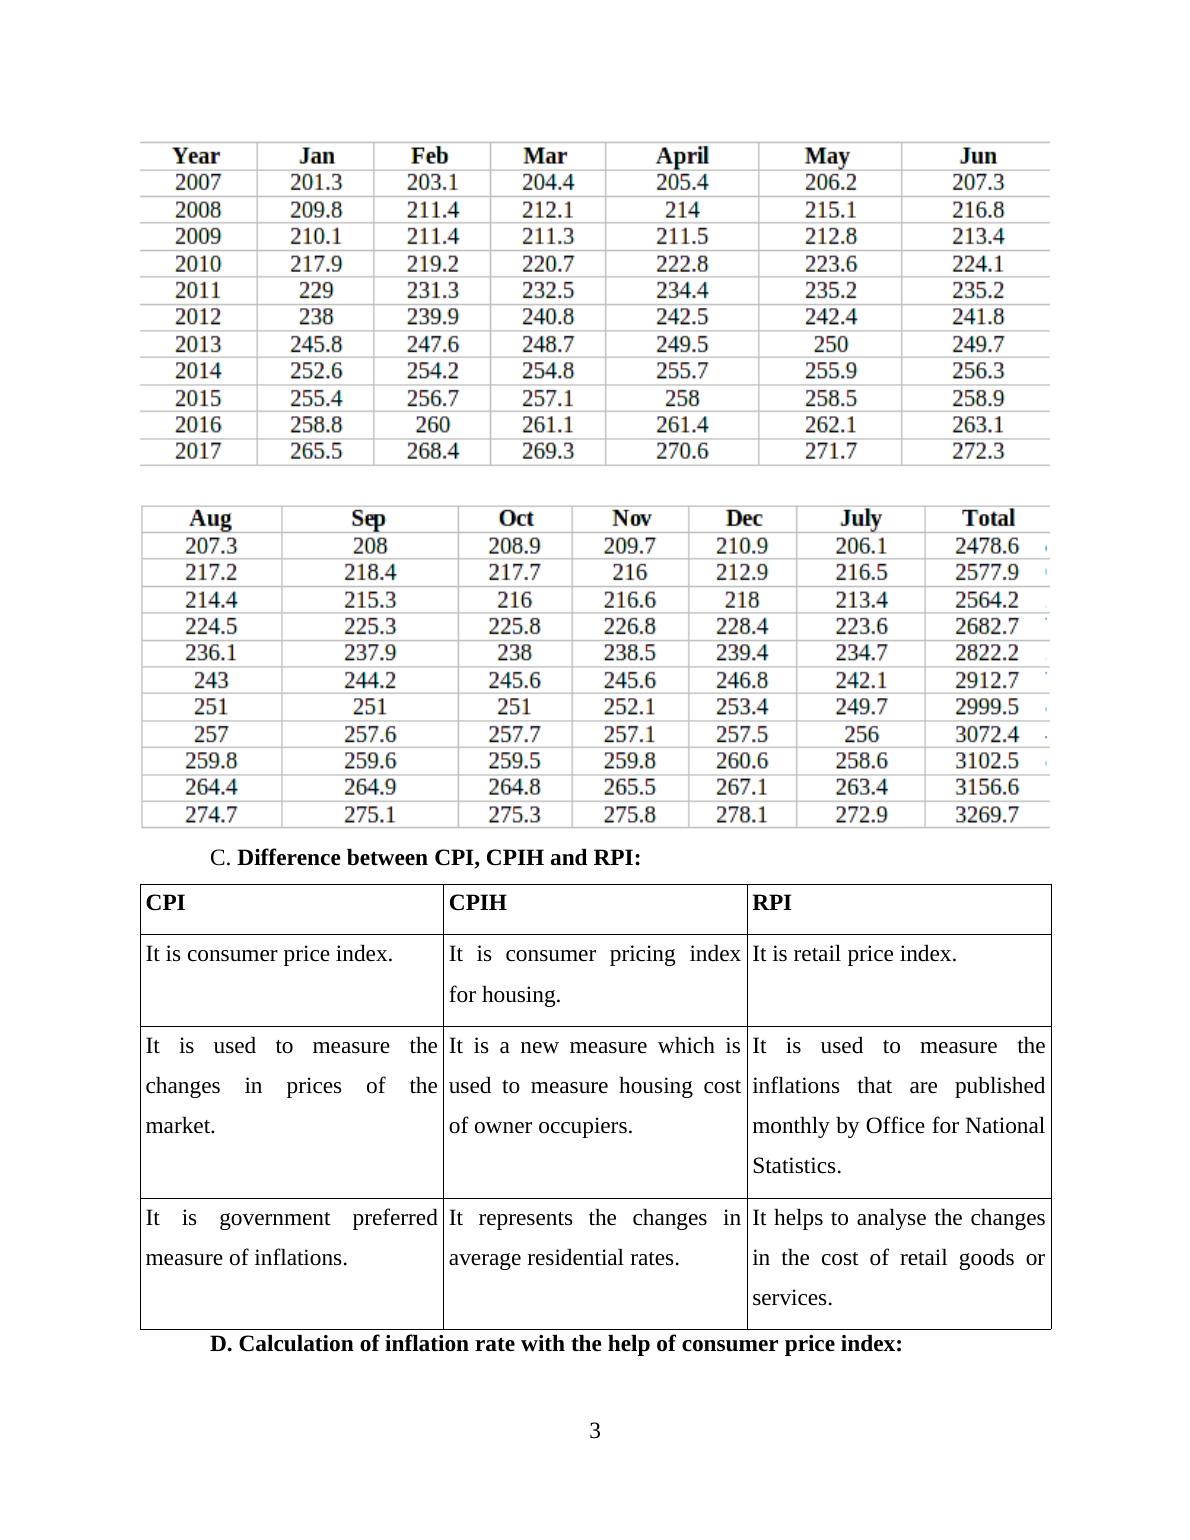
A. & B. CPI, CPIH and RPI by using office of national statistics website and
appropriate tables and graphs for all of them:
CPI and CPIH: Consumer price index is used to measure the changes ion the price level
of the market and CPIH is a new addition in the CPI in which housing cost of owner
occupiers is measured. CPIH rate was 2.2% in September 2018 which has been decreased
as compare to 2.4% which is for August 2018 (Chen and et. al., 2012). consumer price
index rate was 2.4% in September 2018 which has been decreased as compare to August
which is 2.7%. the rate has been decreased because prices of food, non alcoholic
1
Statistical management is the process of formulating right decisions so that uncertainties
can be faced appropriately in future. It is used in financial analysis, auditing, production,
econometrics and operations that are performed to modify services and market research. The
procedure of statistical management involves collection and scrutinisation of business data.
Managers of the organisations need to collect quantitative history of occurrence elements on
optimal repairs and procedures. It helps to forecast the use of material in every sector of the
business so that the shortage can be ignored. It is very important for a business entity as it can
help to ensure quality, make connections and for provide effective judgements.
This report covers various topics such as evaluation of business, economic data, raw
business data by using a number of statistical methods, application of statistical methods in
business planning, communication of findings by using appropriate charts and tables.
ACTIVITY 1
P1 Evaluation of business and economic data
Nature of data and information can help to manipulate them by different techniques of
statistical analysis. There are two different types of data these are qualitative and quantitative.
First one is qualitative that includes characteristics and the another type contain the data in
numeric format. Data can be turned into information and information in to knowledge (Carlson
and Wu, 2012). Data is unprocessed facts and figures that are recorded without interpretation
when the recorded data get interpreted than it will become information. Knowledge is the
combination of different type of information.
A. & B. CPI, CPIH and RPI by using office of national statistics website and
appropriate tables and graphs for all of them:
CPI and CPIH: Consumer price index is used to measure the changes ion the price level
of the market and CPIH is a new addition in the CPI in which housing cost of owner
occupiers is measured. CPIH rate was 2.2% in September 2018 which has been decreased
as compare to 2.4% which is for August 2018 (Chen and et. al., 2012). consumer price
index rate was 2.4% in September 2018 which has been decreased as compare to August
which is 2.7%. the rate has been decreased because prices of food, non alcoholic
1
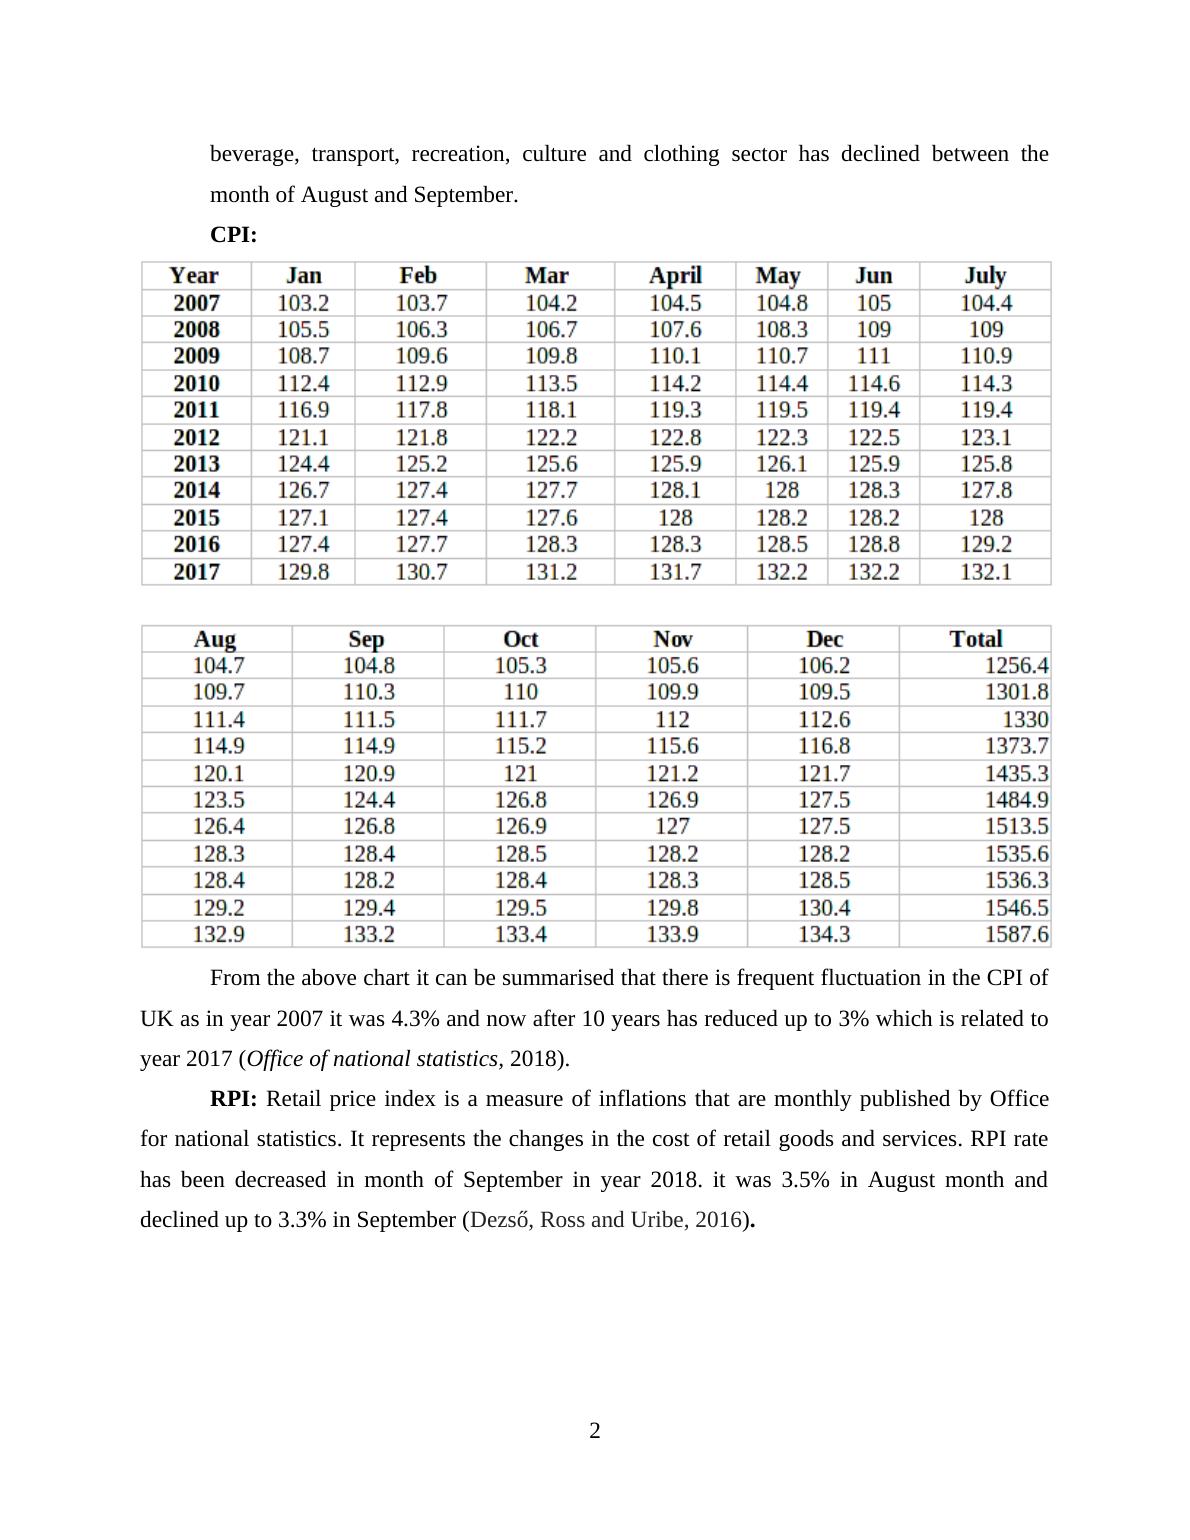
beverage, transport, recreation, culture and clothing sector has declined between the
month of August and September.
CPI:
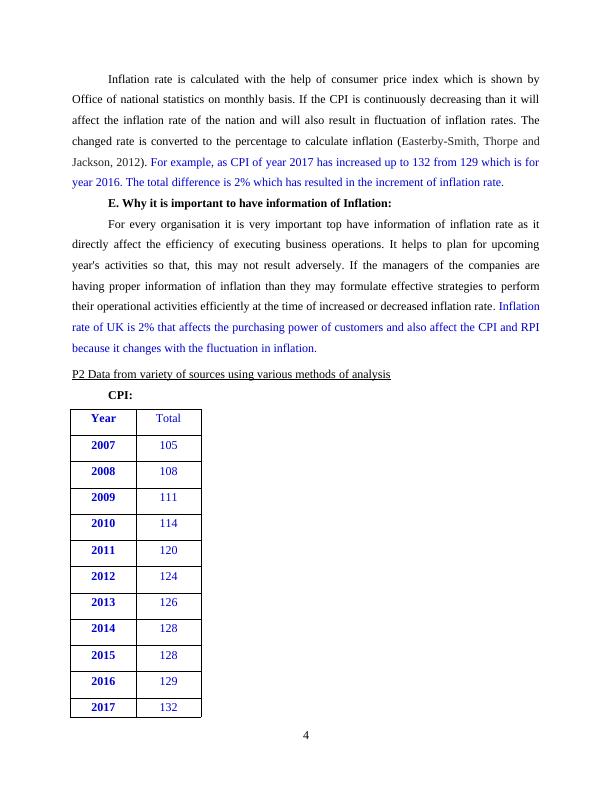
From the above chart it can be summarised that there is frequent fluctuation in the CPI of
UK as in year 2007 it was 4.3% and now after 10 years has reduced up to 3% which is related to
year 2017 (Office of national statistics, 2018).
RPI: Retail price index is a measure of inflations that are monthly published by Office
for national statistics. It represents the changes in the cost of retail goods and services. RPI rate
has been decreased in month of September in year 2018. it was 3.5% in August month and
declined up to 3.3% in September (Dezső, Ross and Uribe, 2016).
2
month of August and September.
CPI:
From the above chart it can be summarised that there is frequent fluctuation in the CPI of
UK as in year 2007 it was 4.3% and now after 10 years has reduced up to 3% which is related to
year 2017 (Office of national statistics, 2018).
RPI: Retail price index is a measure of inflations that are monthly published by Office
for national statistics. It represents the changes in the cost of retail goods and services. RPI rate
has been decreased in month of September in year 2018. it was 3.5% in August month and
declined up to 3.3% in September (Dezső, Ross and Uribe, 2016).
2
C. Difference between CPI, CPIH and RPI:
CPI CPIH RPI
It is consumer price index. It is consumer pricing index
for housing.
It is retail price index.
It is used to measure the
changes in prices of the
market.
It is a new measure which is
used to measure housing cost
of owner occupiers.
It is used to measure the
inflations that are published
monthly by Office for National
Statistics.
It is government preferred
measure of inflations.
It represents the changes in
average residential rates.
It helps to analyse the changes
in the cost of retail goods or
services.
D. Calculation of inflation rate with the help of consumer price index:
3
Inflation rate is calculated with the help of consumer price index which is shown by
Office of national statistics on monthly basis. If the CPI is continuously decreasing than it will
affect the inflation rate of the nation and will also result in fluctuation of inflation rates. The
changed rate is converted to the percentage to calculate inflation (Easterby-Smith, Thorpe and
Jackson, 2012). For example, as CPI of year 2017 has increased up to 132 from 129 which is for
year 2016. The total difference is 2% which has resulted in the increment of inflation rate.
E. Why it is important to have information of Inflation:
For every organisation it is very important top have information of inflation rate as it
directly affect the efficiency of executing business operations. It helps to plan for upcoming
year's activities so that, this may not result adversely. If the managers of the companies are
having proper information of inflation than they may formulate effective strategies to perform
their operational activities efficiently at the time of increased or decreased inflation rate. Inflation
rate of UK is 2% that affects the purchasing power of customers and also affect the CPI and RPI
because it changes with the fluctuation in inflation.
P2 Data from variety of sources using various methods of analysis
CPI:
Year Total
2007 105
2008 108
2009 111
2010 114
2011 120
2012 124
2013 126
2014 128
2015 128
2016 129
2017 132
4
End of preview
Want to access all the pages? Upload your documents or become a member.
Related Documents
Sample Statistics For Management Assignmentlg...
|21
|4438
|218
Statistics for Management Assignment Solved - (Doc)lg...
|20
|3601
|398
(PDF) Statistics for Management and Economiclg...
|20
|4422
|52
(Doc) Statistics for Management Assignmentlg...
|23
|4220
|39
Statistics for MANAGEMENT INTROUCTIONlg...
|19
|3852
|233
Statistical Statistics for Management Inflationlg...
|24
|3596
|221