logo

Smartphone Usage Among College Students

This assignment involves conducting statistical analysis on a selected topic using available population statistics, collecting data on a sample, conducting a hypothesis test, and comparing the sample to the population to determine similarity or difference.

11 Pages2245 Words357 Views
   

Added on  2023-04-25

About This Document

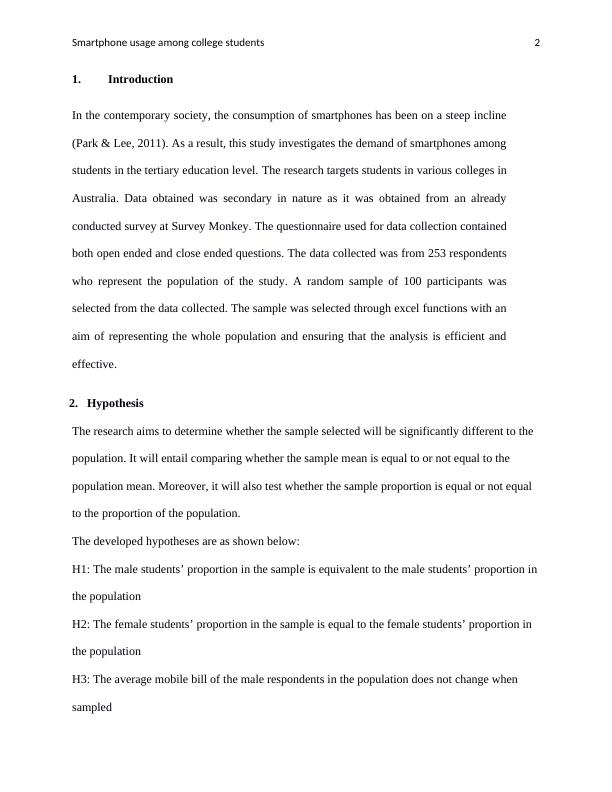
This study investigates the demand of smartphones among students in the tertiary education level. The research targets students in various colleges in Australia. Data obtained was secondary in nature as it was obtained from an already conducted survey at Survey Monkey.

Smartphone Usage Among College Students

This assignment involves conducting statistical analysis on a selected topic using available population statistics, collecting data on a sample, conducting a hypothesis test, and comparing the sample to the population to determine similarity or difference.

   Added on 2023-04-25

ShareRelated Documents
RUNNING HEADER: SMARTPHONE USAGE AMONG COLLEGE STUDENTS 1
Smartphone usage among college students
Student’s name:
Student’s ID:
Institution:
Course ID:
Smartphone Usage Among College Students_1
Smartphone usage among college students 2
1. Introduction
In the contemporary society, the consumption of smartphones has been on a steep incline
(Park & Lee, 2011). As a result, this study investigates the demand of smartphones among
students in the tertiary education level. The research targets students in various colleges in
Australia. Data obtained was secondary in nature as it was obtained from an already
conducted survey at Survey Monkey. The questionnaire used for data collection contained
both open ended and close ended questions. The data collected was from 253 respondents
who represent the population of the study. A random sample of 100 participants was
selected from the data collected. The sample was selected through excel functions with an
aim of representing the whole population and ensuring that the analysis is efficient and
effective.
2. Hypothesis
The research aims to determine whether the sample selected will be significantly different to the
population. It will entail comparing whether the sample mean is equal to or not equal to the
population mean. Moreover, it will also test whether the sample proportion is equal or not equal
to the proportion of the population.
The developed hypotheses are as shown below:
H1: The male students’ proportion in the sample is equivalent to the male students’ proportion in
the population
H2: The female students’ proportion in the sample is equal to the female students’ proportion in
the population
H3: The average mobile bill of the male respondents in the population does not change when
sampled
Smartphone Usage Among College Students_2
Smartphone usage among college students 3
H4: The average mobile bill of the female respondents in the population does not change when
sampled
3. Basic Analysis
i. Proportions of male and female
The proportion of male and female who participated in the survey are as shown in table 1 below:
Table 1: Population gender proportions
Gender Count Proportion
Female 121 48%
Male 132 52%
Grand
Total 253 100%
From table 1, it is evident that most of the respondent who participated in the survey were the
males with a representation of 52%. On the other hand, the female gender had a representation of
48%.
From the sample, the proportion of male and female are as shown below:
Table 2: Sample gender proportions
Gender Count Proportion
Female 50 50%
Male 50 50%
Grand
Total 100 100%
From table 2 above, the sample had equal proportions of both genders. The male respondents
were represented by 50% while the females were represented by 50%.
ii. Average monthly earnings and bills
The average monthly earning and bills from the population are as shown in the subsequent table.
Smartphone Usage Among College Students_3
Smartphone usage among college students 4
Table 3: Population average earnings and bills
Gender Earnings Total Bills Total Average Earnings Average Bills
Female 143,431.60 8,863.00 1,185.39 73.25
Male 166,668.40 8,708.59 1,262.64 65.97
Grand
Total 310,100.00 17,571.59 1,225.69 69.45
It is apparent that the male respondents had the highest earnings compared to the female
respondents with a total of $166,668.40 compared to $143,431.60. Conversely, this was the same
for the average earnings where the male respondents had the highest average earnings
($1,262.64) compared to the female respondents ($1,185.39).
On the other hand, the female respondents had the highest amount of bills totalling to $8,868.00
compared to the male respondents who had a total of $8,708.59. Similarly, the female
respondents had the highest average bills of $73.25 compared to the male respondents with
$65.97.
Table 4: Sample average earnings and bills
Gender Earning Total Bills Total Average Earnings Average Bills
Female 66,098.60 3,584.00 1,321.97 71.68
Male 60,991.60 3,199.59 1,219.83 63.99
Grand
Total 127,090.20 6,783.59 1,270.90 67.84
On the other hand, the sample female respondents had the highest earnings ($66,098) compared
to the male respondents who had a total earning of $60,991.60. Similarly, a similar observation
can be made for the average earnings where the female respondents in the sample had the highest
average earnings ($1,321.97) compared to the male respondents ($1,219.83) in the sample.
Smartphone Usage Among College Students_4

End of preview

Want to access all the pages? Upload your documents or become a member.

Related Documents
BUS1BAN, Business Analytics Assignment
|19
|1711
|97

BUS1BAN Business Analytics
|16
|2389
|167

BUS1BAN Business Analytics Report
|12
|1539
|287

Business Statistics: Summary, Hypothesis Testing, and Conclusion
|18
|3808
|269

Using Statistics to Analyze Gender Preference for Unisex Gym and Time Spent on Cardio Machines
|20
|7982
|68

Mobile Phone Choice and Factors Influencing It: A Study on La Trobe University Students
|18
|1219
|112