Gender Difference and Attitude towards Group Work
VerifiedAdded on 2023/04/20
|13
|2209
|322
AI Summary
This assignment explores the gender difference and attitude towards group work. It includes data analysis and statistics on the attitudes of male and female students towards group work.
Contribute Materials
Your contribution can guide someone’s learning journey. Share your
documents today.
Running head: Social Psychology 1
Name of Student
Course Title
Institution Affiliation
Name of Student
Course Title
Institution Affiliation
Secure Best Marks with AI Grader
Need help grading? Try our AI Grader for instant feedback on your assignments.
Social Psychology 2
Table of Content
Introduction………………………………………………………………………1
Descriptive Analysis………………………………………………………………2
Conclusion…………………………………………………………………………5
Table of Content
Introduction………………………………………………………………………1
Descriptive Analysis………………………………………………………………2
Conclusion…………………………………………………………………………5
Social Psychology 3
Introduction
Working as a group is a technique that is widely used in teaching especially among the
students who are in higher education. Most institutions find themselves using this method during
their class sessions and many more. Even though teachers use this technique, some of the
students don't prefer this technique. In fact, they understand more when they study individually.
Nevertheless, we can't ignore this technique because many students understand the class units
easily when they share ideas during group discussion. Some of the students barely understand
anything during the class session and they really depend on group work to at least grasp some
ideas from different units being taught in classes (Azad & Kalam, 2013). To get more
information about this topic, research was conducted in order to achieve whatever is being
required. An experiment was conducted within the environment of James Cook University, a
campus in Singapore. 34 students showed up for the experiment since the experiment was
voluntary.
The aim of the assignment is to determine the gender difference and attitude towards
group work. To achieve the desired results, a questionnaire (Likert scale questionnaire) was
designed to help come up with data for the analysis. The questionnaire contained 3 parts that
needed to be filled by the participants. A total of 34 respondents were involved in the data
collection. The questionnaire had questions that had different scores according to the type of
questions and the aim of the question. After the data collection, data entry was done using SPSS
(Statistical Package for the Social Science) software. After the data entry, the data was edited
into the software and the analysis was later carried out.
Social Psychology 4
The Analysis
The data analysis was conducted to give information on the data collected. The measure
of central tendency (mean, mode and median) and measure of dispersion (variance, standard
deviation, and interquartile range), Skewness and Kurtosis results for each gender were also
obtained as shown below.
i) Female
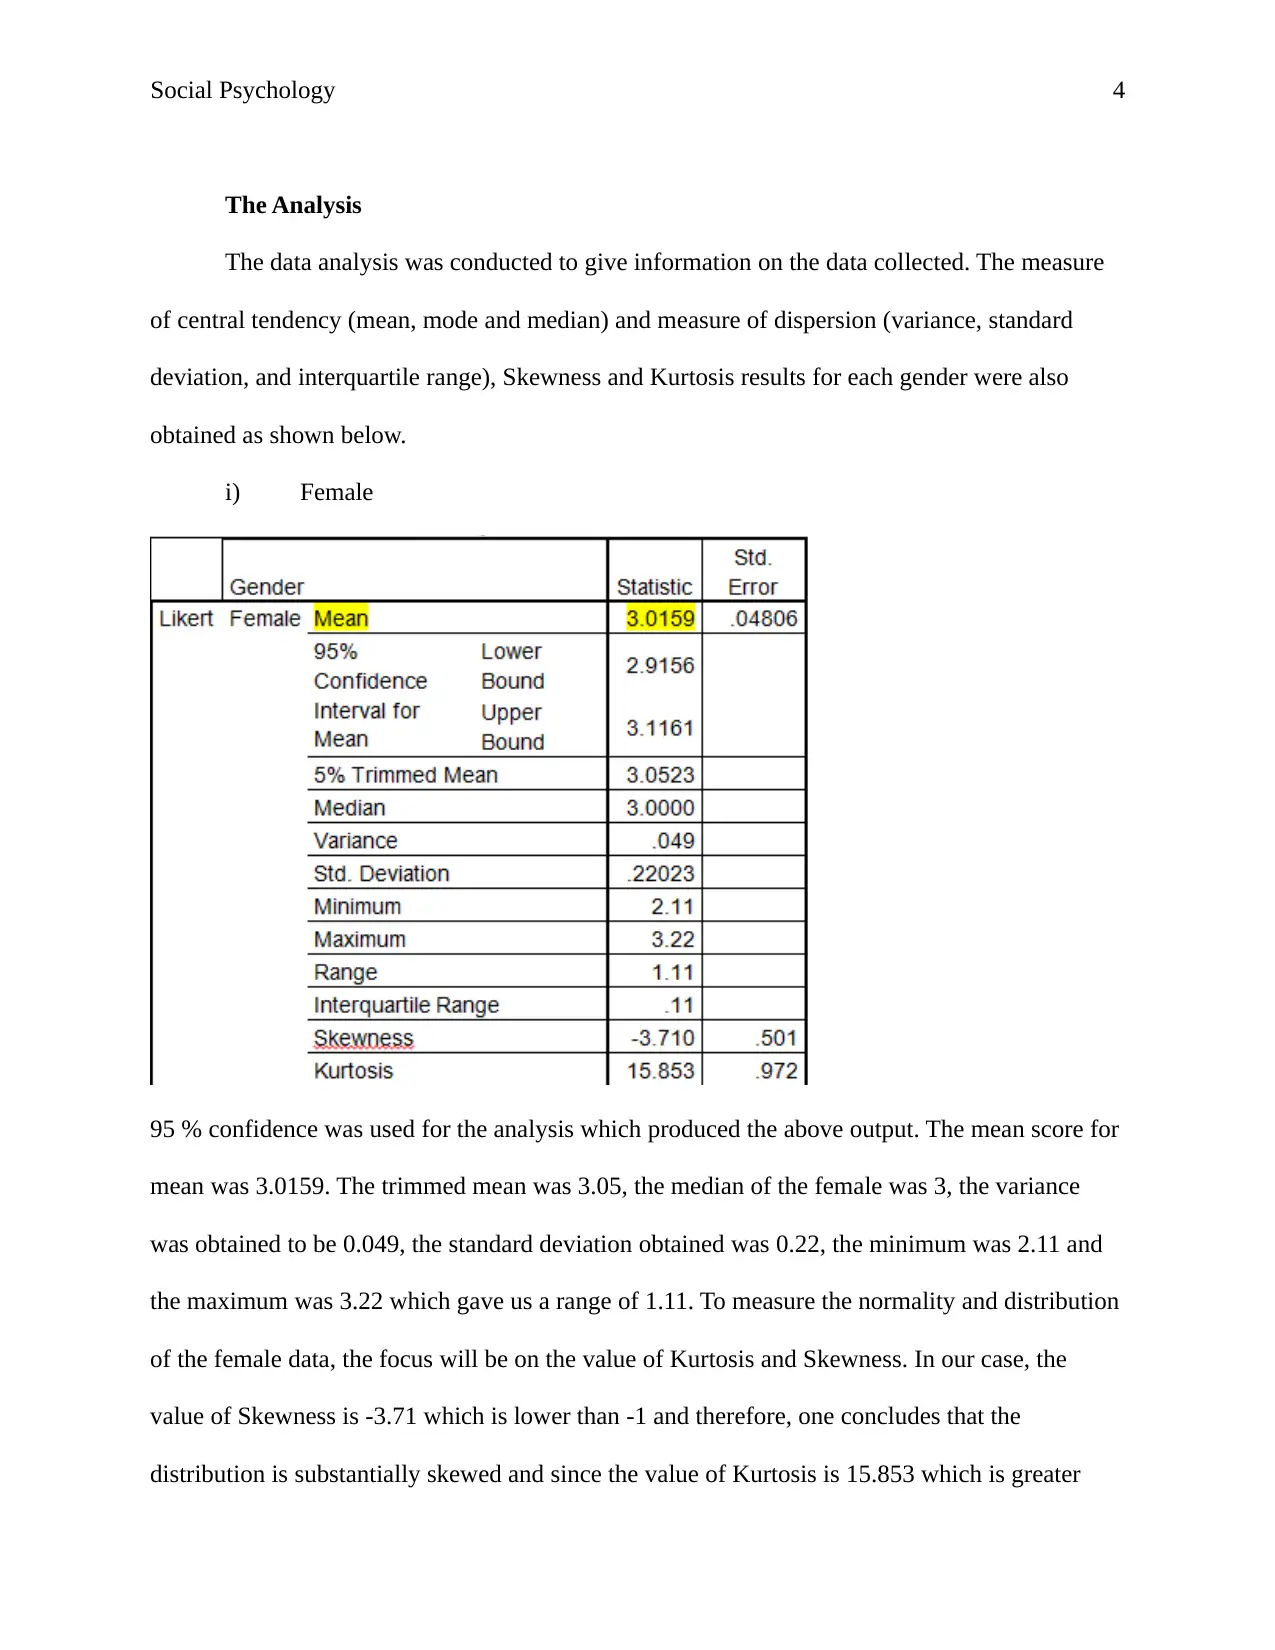
95 % confidence was used for the analysis which produced the above output. The mean score for
mean was 3.0159. The trimmed mean was 3.05, the median of the female was 3, the variance
was obtained to be 0.049, the standard deviation obtained was 0.22, the minimum was 2.11 and
the maximum was 3.22 which gave us a range of 1.11. To measure the normality and distribution
of the female data, the focus will be on the value of Kurtosis and Skewness. In our case, the
value of Skewness is -3.71 which is lower than -1 and therefore, one concludes that the
distribution is substantially skewed and since the value of Kurtosis is 15.853 which is greater
The Analysis
The data analysis was conducted to give information on the data collected. The measure
of central tendency (mean, mode and median) and measure of dispersion (variance, standard
deviation, and interquartile range), Skewness and Kurtosis results for each gender were also
obtained as shown below.
i) Female
95 % confidence was used for the analysis which produced the above output. The mean score for
mean was 3.0159. The trimmed mean was 3.05, the median of the female was 3, the variance
was obtained to be 0.049, the standard deviation obtained was 0.22, the minimum was 2.11 and
the maximum was 3.22 which gave us a range of 1.11. To measure the normality and distribution
of the female data, the focus will be on the value of Kurtosis and Skewness. In our case, the
value of Skewness is -3.71 which is lower than -1 and therefore, one concludes that the
distribution is substantially skewed and since the value of Kurtosis is 15.853 which is greater
Secure Best Marks with AI Grader
Need help grading? Try our AI Grader for instant feedback on your assignments.
Social Psychology 5
than 1, one concludes that the distribution is too flat. Generally, from both the values of Kurtosis
and Skewness, we conclude that the distribution is non-normal (Tong, 2012).
ii) Male
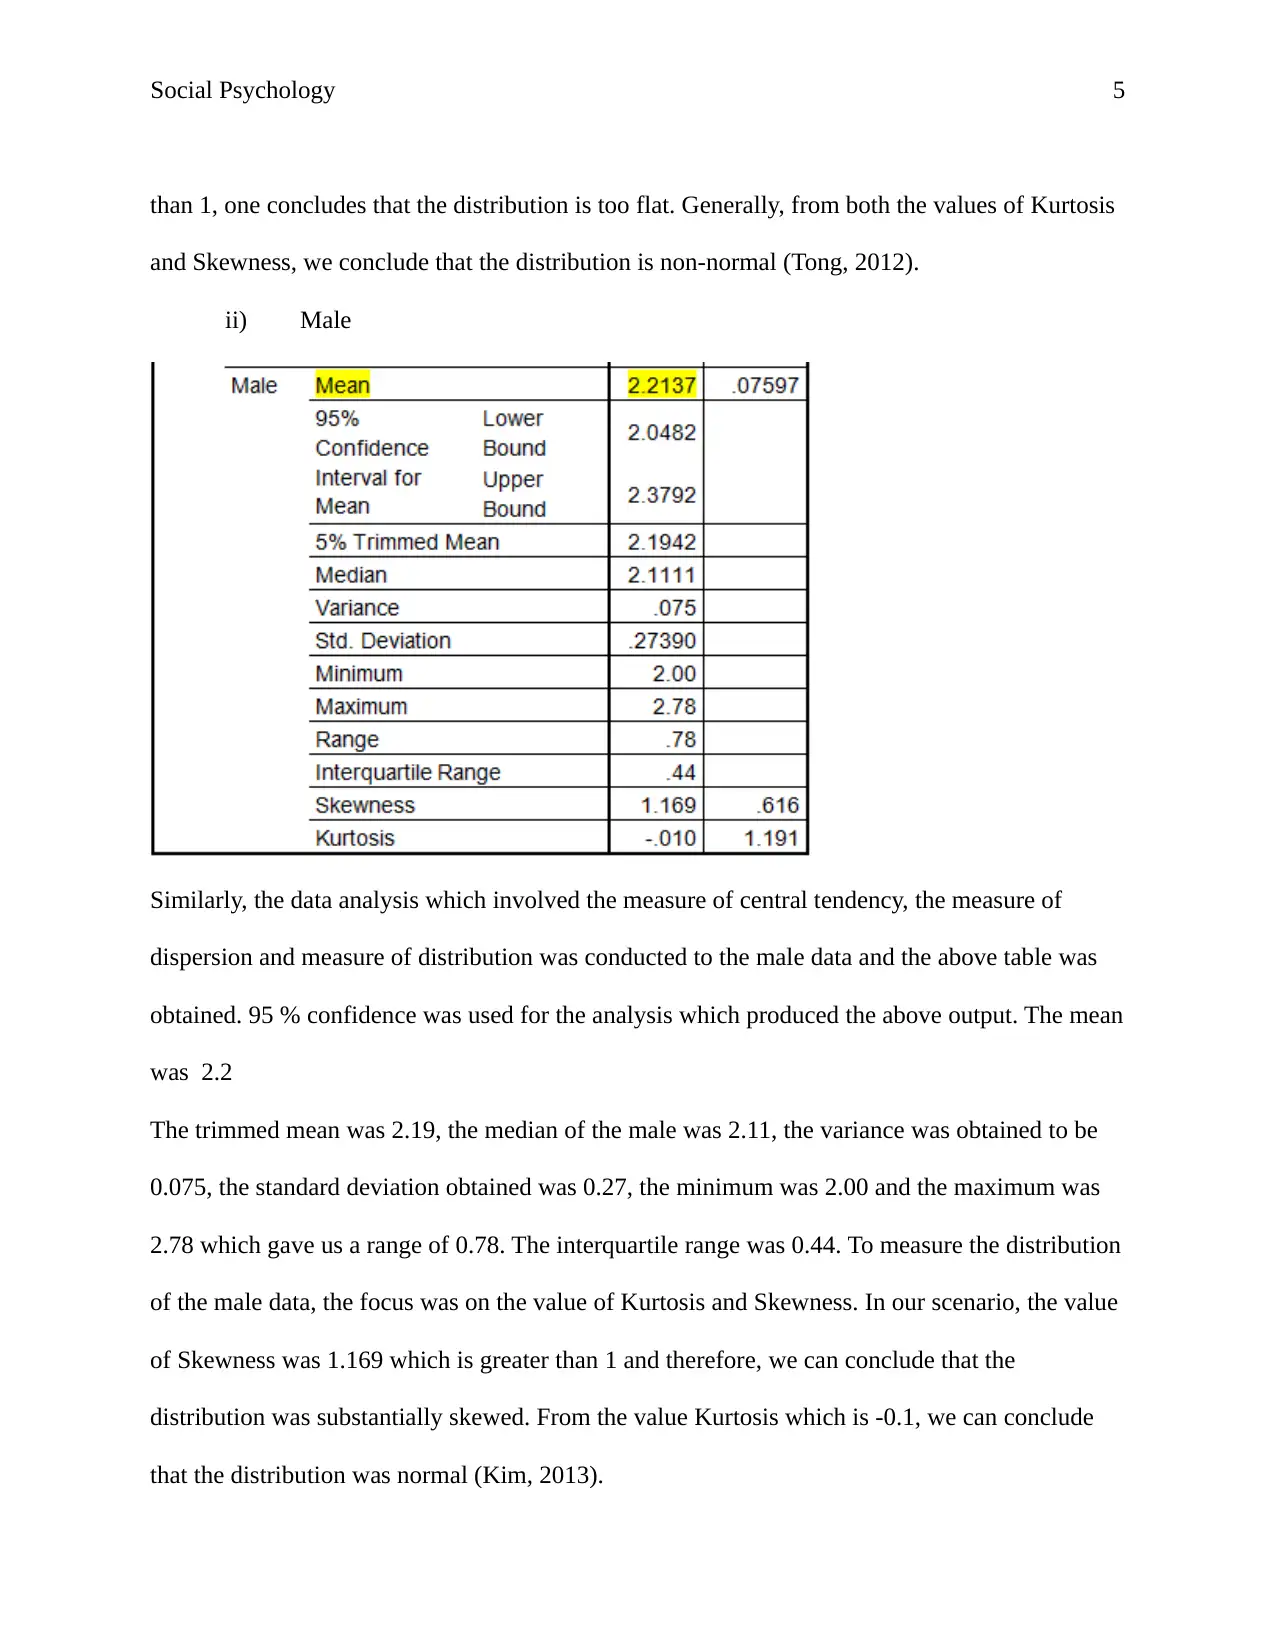
Similarly, the data analysis which involved the measure of central tendency, the measure of
dispersion and measure of distribution was conducted to the male data and the above table was
obtained. 95 % confidence was used for the analysis which produced the above output. The mean
was 2.2
The trimmed mean was 2.19, the median of the male was 2.11, the variance was obtained to be
0.075, the standard deviation obtained was 0.27, the minimum was 2.00 and the maximum was
2.78 which gave us a range of 0.78. The interquartile range was 0.44. To measure the distribution
of the male data, the focus was on the value of Kurtosis and Skewness. In our scenario, the value
of Skewness was 1.169 which is greater than 1 and therefore, we can conclude that the
distribution was substantially skewed. From the value Kurtosis which is -0.1, we can conclude
that the distribution was normal (Kim, 2013).
than 1, one concludes that the distribution is too flat. Generally, from both the values of Kurtosis
and Skewness, we conclude that the distribution is non-normal (Tong, 2012).
ii) Male
Similarly, the data analysis which involved the measure of central tendency, the measure of
dispersion and measure of distribution was conducted to the male data and the above table was
obtained. 95 % confidence was used for the analysis which produced the above output. The mean
was 2.2
The trimmed mean was 2.19, the median of the male was 2.11, the variance was obtained to be
0.075, the standard deviation obtained was 0.27, the minimum was 2.00 and the maximum was
2.78 which gave us a range of 0.78. The interquartile range was 0.44. To measure the distribution
of the male data, the focus was on the value of Kurtosis and Skewness. In our scenario, the value
of Skewness was 1.169 which is greater than 1 and therefore, we can conclude that the
distribution was substantially skewed. From the value Kurtosis which is -0.1, we can conclude
that the distribution was normal (Kim, 2013).
Social Psychology 6
Considering the statistic of both the males and females, we can conclude that the male has a
neutral attitude towards group work while the female had a negative attitude towards group
work.
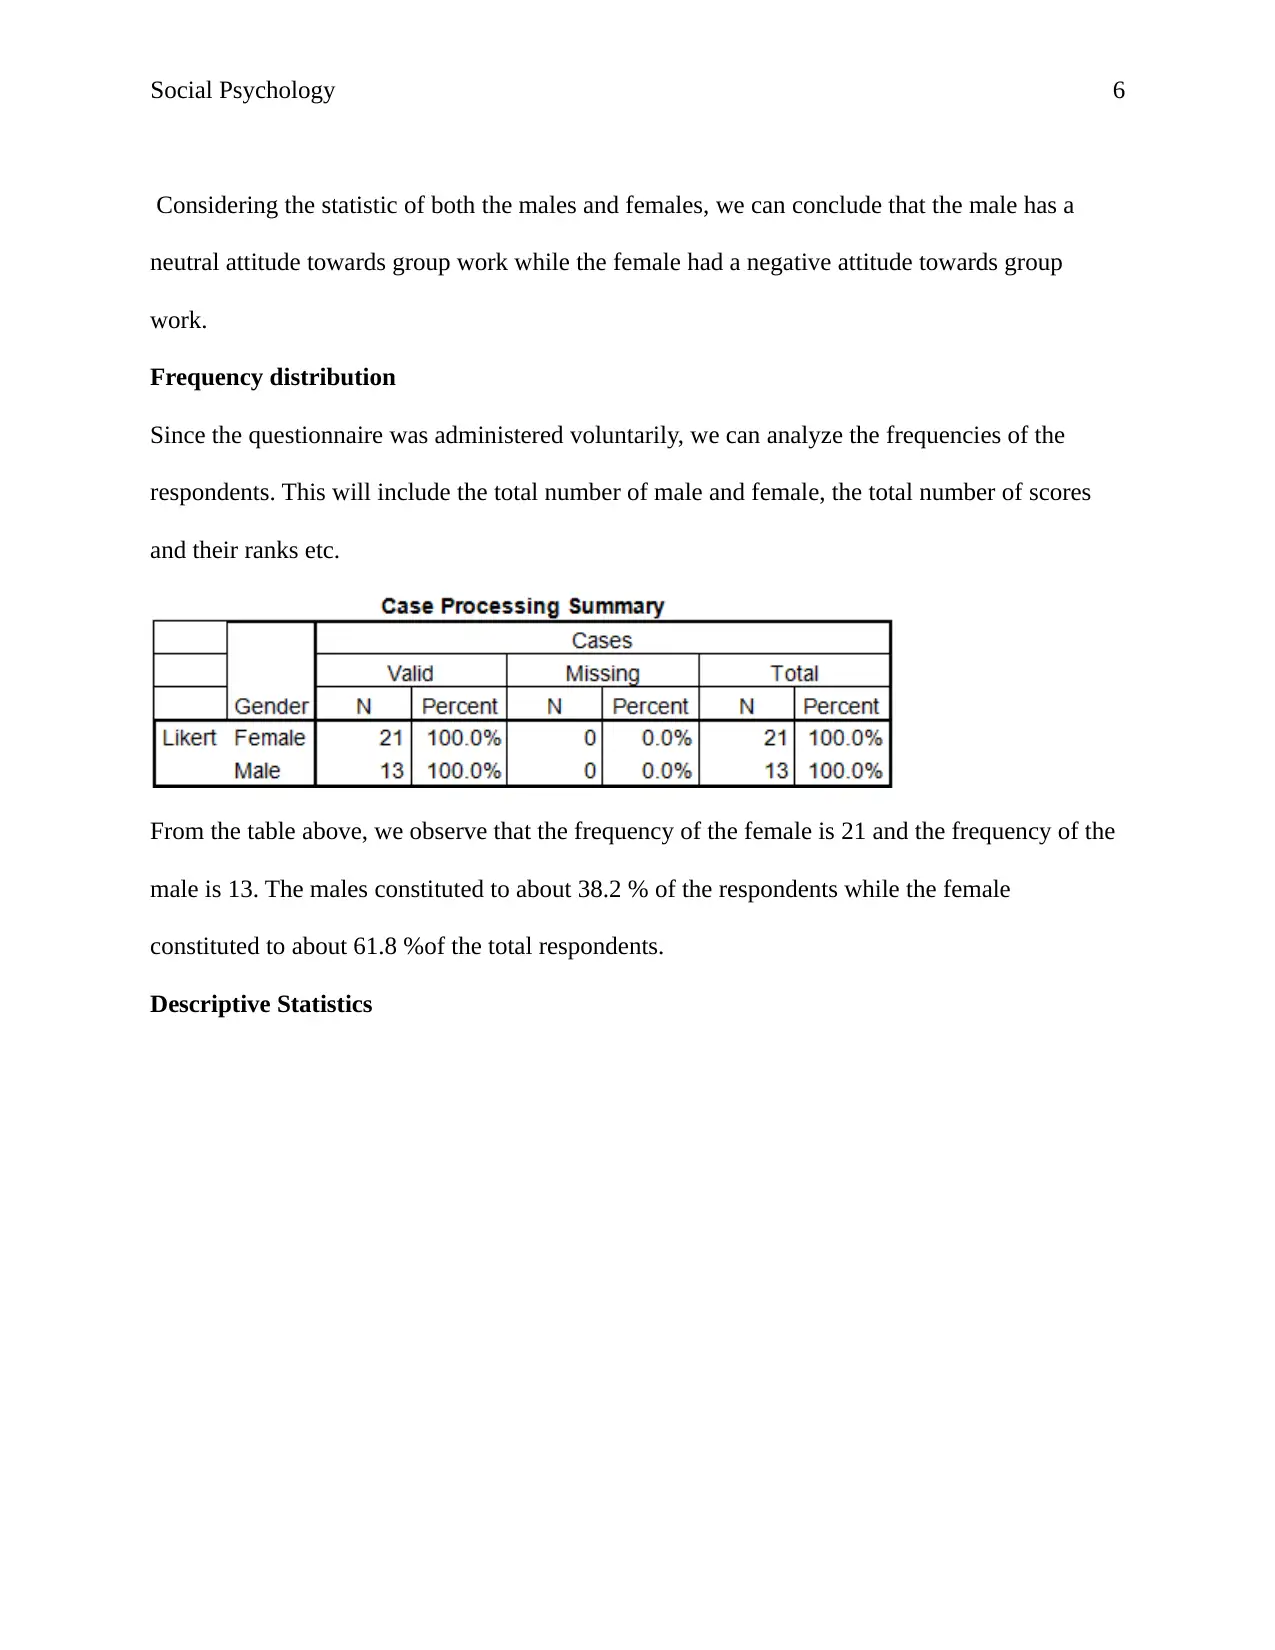
Frequency distribution
Since the questionnaire was administered voluntarily, we can analyze the frequencies of the
respondents. This will include the total number of male and female, the total number of scores
and their ranks etc.
From the table above, we observe that the frequency of the female is 21 and the frequency of the
male is 13. The males constituted to about 38.2 % of the respondents while the female
constituted to about 61.8 %of the total respondents.
Descriptive Statistics
Considering the statistic of both the males and females, we can conclude that the male has a
neutral attitude towards group work while the female had a negative attitude towards group
work.
Frequency distribution
Since the questionnaire was administered voluntarily, we can analyze the frequencies of the
respondents. This will include the total number of male and female, the total number of scores
and their ranks etc.
From the table above, we observe that the frequency of the female is 21 and the frequency of the
male is 13. The males constituted to about 38.2 % of the respondents while the female
constituted to about 61.8 %of the total respondents.
Descriptive Statistics
Social Psychology 7
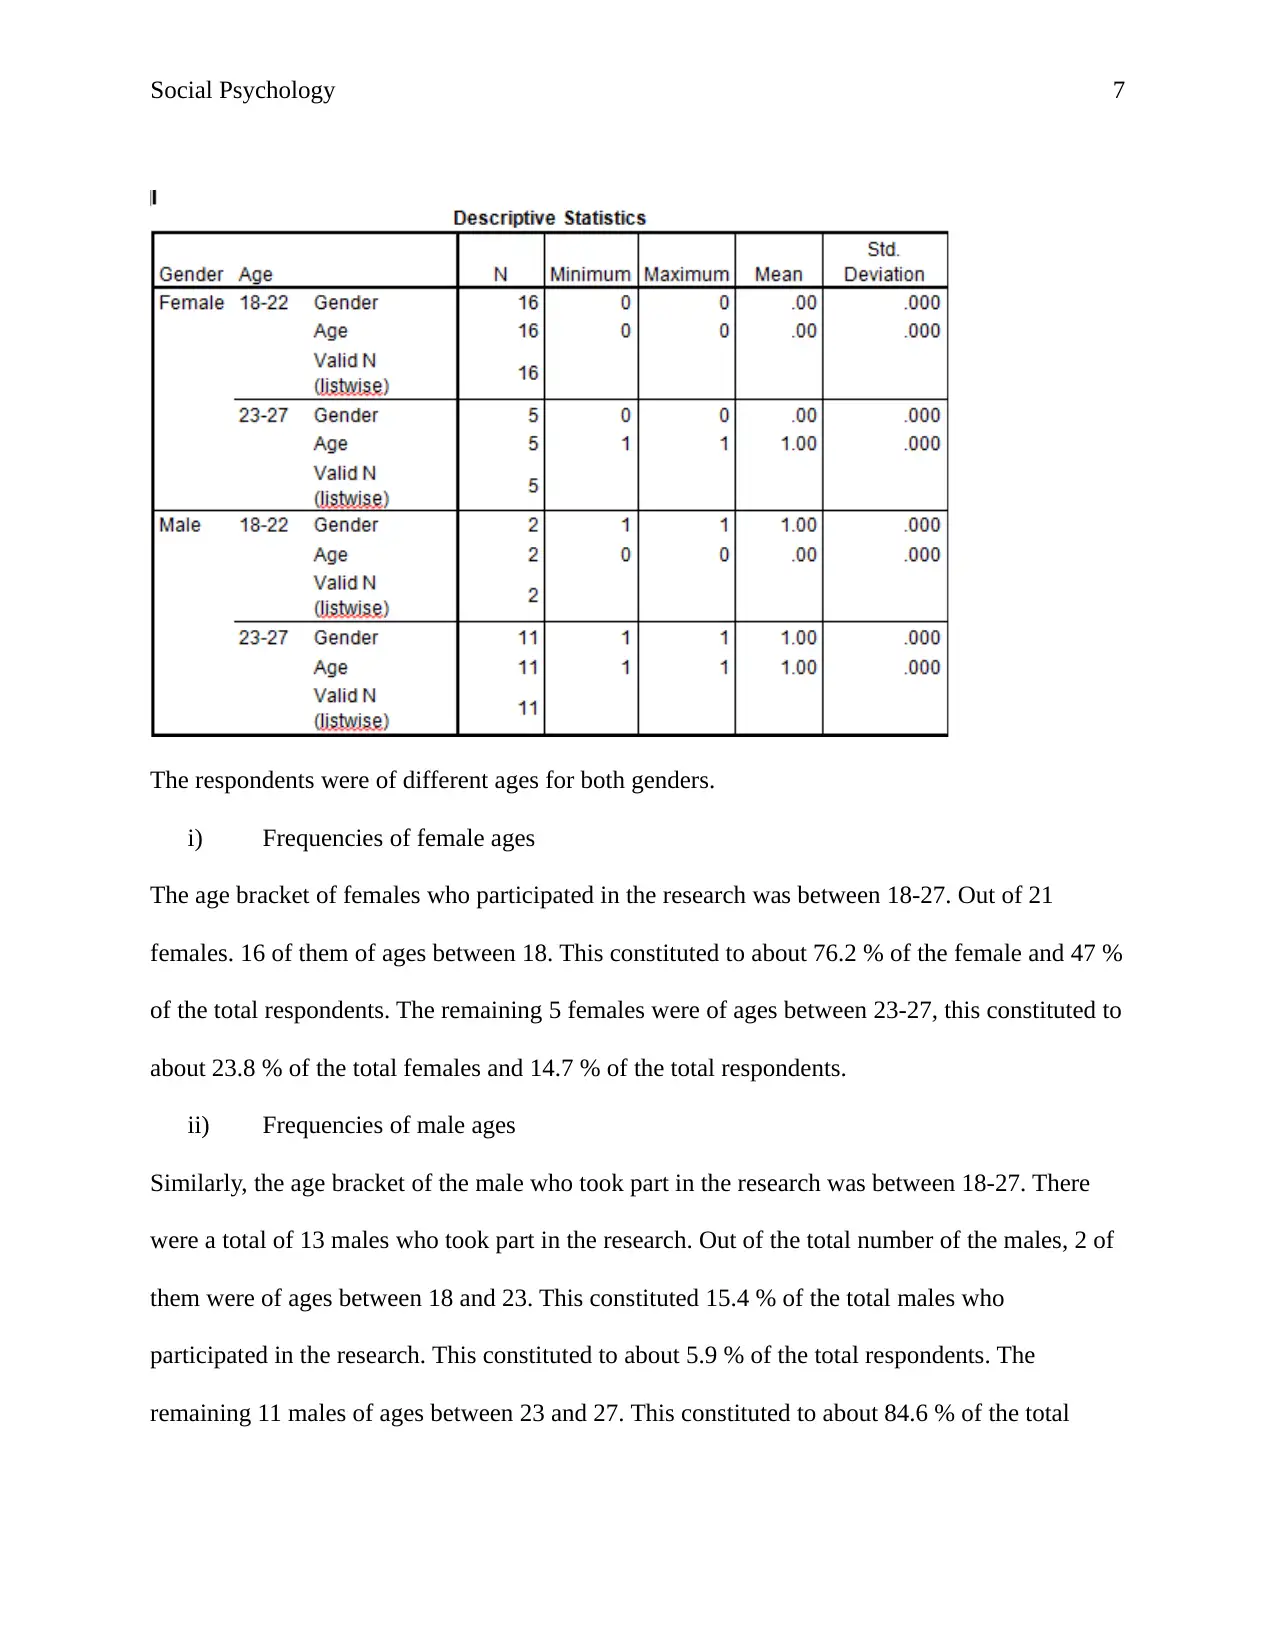
The respondents were of different ages for both genders.
i) Frequencies of female ages
The age bracket of females who participated in the research was between 18-27. Out of 21
females. 16 of them of ages between 18. This constituted to about 76.2 % of the female and 47 %
of the total respondents. The remaining 5 females were of ages between 23-27, this constituted to
about 23.8 % of the total females and 14.7 % of the total respondents.
ii) Frequencies of male ages
Similarly, the age bracket of the male who took part in the research was between 18-27. There
were a total of 13 males who took part in the research. Out of the total number of the males, 2 of
them were of ages between 18 and 23. This constituted 15.4 % of the total males who
participated in the research. This constituted to about 5.9 % of the total respondents. The
remaining 11 males of ages between 23 and 27. This constituted to about 84.6 % of the total
Paraphrase This Document
Need a fresh take? Get an instant paraphrase of this document with our AI Paraphraser
Social Psychology 8
males who took part in the research and 32.4 % of the total respondents who participated in the
data collection.
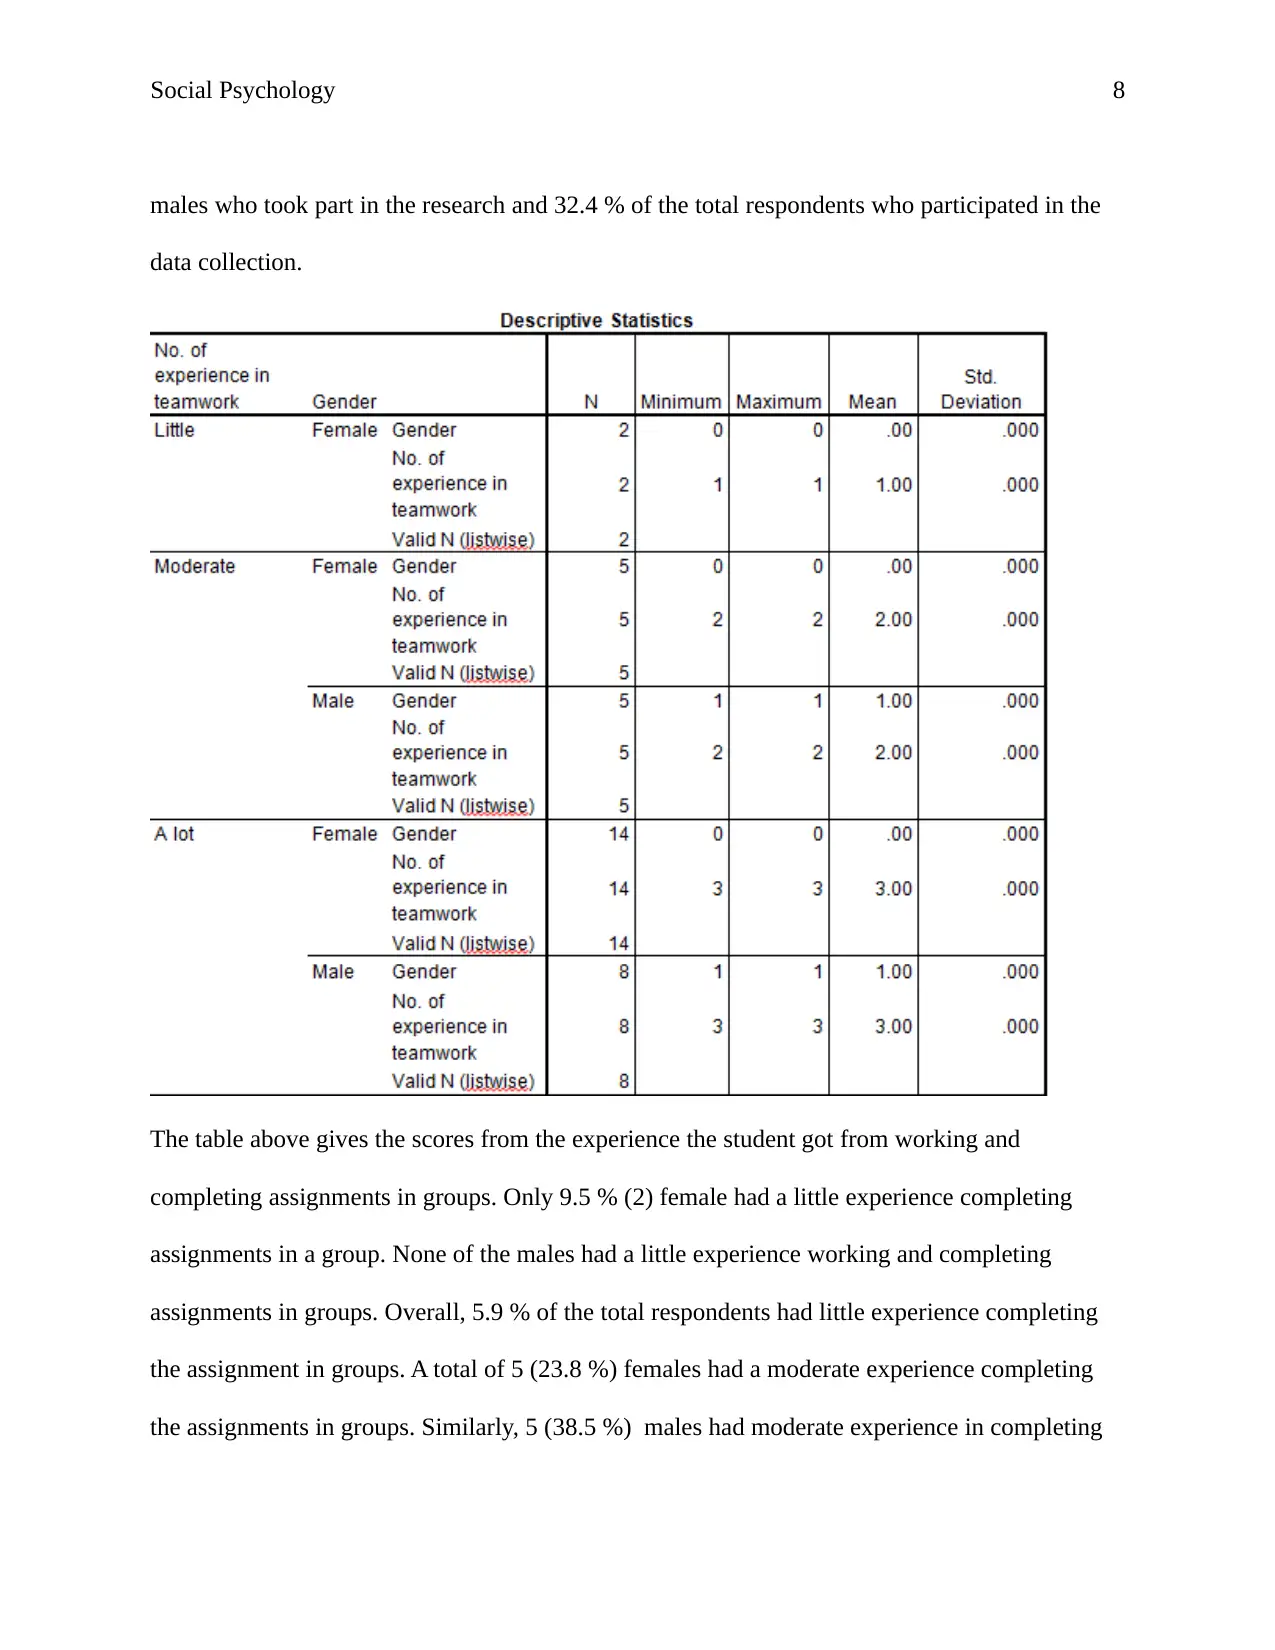
The table above gives the scores from the experience the student got from working and
completing assignments in groups. Only 9.5 % (2) female had a little experience completing
assignments in a group. None of the males had a little experience working and completing
assignments in groups. Overall, 5.9 % of the total respondents had little experience completing
the assignment in groups. A total of 5 (23.8 %) females had a moderate experience completing
the assignments in groups. Similarly, 5 (38.5 %) males had moderate experience in completing
males who took part in the research and 32.4 % of the total respondents who participated in the
data collection.
The table above gives the scores from the experience the student got from working and
completing assignments in groups. Only 9.5 % (2) female had a little experience completing
assignments in a group. None of the males had a little experience working and completing
assignments in groups. Overall, 5.9 % of the total respondents had little experience completing
the assignment in groups. A total of 5 (23.8 %) females had a moderate experience completing
the assignments in groups. Similarly, 5 (38.5 %) males had moderate experience in completing
Social Psychology 9
assignments in groups. A total of 10 participants had a moderate experience in completing the
assignment in groups and this constituted to about 29.4 % of the total participants.
A total of 14 (66.7 %) female had a lot of experience completing assignments in groups while 8
(61.5 %) males had a lot of experience working and completing their assignments in groups.
Generally, a total of 22 participants had a lot of experience completing assignments in groups
and this constituted to about 64.7 % of the total participants. From the above statistics, we can
tell that the majority of the participants in one way or another have been involved in group work
and only 2 of them have not been in any group work.
Negative aspects of teamwork
Social Psychology 10
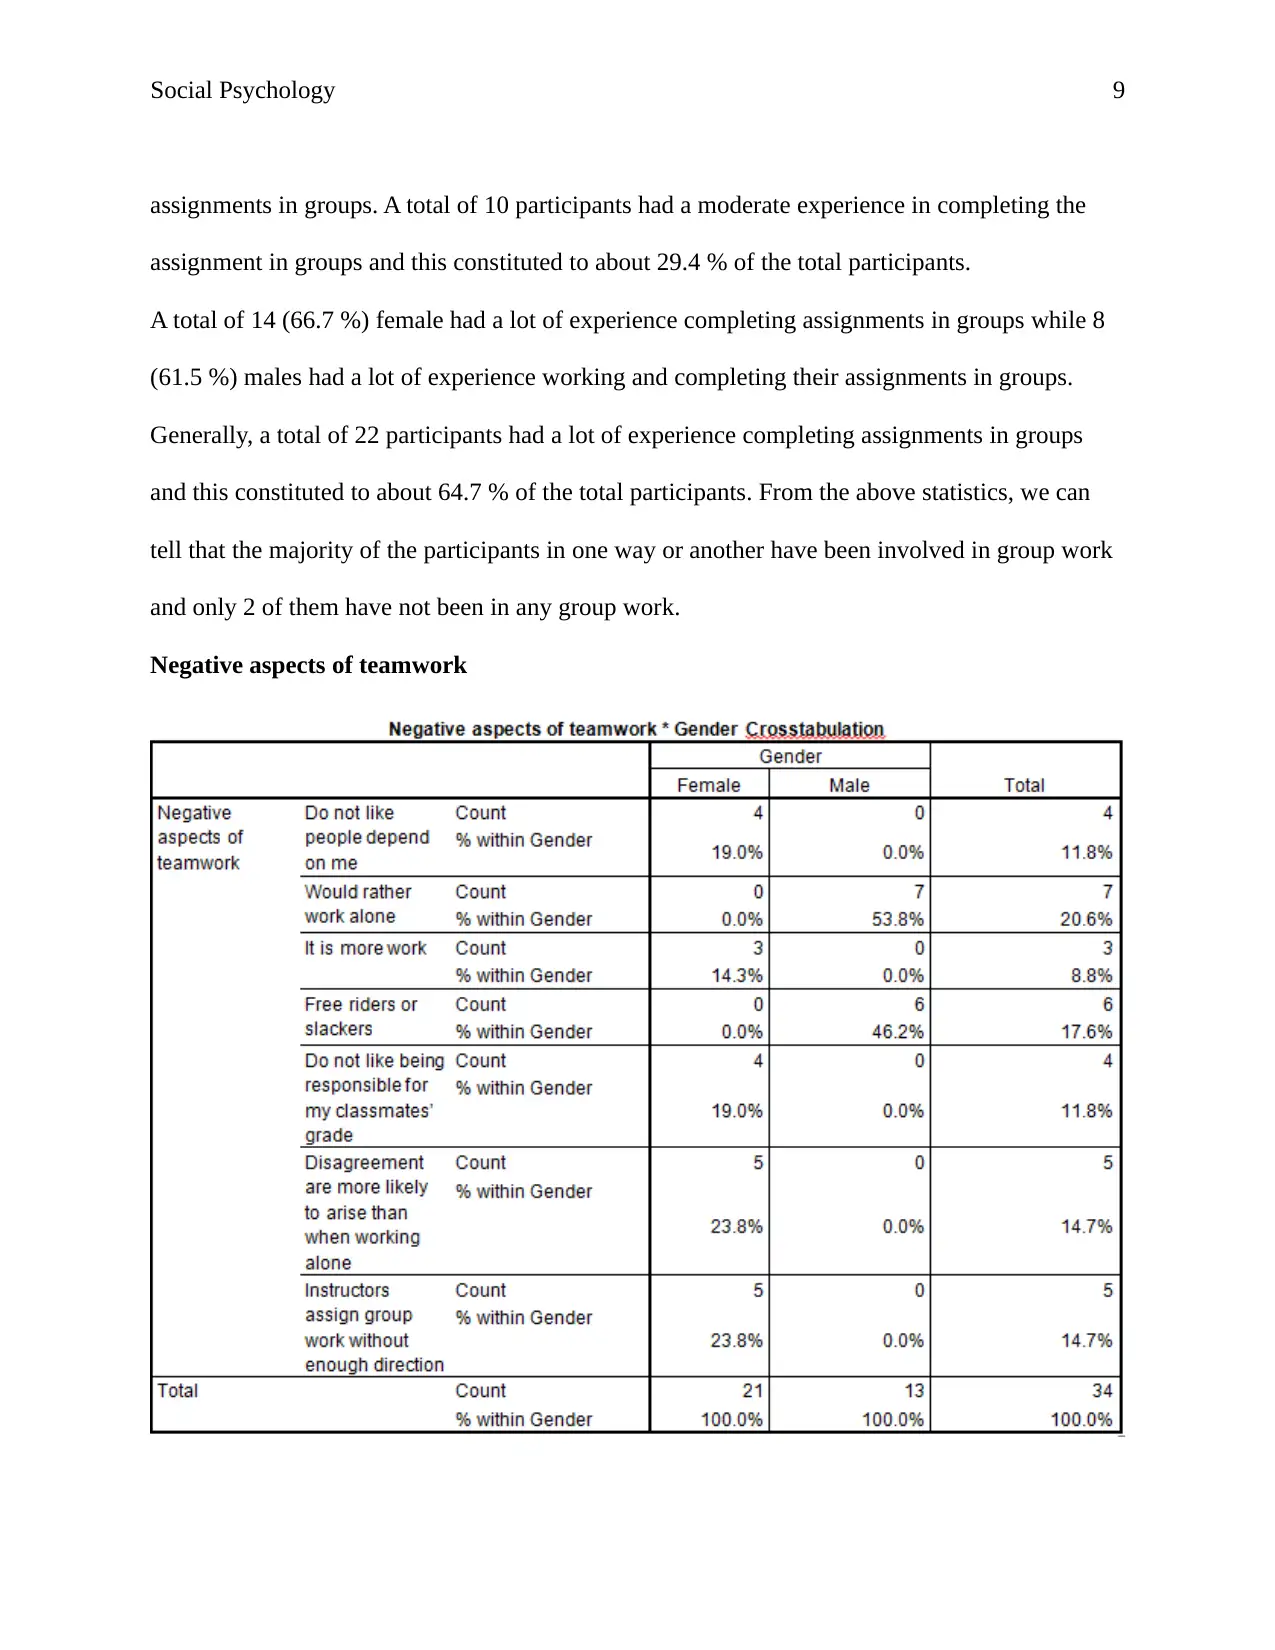
The table above shows what the participants don't like during group work. 4 (19 %) female don't
like other people depending on them during group work. None of the males had an issue with
other people depending on them. In total, 11.8 % of the respondents don't like other people
depending on them during group work. None of the females wished to work alone when doing
assignments while 7 (53.8 %) males preferred working alone when doing assignments. In total,
20.6 % of the total respondent preferred working alone when doing the assignment. 3 (14.3 %)
females felt that working as a group makes them do a lot of work as compared to when they are
doing the assignment alone while none of the males felt working as a group made do less work.
In total, 8.8 % of the respondents felt that group work made them do a lot of work. None of the
females felt that group work made other participants to be free rides and slackers while 6 (46.2
%) males felt that the group work makes other participants be free riders and slackers. In total,
17.6 of the total participants felt that group work makes other members of the group to be free
riders. 4 (19 %) females didn't want to be responsible for their classmate's grades while none of
the males didn't like being responsible for their classmates' grades. In total, 11.8 % of the total
participants didn't want to be responsible for their classmates' grades. 5 (23.8 %) females that
there might arise disagreement during group work while none of the males felt like that there
might disagreement during group work. In total, 14.7 % of the respondents felt like there might
disagreement during group discussion. Similarly, 5 (23.8 %) females felt like instructors assign
group work without enough directions while none of the males felt like the instructor's assigned
groups without enough directions. In total, 14.7 % of the respondents felt that the instructors
assigned groups without enough directions.
Secure Best Marks with AI Grader
Need help grading? Try our AI Grader for instant feedback on your assignments.
Social Psychology 11
Positive aspects of group work
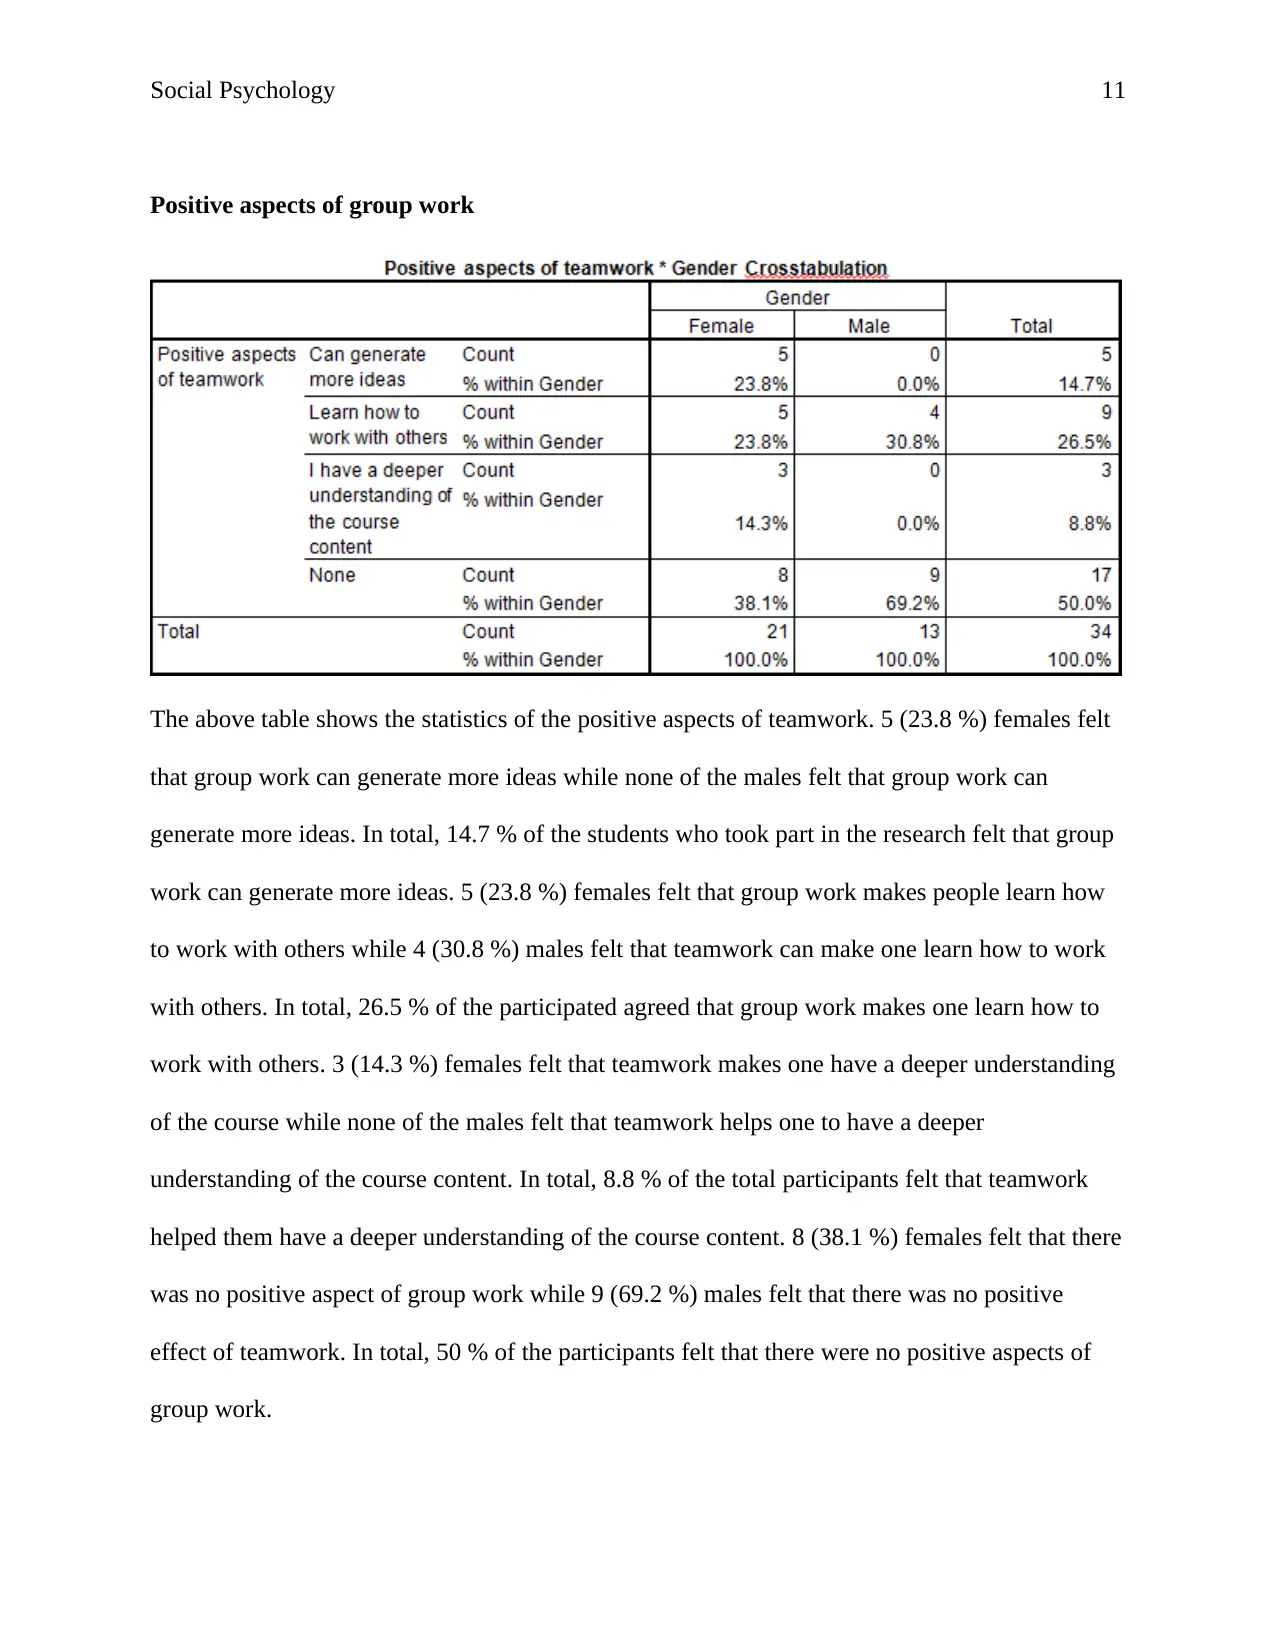
The above table shows the statistics of the positive aspects of teamwork. 5 (23.8 %) females felt
that group work can generate more ideas while none of the males felt that group work can
generate more ideas. In total, 14.7 % of the students who took part in the research felt that group
work can generate more ideas. 5 (23.8 %) females felt that group work makes people learn how
to work with others while 4 (30.8 %) males felt that teamwork can make one learn how to work
with others. In total, 26.5 % of the participated agreed that group work makes one learn how to
work with others. 3 (14.3 %) females felt that teamwork makes one have a deeper understanding
of the course while none of the males felt that teamwork helps one to have a deeper
understanding of the course content. In total, 8.8 % of the total participants felt that teamwork
helped them have a deeper understanding of the course content. 8 (38.1 %) females felt that there
was no positive aspect of group work while 9 (69.2 %) males felt that there was no positive
effect of teamwork. In total, 50 % of the participants felt that there were no positive aspects of
group work.
Positive aspects of group work
The above table shows the statistics of the positive aspects of teamwork. 5 (23.8 %) females felt
that group work can generate more ideas while none of the males felt that group work can
generate more ideas. In total, 14.7 % of the students who took part in the research felt that group
work can generate more ideas. 5 (23.8 %) females felt that group work makes people learn how
to work with others while 4 (30.8 %) males felt that teamwork can make one learn how to work
with others. In total, 26.5 % of the participated agreed that group work makes one learn how to
work with others. 3 (14.3 %) females felt that teamwork makes one have a deeper understanding
of the course while none of the males felt that teamwork helps one to have a deeper
understanding of the course content. In total, 8.8 % of the total participants felt that teamwork
helped them have a deeper understanding of the course content. 8 (38.1 %) females felt that there
was no positive aspect of group work while 9 (69.2 %) males felt that there was no positive
effect of teamwork. In total, 50 % of the participants felt that there were no positive aspects of
group work.
Social Psychology 12
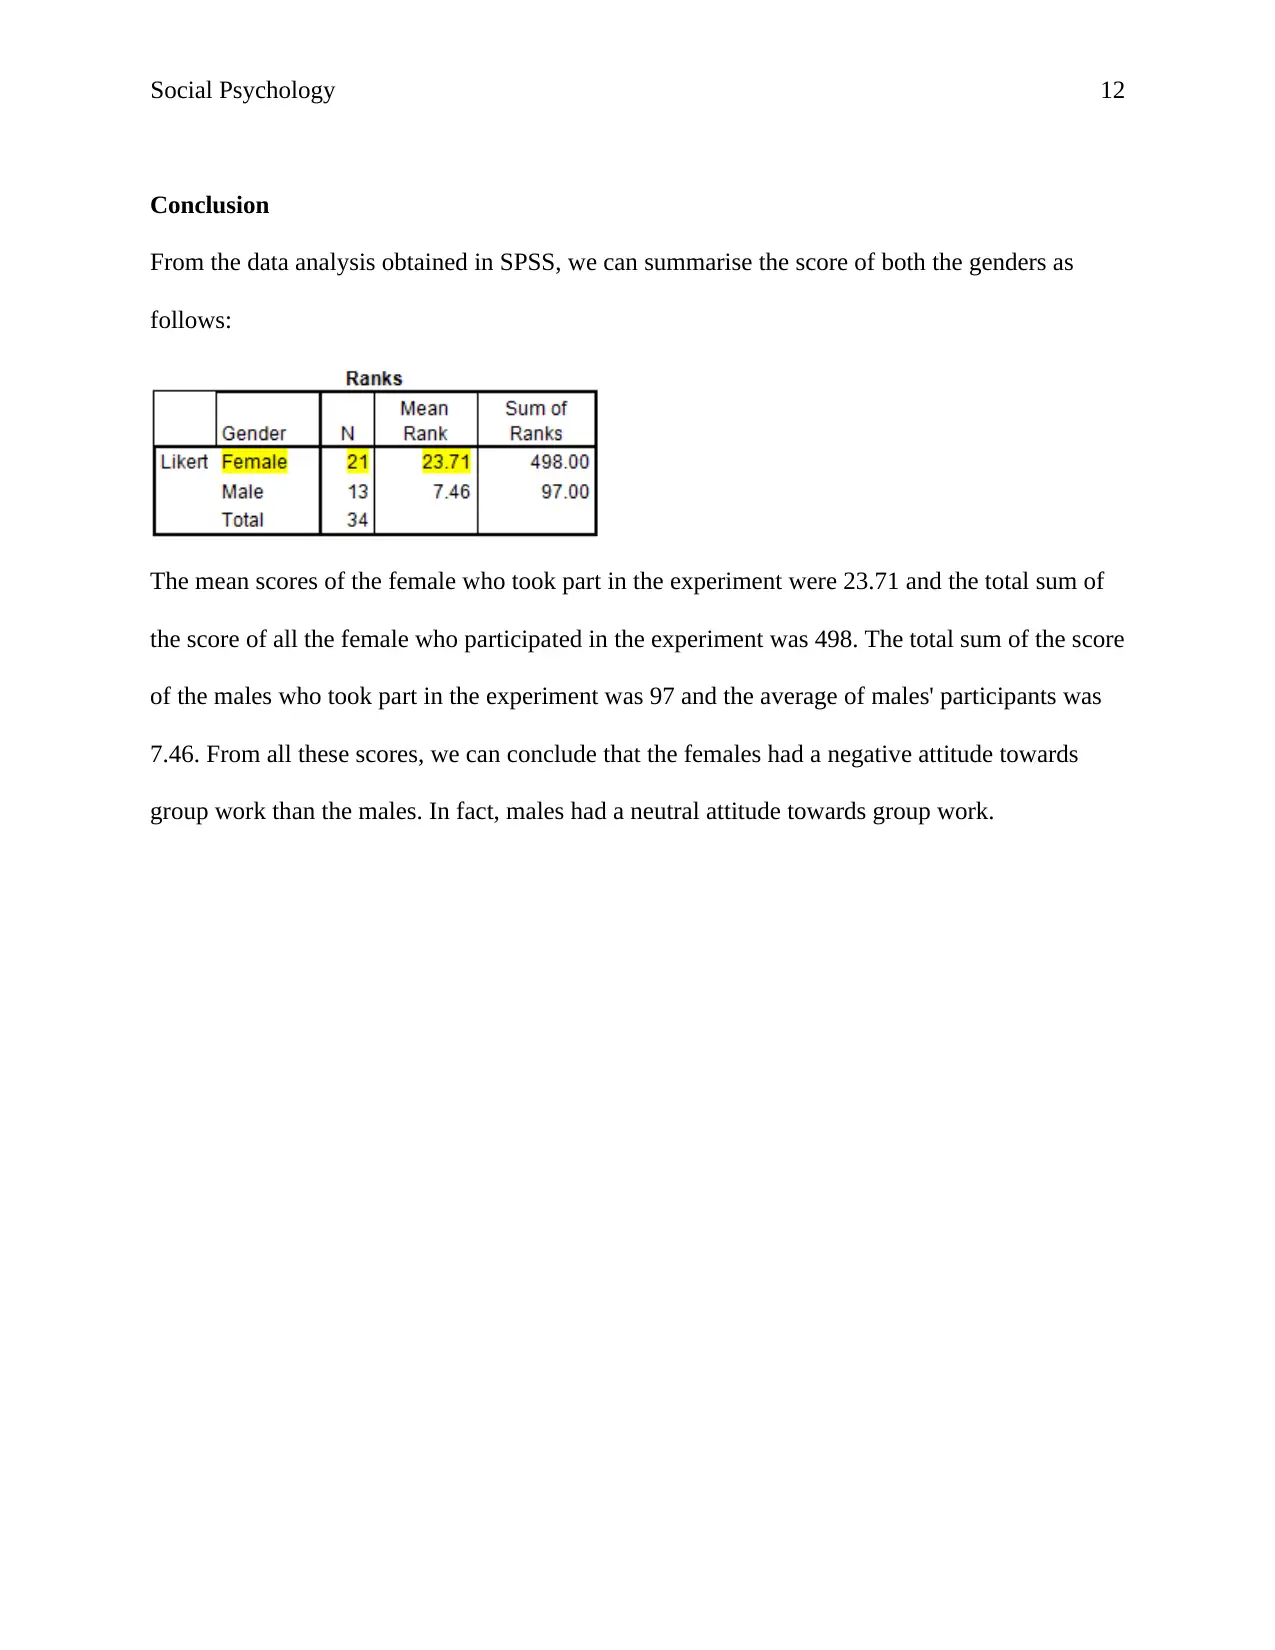
Conclusion
From the data analysis obtained in SPSS, we can summarise the score of both the genders as
follows:
The mean scores of the female who took part in the experiment were 23.71 and the total sum of
the score of all the female who participated in the experiment was 498. The total sum of the score
of the males who took part in the experiment was 97 and the average of males' participants was
7.46. From all these scores, we can conclude that the females had a negative attitude towards
group work than the males. In fact, males had a neutral attitude towards group work.
Social Psychology 13
Reference
Azad, M., & Kalam, A. (2013). Grammar Teaching in EFL Classrooms: Teachers' Attitudes and
Beliefs. ASA University Review, 7(2).
Kim, H. Y. (2013). Statistical notes for clinical researchers: assessing normal distribution (2)
using skewness and kurtosis. Restorative dentistry & endodontics, 38(1), 52-54.
Tong, Y. L. (2012). The multivariate normal distribution. Springer Science & Business Media.
Kim, H. Y. (2013). Statistical notes for clinical researchers: assessing normal distribution (2)
using skewness and kurtosis. Restorative dentistry & endodontics, 38(1), 52-54.
1 out of 13
Related Documents


Your All-in-One AI-Powered Toolkit for Academic Success.
+13062052269
info@desklib.com
Available 24*7 on WhatsApp / Email
![[object Object]](/_next/static/media/star-bottom.7253800d.svg)
Unlock your academic potential
© 2024 | Zucol Services PVT LTD | All rights reserved.