SPSS Programme | Data Analysis Technique
21 Pages3211 Words62 Views
Added on 2020-01-28
SPSS Programme | Data Analysis Technique
Added on 2020-01-28
ShareRelated Documents
SPSS Programme

Table of ContentsINTRODUCTION...........................................................................................................................3a. Presenting the estimated effect of distance on years of education...........................................3b. Explaining the extent to which effect might differ according to the racial aspects.................53. Presenting the extent to whichfamily incomeinfluences the level of distance........................54. Identifying alternative technique which can be used for analyzing the data set......................6CONCLUSION................................................................................................................................8REFERENCES................................................................................................................................9Table..............................................................................................................................................11
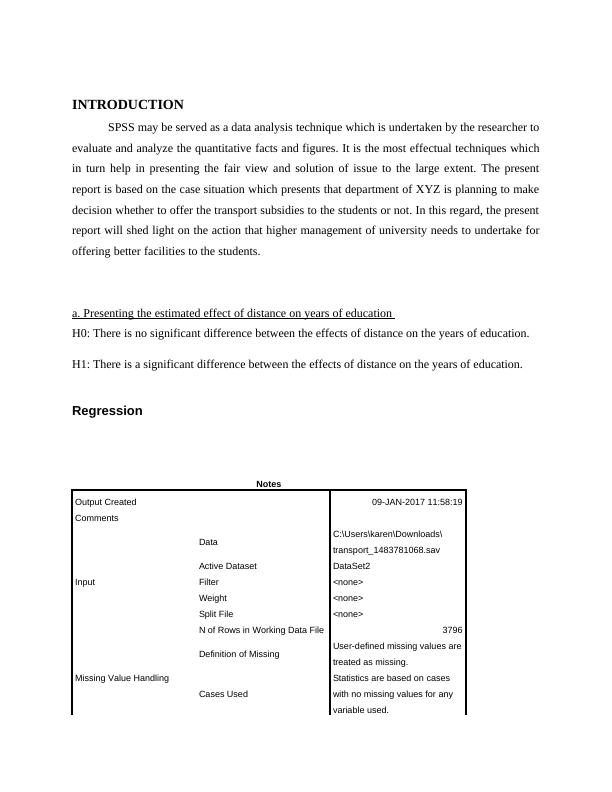
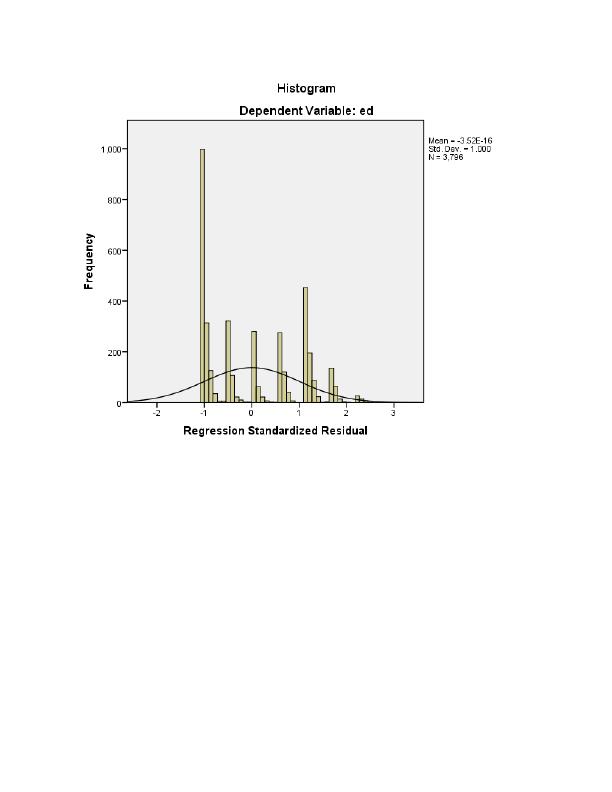
INTRODUCTION SPSS may be served as a data analysis technique which is undertaken by the researcher toevaluate and analyze the quantitative facts and figures. It is the most effectual techniques whichin turn help in presenting the fair view and solution of issue to the large extent. The presentreport is based on the case situation which presents that department of XYZ is planning to makedecision whether to offer the transport subsidies to the students or not. In this regard, the presentreport will shed light on the action that higher management of university needs to undertake foroffering better facilities to the students. a. Presenting the estimated effect of distance on years of education H0: There is no significant difference between the effects of distance on the years of education. H1: There is a significant difference between the effects of distance on the years of education.RegressionNotesOutput Created09-JAN-2017 11:58:19CommentsInputDataC:\Users\karen\Downloads\transport_1483781068.savActive DatasetDataSet2Filter<none>Weight<none>Split File<none>N of Rows in Working Data File3796Missing Value HandlingDefinition of MissingUser-defined missing values aretreated as missing.Cases UsedStatistics are based on cases with no missing values for any variable used.
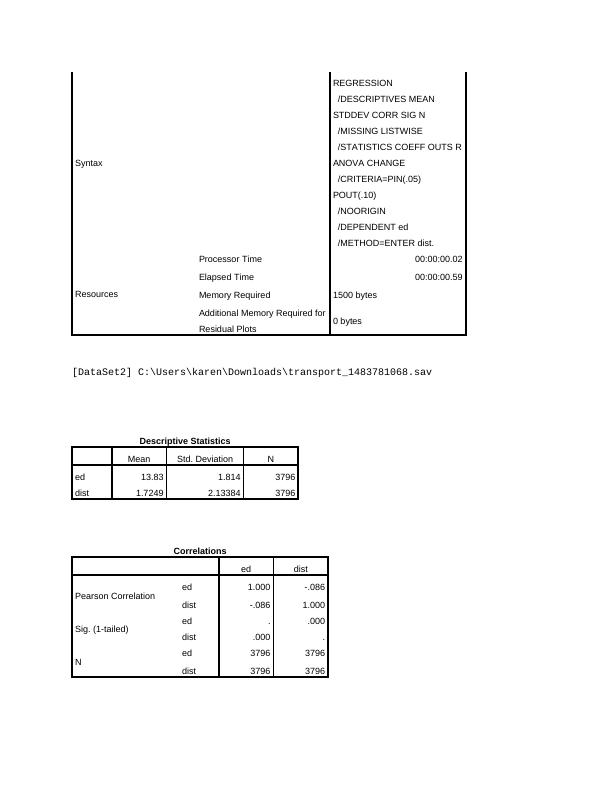
SyntaxREGRESSION /DESCRIPTIVES MEAN STDDEV CORR SIG N /MISSING LISTWISE /STATISTICS COEFF OUTS RANOVA CHANGE /CRITERIA=PIN(.05) POUT(.10) /NOORIGIN /DEPENDENT ed /METHOD=ENTER dist.ResourcesProcessor Time00:00:00.02Elapsed Time00:00:00.59Memory Required1500 bytesAdditional Memory Required forResidual Plots0 bytes[DataSet2] C:\Users\karen\Downloads\transport_1483781068.savDescriptive StatisticsMeanStd. DeviationNed13.831.8143796dist1.72492.133843796CorrelationseddistPearson Correlationed1.000-.086dist-.0861.000Sig. (1-tailed)ed..000dist.000.Ned37963796dist37963796
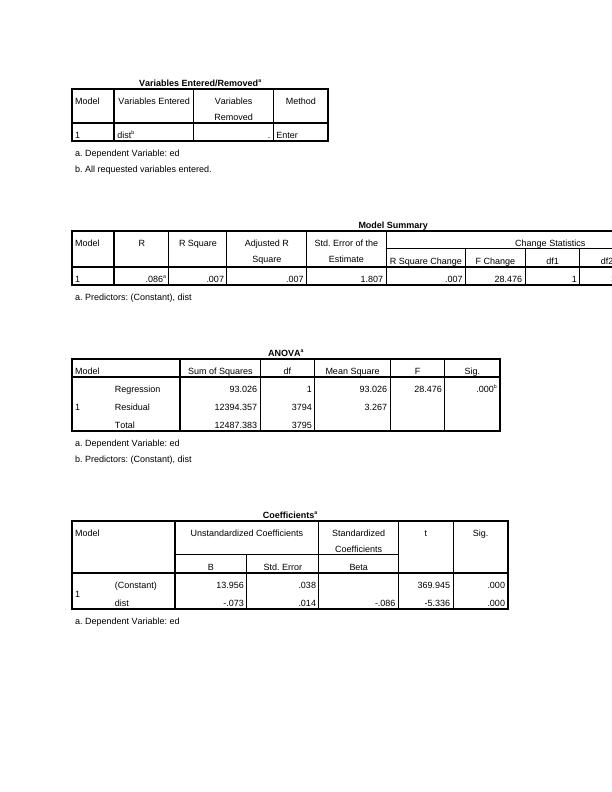
Variables Entered/RemovedaModelVariables EnteredVariablesRemovedMethod1distb.Entera. Dependent Variable: edb. All requested variables entered.Model SummaryModelRR SquareAdjusted RSquareStd. Error of theEstimateChange StatisticsR Square ChangeF Changedf1df21.086a.007.0071.807.00728.47613794a. Predictors: (Constant), distANOVAaModelSum of SquaresdfMean SquareFSig.1Regression93.026193.02628.476.000bResidual12394.35737943.267Total12487.3833795a. Dependent Variable: edb. Predictors: (Constant), distCoefficientsaModelUnstandardized CoefficientsStandardizedCoefficientstSig.BStd. ErrorBeta1(Constant)13.956.038369.945.000dist-.073.014-.086-5.336.000a. Dependent Variable: ed
End of preview
Want to access all the pages? Upload your documents or become a member.
Related Documents
Descriptive Stats & Correlationslg...
|6
|493
|390
Regression Analysis in SPSSlg...
|16
|1866
|25
SPSS Analysis Project – Part 3lg...
|24
|5780
|67
Regression Analysis of Globalization Impact on Tescolg...
|10
|1175
|155
SPSS Syntax and Output for Univariate and 2-Way ANOVAlg...
|10
|1356
|110
Research Methods in Psychologylg...
|10
|1330
|247