Statistics 101 Study Material
VerifiedAdded on 2023/04/17
|10
|1376
|166
AI Summary
This study material for Statistics 101 covers topics such as histograms, relationships between variables, proportions, and more. It provides detailed explanations and examples to help students understand the concepts. The material is suitable for students studying Statistics 101 in any college or university.
Contribute Materials
Your contribution can guide someone’s learning journey. Share your
documents today.
STATISTICS 101
STUDENT ID:
[Pick the date]
STUDENT ID:
[Pick the date]
Secure Best Marks with AI Grader
Need help grading? Try our AI Grader for instant feedback on your assignments.
STATISTICS 101
Question 2
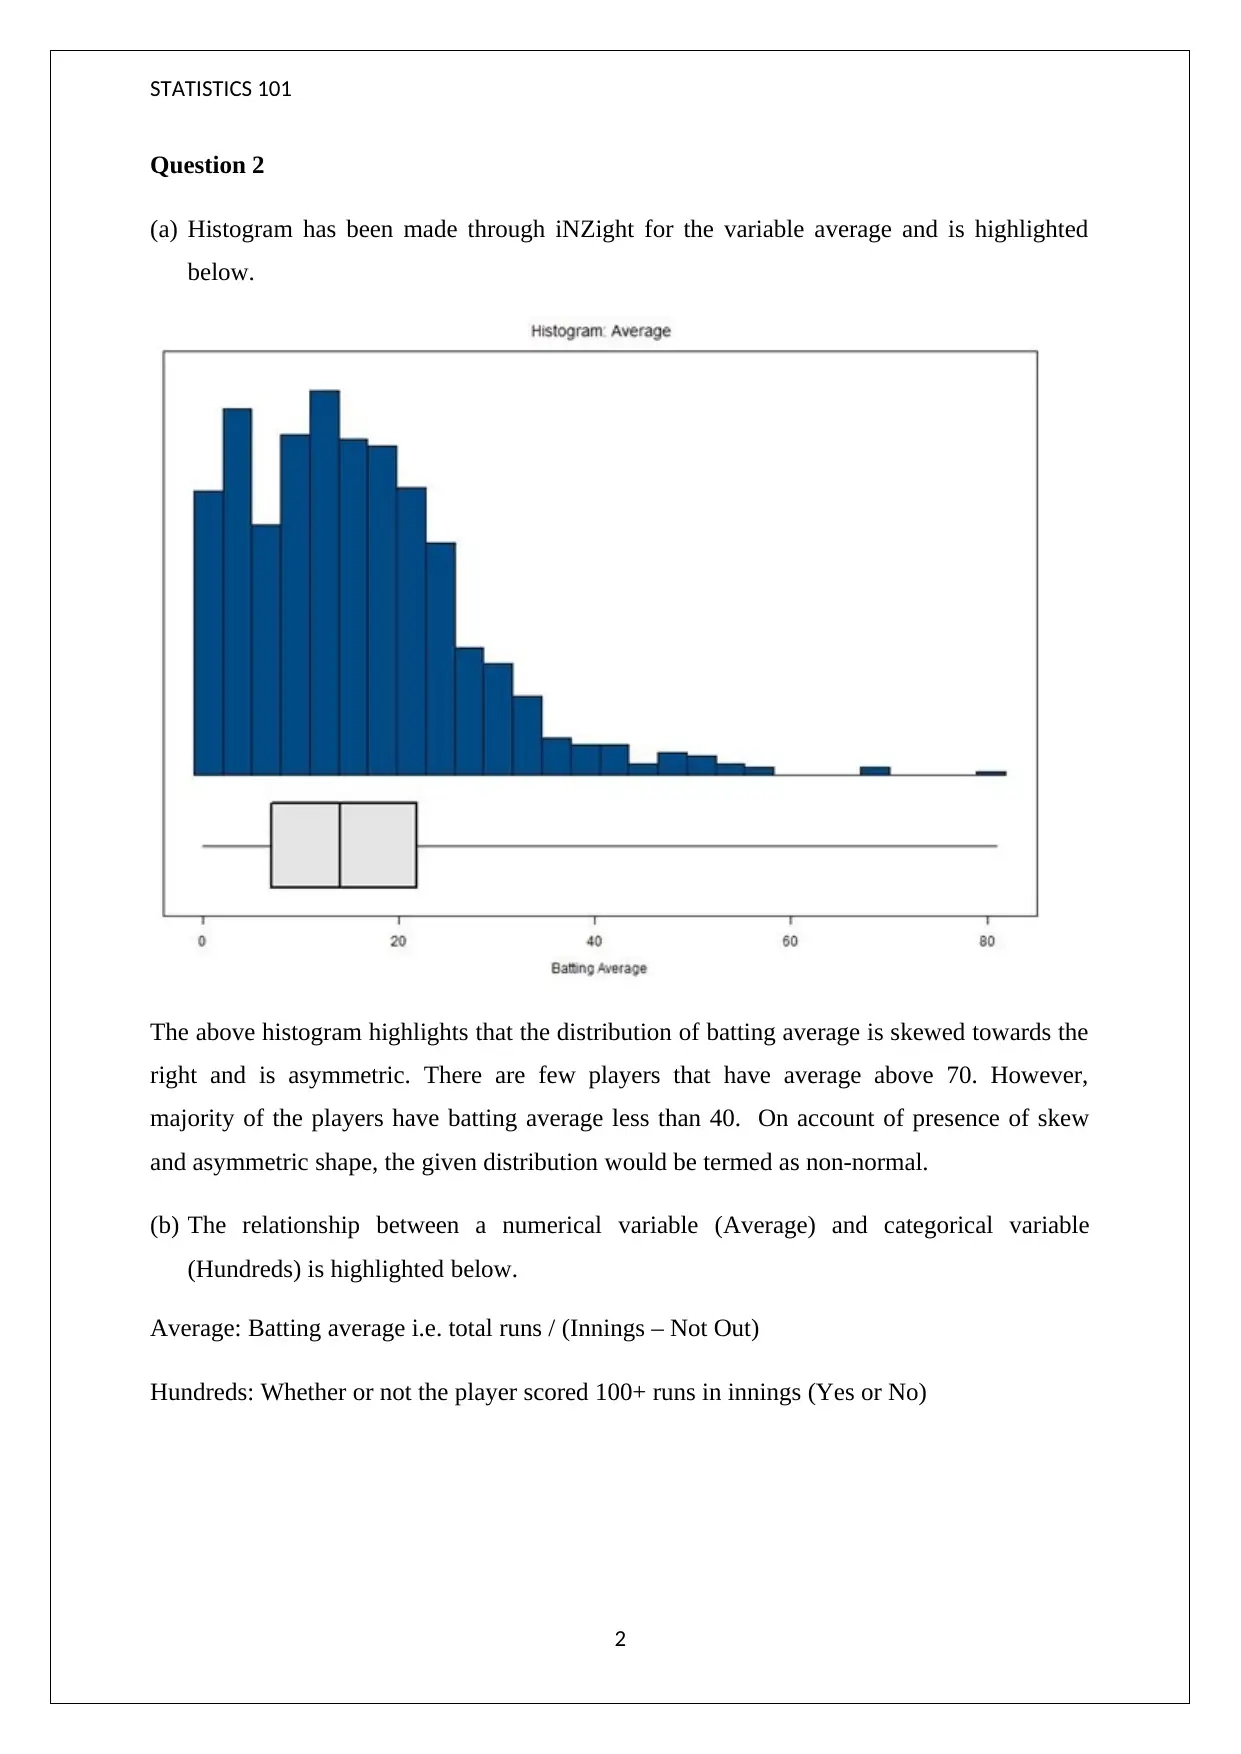
(a) Histogram has been made through iNZight for the variable average and is highlighted
below.
The above histogram highlights that the distribution of batting average is skewed towards the
right and is asymmetric. There are few players that have average above 70. However,
majority of the players have batting average less than 40. On account of presence of skew
and asymmetric shape, the given distribution would be termed as non-normal.
(b) The relationship between a numerical variable (Average) and categorical variable
(Hundreds) is highlighted below.
Average: Batting average i.e. total runs / (Innings – Not Out)
Hundreds: Whether or not the player scored 100+ runs in innings (Yes or No)
2
Question 2
(a) Histogram has been made through iNZight for the variable average and is highlighted
below.
The above histogram highlights that the distribution of batting average is skewed towards the
right and is asymmetric. There are few players that have average above 70. However,
majority of the players have batting average less than 40. On account of presence of skew
and asymmetric shape, the given distribution would be termed as non-normal.
(b) The relationship between a numerical variable (Average) and categorical variable
(Hundreds) is highlighted below.
Average: Batting average i.e. total runs / (Innings – Not Out)
Hundreds: Whether or not the player scored 100+ runs in innings (Yes or No)
2
STATISTICS 101
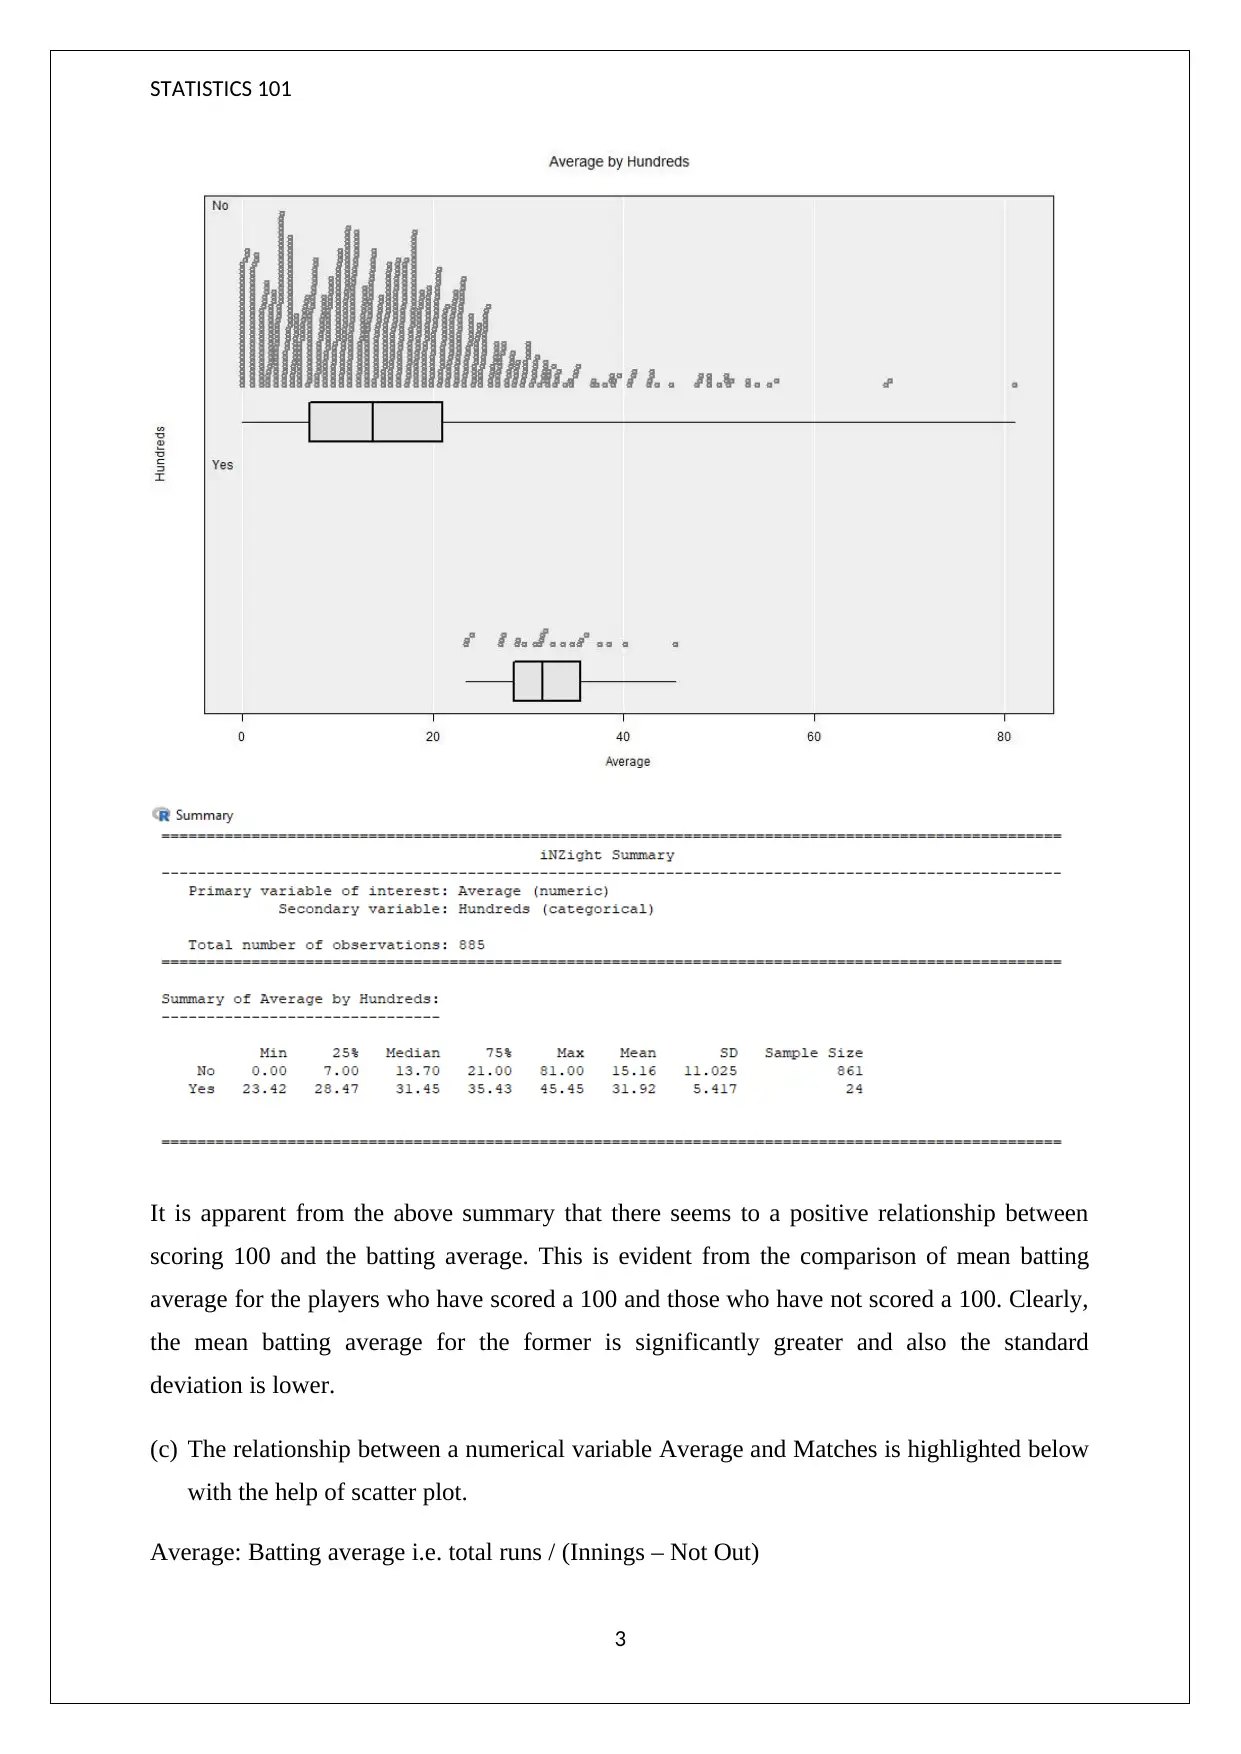
It is apparent from the above summary that there seems to a positive relationship between
scoring 100 and the batting average. This is evident from the comparison of mean batting
average for the players who have scored a 100 and those who have not scored a 100. Clearly,
the mean batting average for the former is significantly greater and also the standard
deviation is lower.
(c) The relationship between a numerical variable Average and Matches is highlighted below
with the help of scatter plot.
Average: Batting average i.e. total runs / (Innings – Not Out)
3
STATISTICS 101
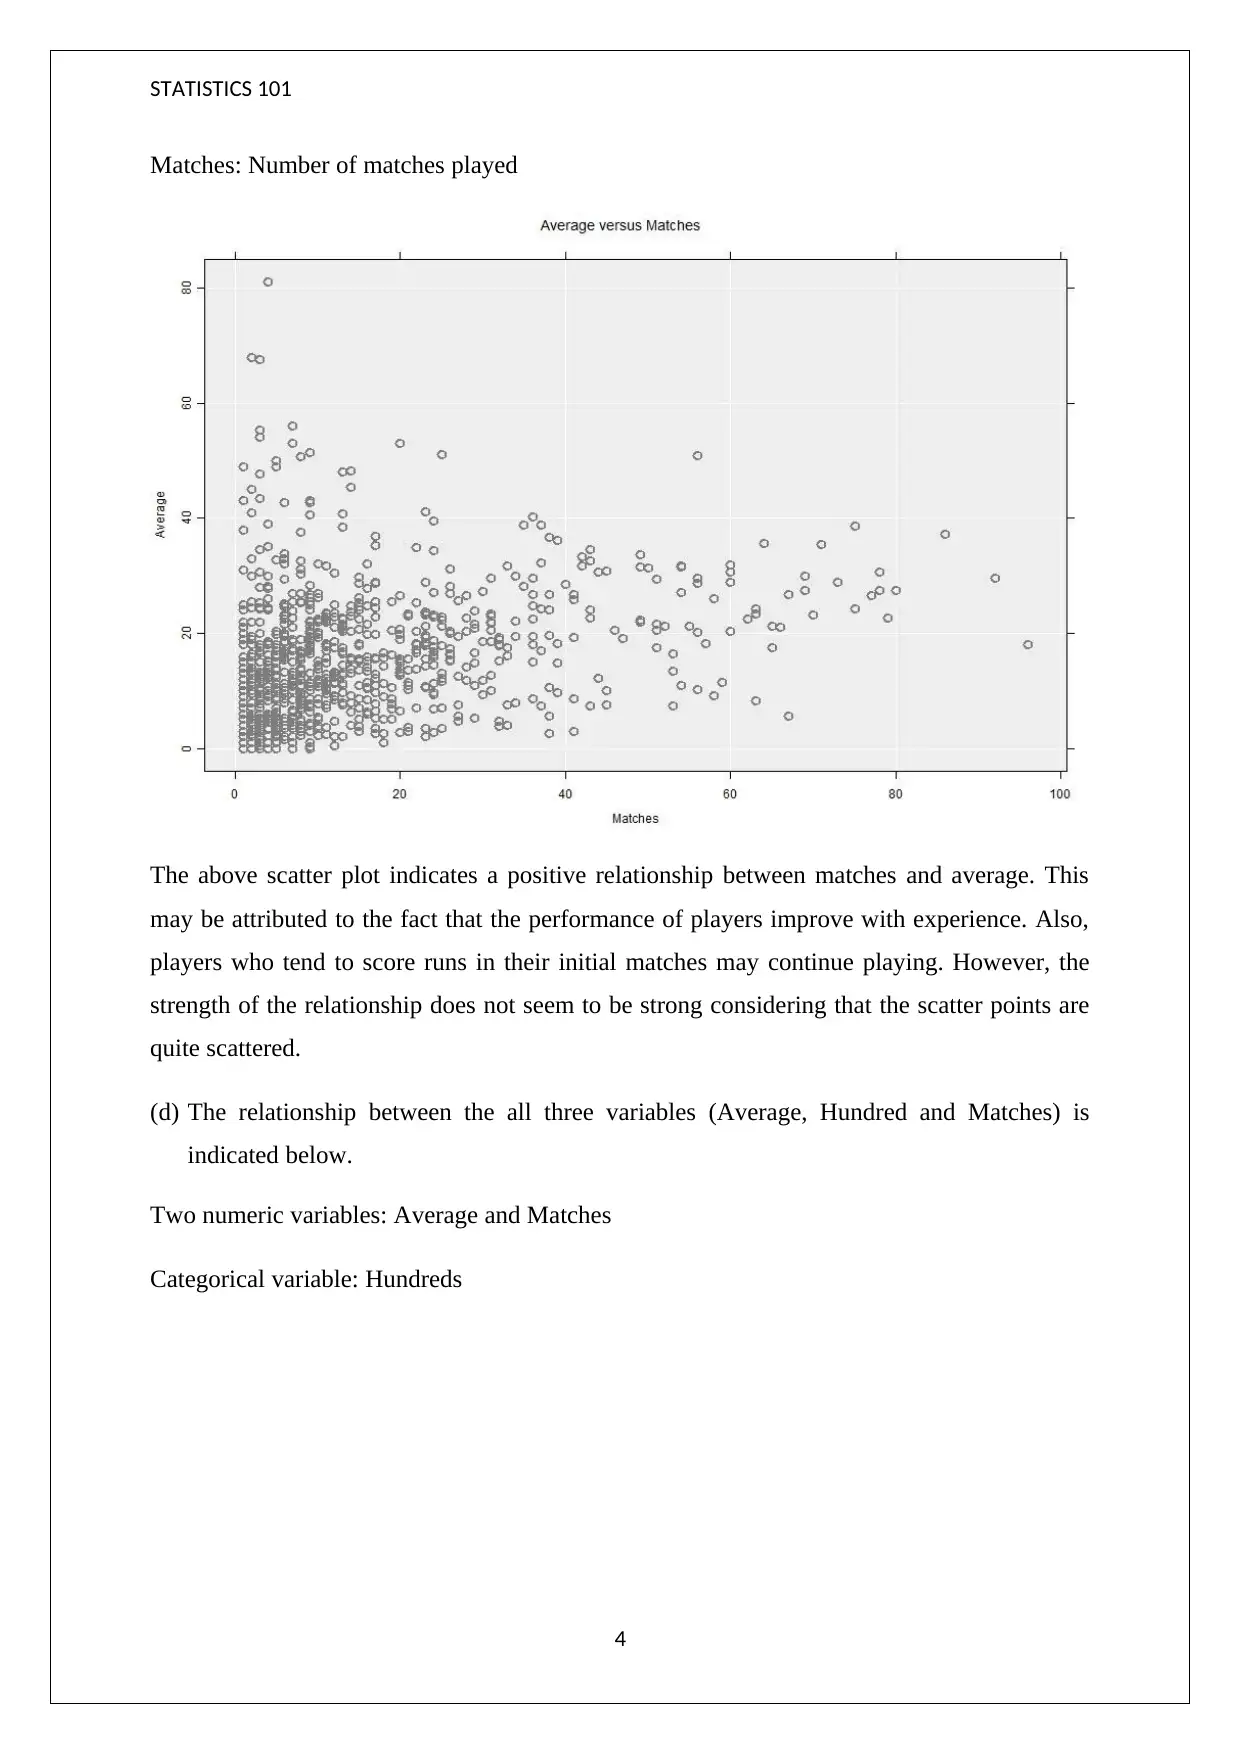
Matches: Number of matches played
The above scatter plot indicates a positive relationship between matches and average. This
may be attributed to the fact that the performance of players improve with experience. Also,
players who tend to score runs in their initial matches may continue playing. However, the
strength of the relationship does not seem to be strong considering that the scatter points are
quite scattered.
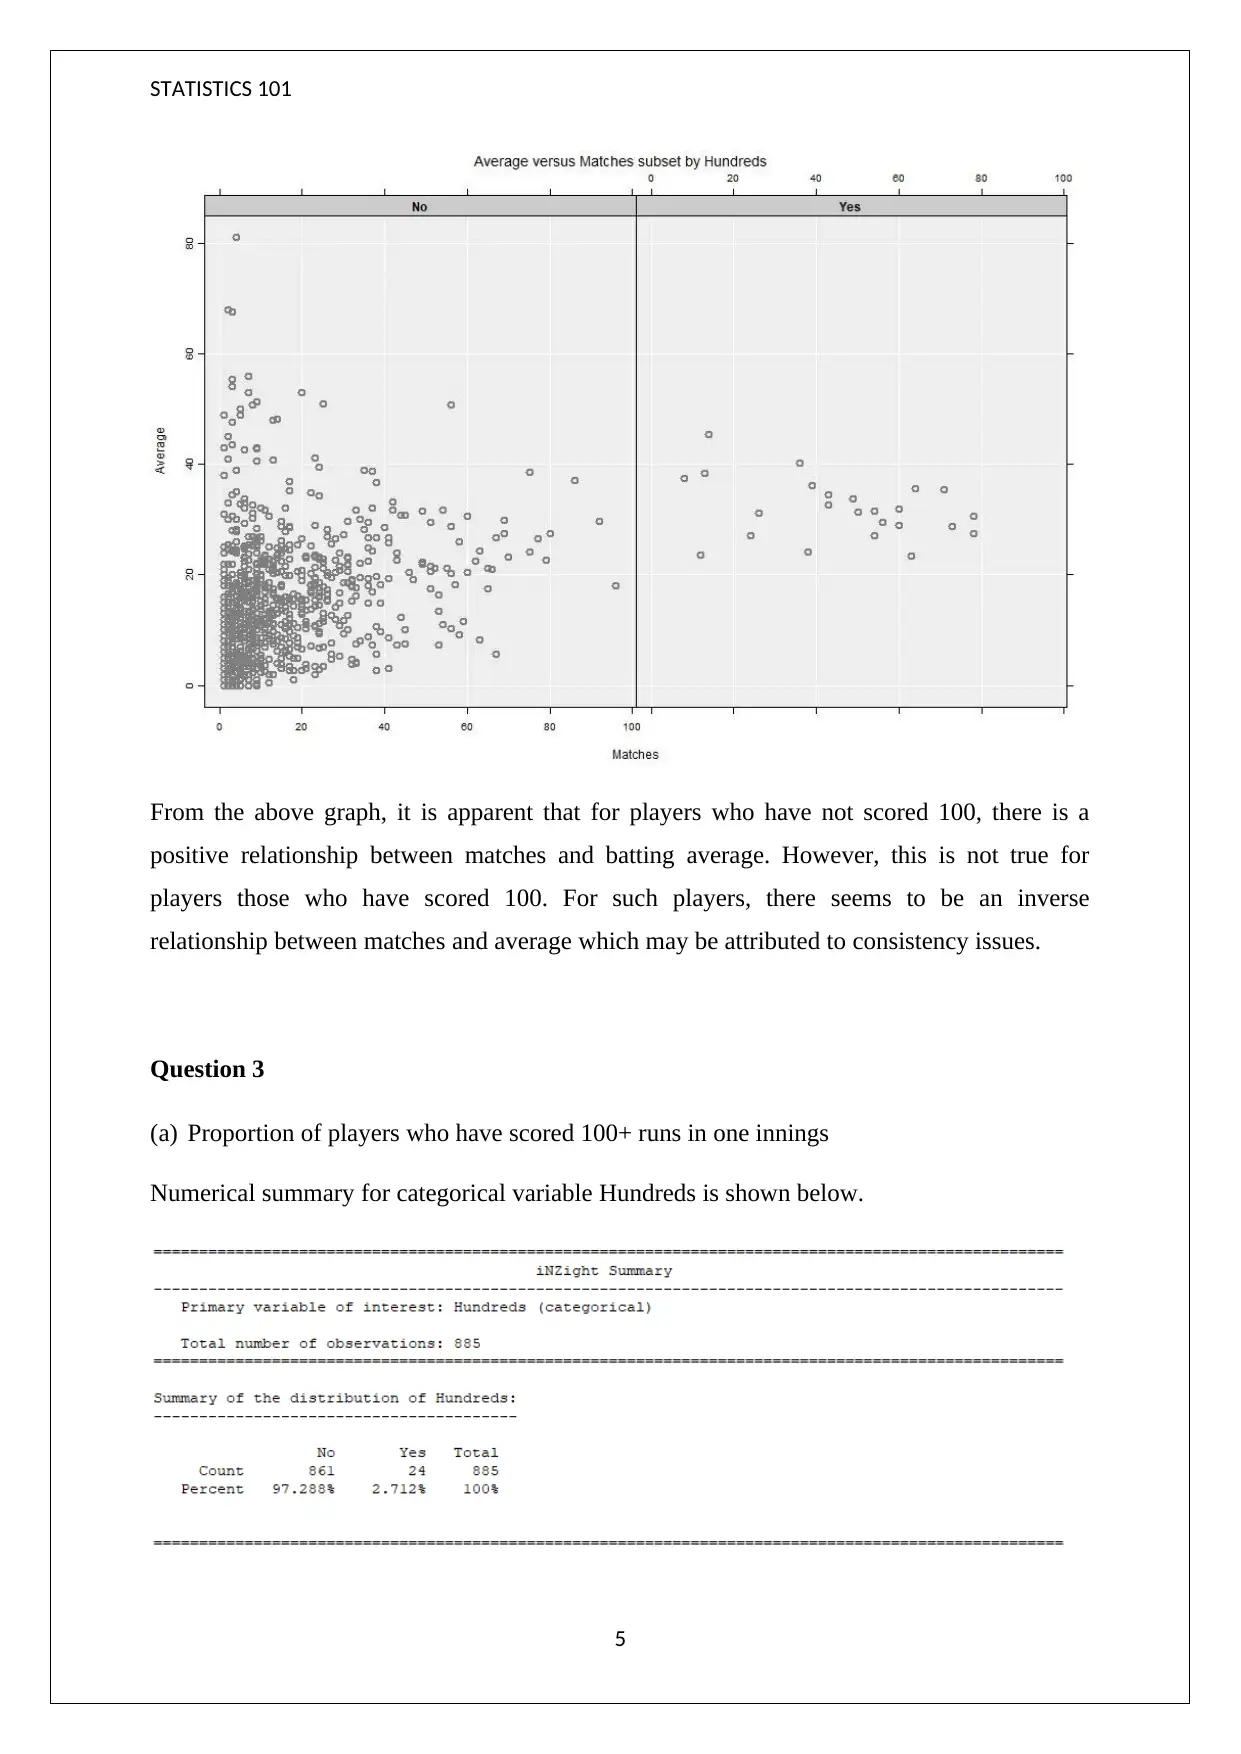
(d) The relationship between the all three variables (Average, Hundred and Matches) is
indicated below.
Two numeric variables: Average and Matches
Categorical variable: Hundreds
4
Matches: Number of matches played
The above scatter plot indicates a positive relationship between matches and average. This
may be attributed to the fact that the performance of players improve with experience. Also,
players who tend to score runs in their initial matches may continue playing. However, the
strength of the relationship does not seem to be strong considering that the scatter points are
quite scattered.
(d) The relationship between the all three variables (Average, Hundred and Matches) is
indicated below.
Two numeric variables: Average and Matches
Categorical variable: Hundreds
4
Secure Best Marks with AI Grader
Need help grading? Try our AI Grader for instant feedback on your assignments.
STATISTICS 101
From the above graph, it is apparent that for players who have not scored 100, there is a
positive relationship between matches and batting average. However, this is not true for
players those who have scored 100. For such players, there seems to be an inverse
relationship between matches and average which may be attributed to consistency issues.
Question 3
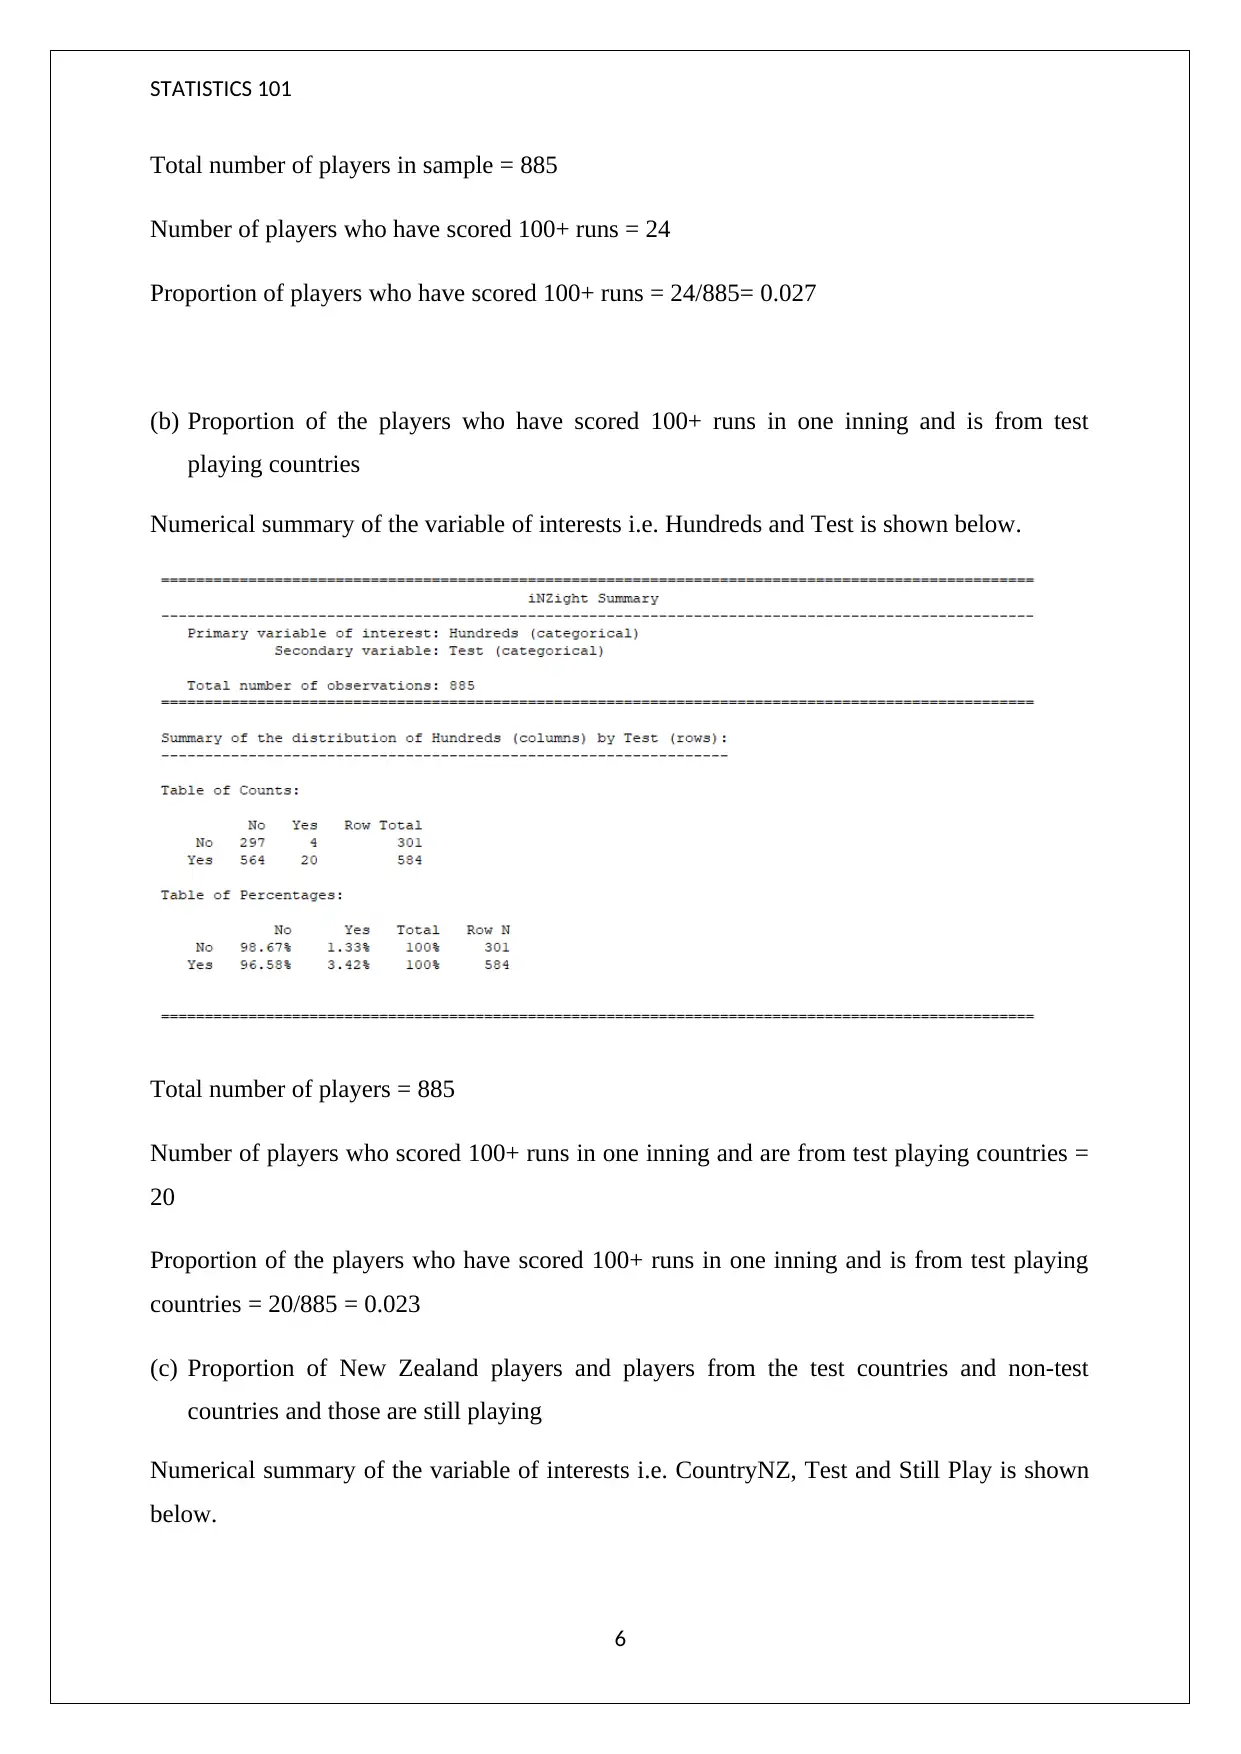
(a) Proportion of players who have scored 100+ runs in one innings
Numerical summary for categorical variable Hundreds is shown below.
5
From the above graph, it is apparent that for players who have not scored 100, there is a
positive relationship between matches and batting average. However, this is not true for
players those who have scored 100. For such players, there seems to be an inverse
relationship between matches and average which may be attributed to consistency issues.
Question 3
(a) Proportion of players who have scored 100+ runs in one innings
Numerical summary for categorical variable Hundreds is shown below.
5
STATISTICS 101
Total number of players in sample = 885
Number of players who have scored 100+ runs = 24
Proportion of players who have scored 100+ runs = 24/885= 0.027
(b) Proportion of the players who have scored 100+ runs in one inning and is from test
playing countries
Numerical summary of the variable of interests i.e. Hundreds and Test is shown below.
Total number of players = 885
Number of players who scored 100+ runs in one inning and are from test playing countries =
20
Proportion of the players who have scored 100+ runs in one inning and is from test playing
countries = 20/885 = 0.023
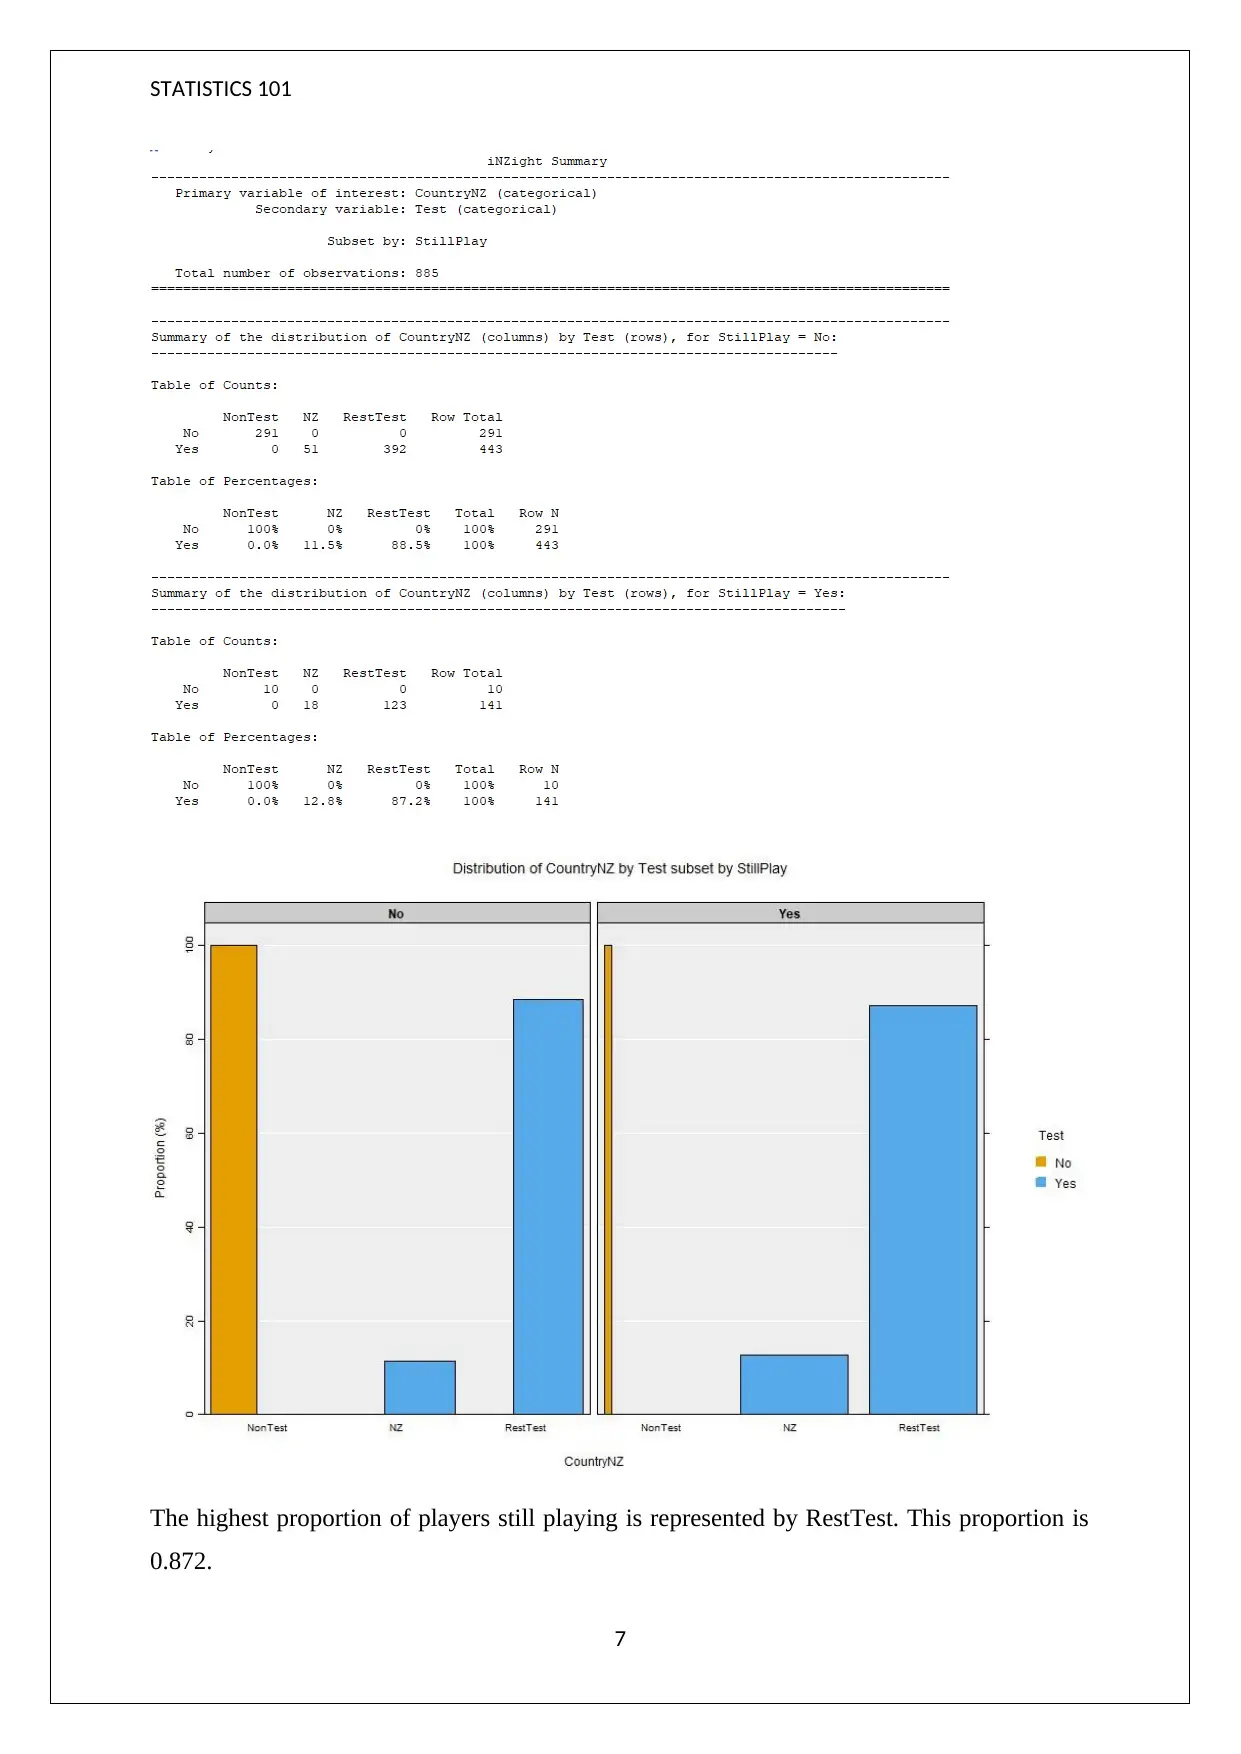
(c) Proportion of New Zealand players and players from the test countries and non-test
countries and those are still playing
Numerical summary of the variable of interests i.e. CountryNZ, Test and Still Play is shown
below.
6
Total number of players in sample = 885
Number of players who have scored 100+ runs = 24
Proportion of players who have scored 100+ runs = 24/885= 0.027
(b) Proportion of the players who have scored 100+ runs in one inning and is from test
playing countries
Numerical summary of the variable of interests i.e. Hundreds and Test is shown below.
Total number of players = 885
Number of players who scored 100+ runs in one inning and are from test playing countries =
20
Proportion of the players who have scored 100+ runs in one inning and is from test playing
countries = 20/885 = 0.023
(c) Proportion of New Zealand players and players from the test countries and non-test
countries and those are still playing
Numerical summary of the variable of interests i.e. CountryNZ, Test and Still Play is shown
below.
6
STATISTICS 101
The highest proportion of players still playing is represented by RestTest. This proportion is
0.872.
7
The highest proportion of players still playing is represented by RestTest. This proportion is
0.872.
7
Paraphrase This Document
Need a fresh take? Get an instant paraphrase of this document with our AI Paraphraser
STATISTICS 101
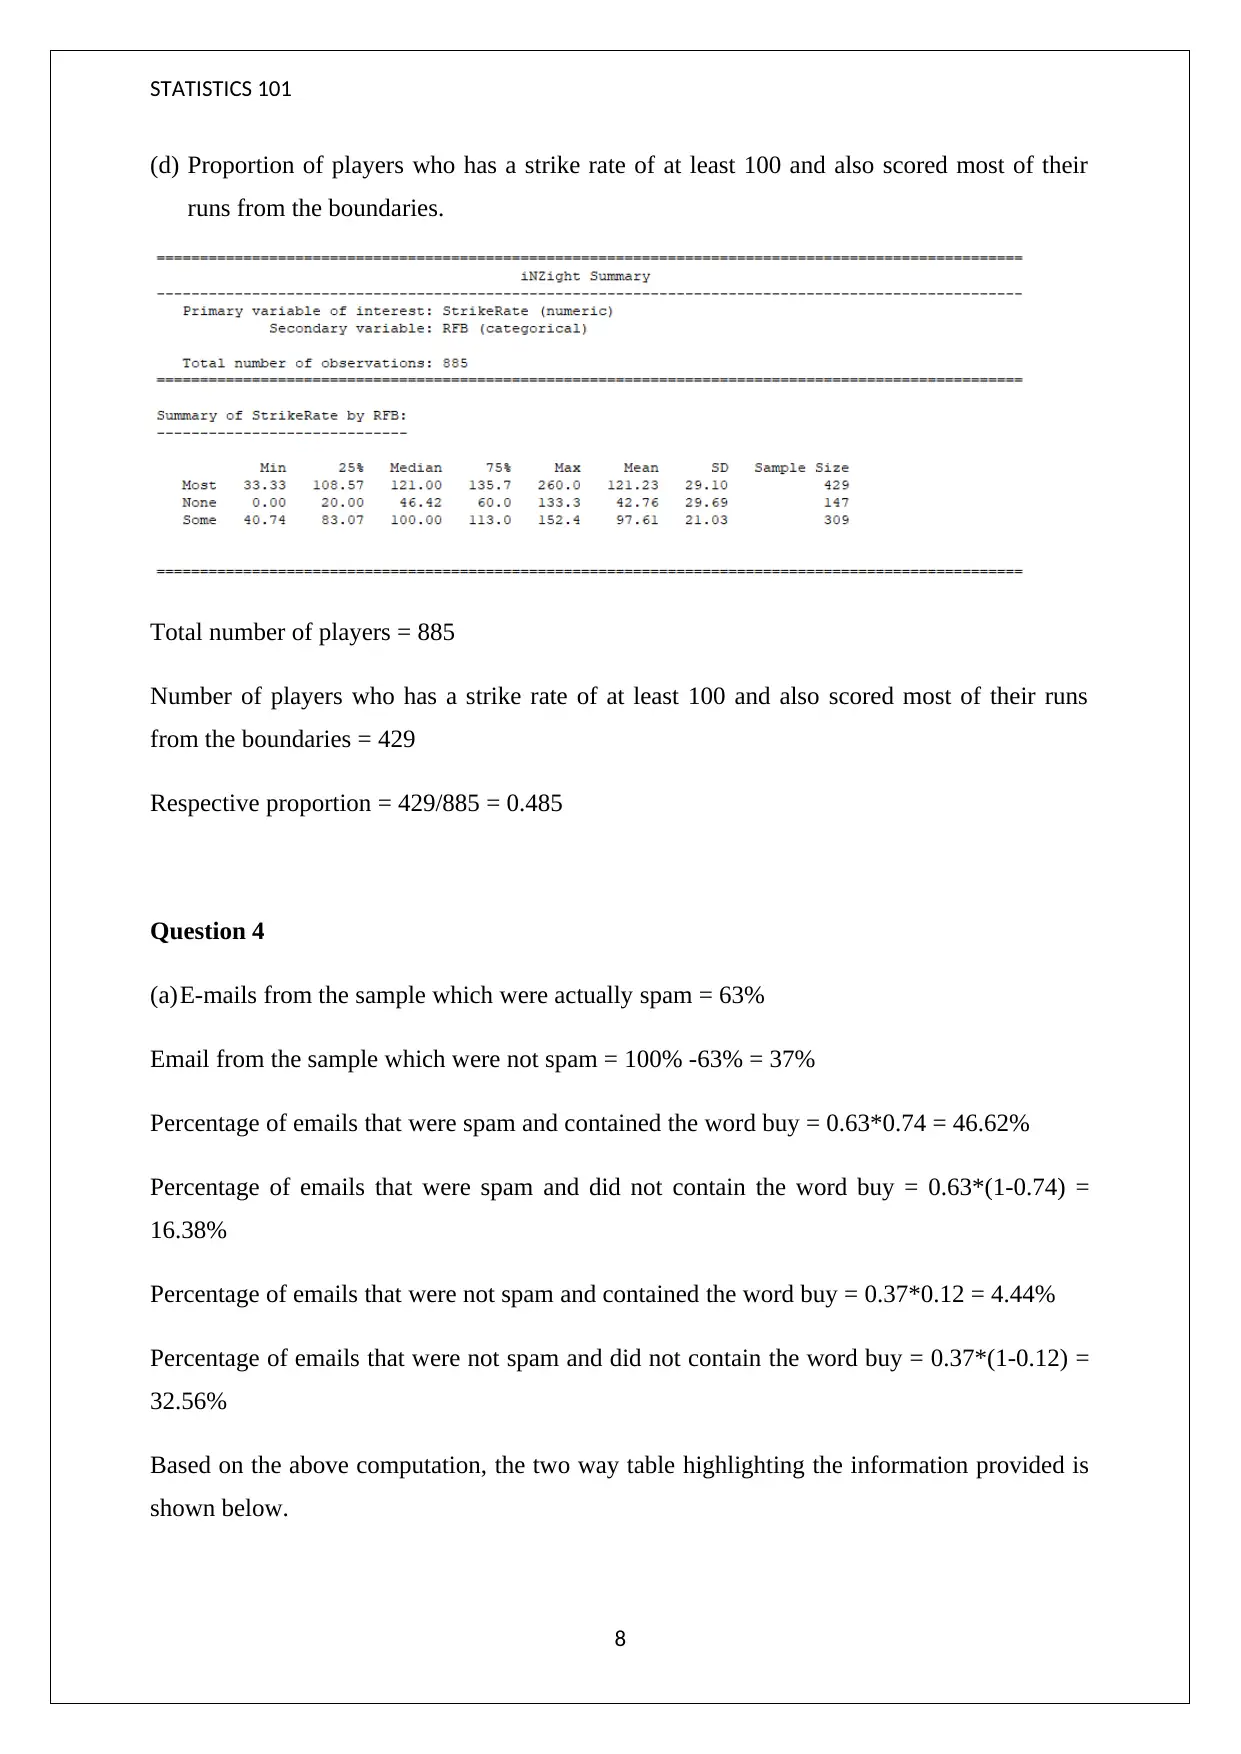
(d) Proportion of players who has a strike rate of at least 100 and also scored most of their
runs from the boundaries.
Total number of players = 885
Number of players who has a strike rate of at least 100 and also scored most of their runs
from the boundaries = 429
Respective proportion = 429/885 = 0.485
Question 4
(a)E-mails from the sample which were actually spam = 63%
Email from the sample which were not spam = 100% -63% = 37%
Percentage of emails that were spam and contained the word buy = 0.63*0.74 = 46.62%
Percentage of emails that were spam and did not contain the word buy = 0.63*(1-0.74) =
16.38%
Percentage of emails that were not spam and contained the word buy = 0.37*0.12 = 4.44%
Percentage of emails that were not spam and did not contain the word buy = 0.37*(1-0.12) =
32.56%
Based on the above computation, the two way table highlighting the information provided is
shown below.
8
(d) Proportion of players who has a strike rate of at least 100 and also scored most of their
runs from the boundaries.
Total number of players = 885
Number of players who has a strike rate of at least 100 and also scored most of their runs
from the boundaries = 429
Respective proportion = 429/885 = 0.485
Question 4
(a)E-mails from the sample which were actually spam = 63%
Email from the sample which were not spam = 100% -63% = 37%
Percentage of emails that were spam and contained the word buy = 0.63*0.74 = 46.62%
Percentage of emails that were spam and did not contain the word buy = 0.63*(1-0.74) =
16.38%
Percentage of emails that were not spam and contained the word buy = 0.37*0.12 = 4.44%
Percentage of emails that were not spam and did not contain the word buy = 0.37*(1-0.12) =
32.56%
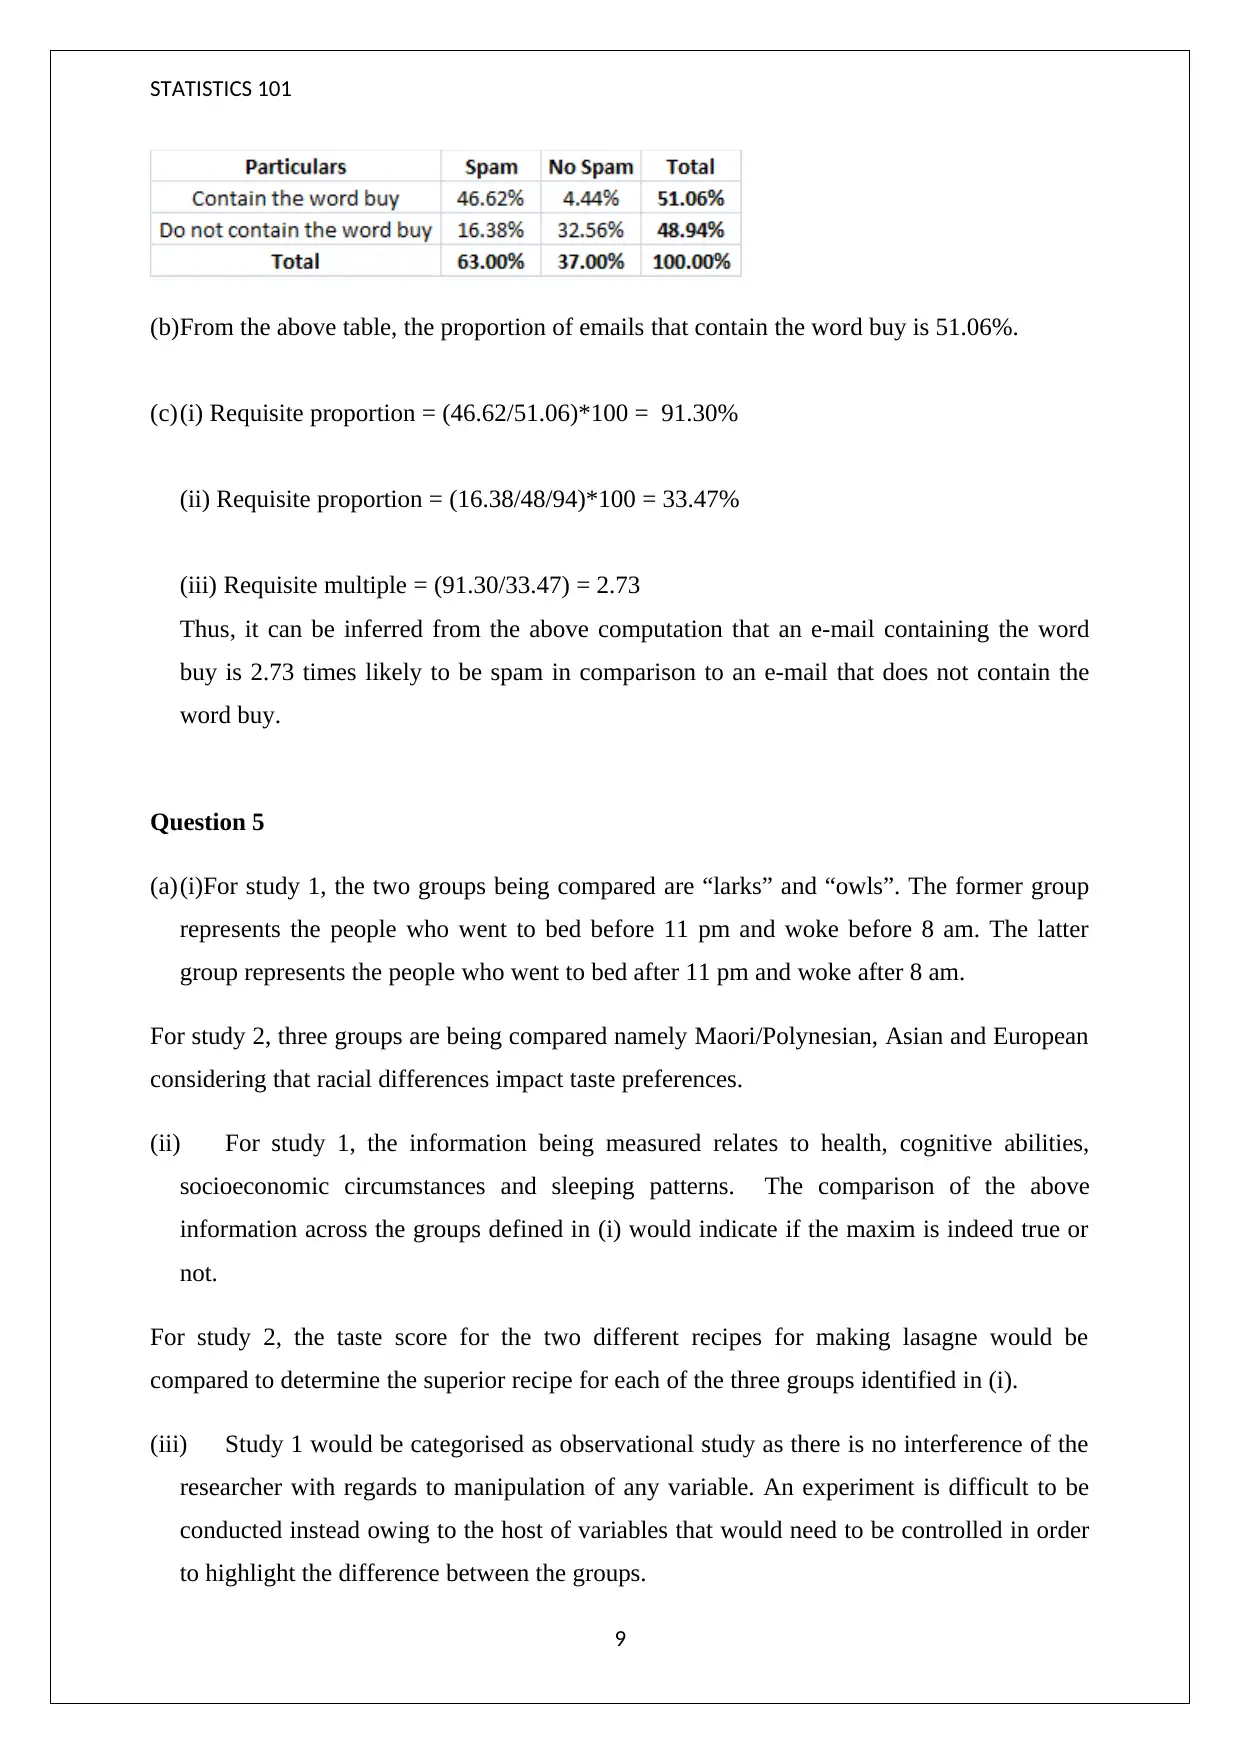
Based on the above computation, the two way table highlighting the information provided is
shown below.
8
STATISTICS 101
(b)From the above table, the proportion of emails that contain the word buy is 51.06%.
(c)(i) Requisite proportion = (46.62/51.06)*100 = 91.30%
(ii) Requisite proportion = (16.38/48/94)*100 = 33.47%
(iii) Requisite multiple = (91.30/33.47) = 2.73
Thus, it can be inferred from the above computation that an e-mail containing the word
buy is 2.73 times likely to be spam in comparison to an e-mail that does not contain the
word buy.
Question 5
(a)(i)For study 1, the two groups being compared are “larks” and “owls”. The former group
represents the people who went to bed before 11 pm and woke before 8 am. The latter
group represents the people who went to bed after 11 pm and woke after 8 am.
For study 2, three groups are being compared namely Maori/Polynesian, Asian and European
considering that racial differences impact taste preferences.
(ii) For study 1, the information being measured relates to health, cognitive abilities,
socioeconomic circumstances and sleeping patterns. The comparison of the above
information across the groups defined in (i) would indicate if the maxim is indeed true or
not.
For study 2, the taste score for the two different recipes for making lasagne would be
compared to determine the superior recipe for each of the three groups identified in (i).
(iii) Study 1 would be categorised as observational study as there is no interference of the
researcher with regards to manipulation of any variable. An experiment is difficult to be
conducted instead owing to the host of variables that would need to be controlled in order
to highlight the difference between the groups.
9
STATISTICS 101
Study 2 would be categorised as experimental study. The fact that volunteers were selected
and then segregated based on the racial differences led me to this conclusion. Additional
supporting aspect was the random splitting of each of the groups into two sub-groups before
performing the tasting of the two recipes.
(b)(i) In the given context, “the direction of cause and effect” implies identification of cause
and effect. Typically in cause and effect relations, cause is the preceding activity which
triggers the effect. This is referred to as direction in cause and effect.
(ii) The study cannot establish the direction of cause and effect as it is not clear whether
sleeping pattern is the cause for the wealth effect or wealth is the cause for the sleeping
pattern effect. The study is not able to identify which factor is the cause and effect from the
two variables provided. Also, bi-directional relationship can be expected between the two
which leads to the confusion. This is because a good sleep would imply proper physical and
mental health resulting in wealth. Also, presence/absence of wealth could have impact on the
sleeping pattern.
(c)The conclusions from study 1 cannot be extended to the population in general. This is
because there are various extraneous factors such as difference in genetics, race, gender,
education level, social circle, education level of parents, location, eating habits, family
history which may impact the various outcomes that are being compared for the two
groups. It would be incorrect to conclude any differences between the two groups as the
effect of rising and sleeping times. The above factors need to be controlled across the two
groups for any conclusive evidence.
(d)Blocking has been used in Study 2 since each of the groups was divided into two sub-
groups randomly and assigned one recipe of lasagne. The difference in taste preferences
was being blocked through this so that the result is not impacted by their racial
background and taste preferences.
(e)Blinding should have used in Study 2 where the two dishes should have been assigned
randomly to the two groups instead of one group being given the first recipe while the
other group being given the second recipe. This would have led to reduced bias in the
outcome.
10
1 out of 10
Related Documents


Your All-in-One AI-Powered Toolkit for Academic Success.
+13062052269
info@desklib.com
Available 24*7 on WhatsApp / Email
![[object Object]](/_next/static/media/star-bottom.7253800d.svg)
Unlock your academic potential
© 2024 | Zucol Services PVT LTD | All rights reserved.