Statistics Assignment | Research Assignment
30 Pages2296 Words259 Views
Added on 2019-12-28
Statistics Assignment | Research Assignment
Added on 2019-12-28
ShareRelated Documents
STATISTICS AND RESEARCH
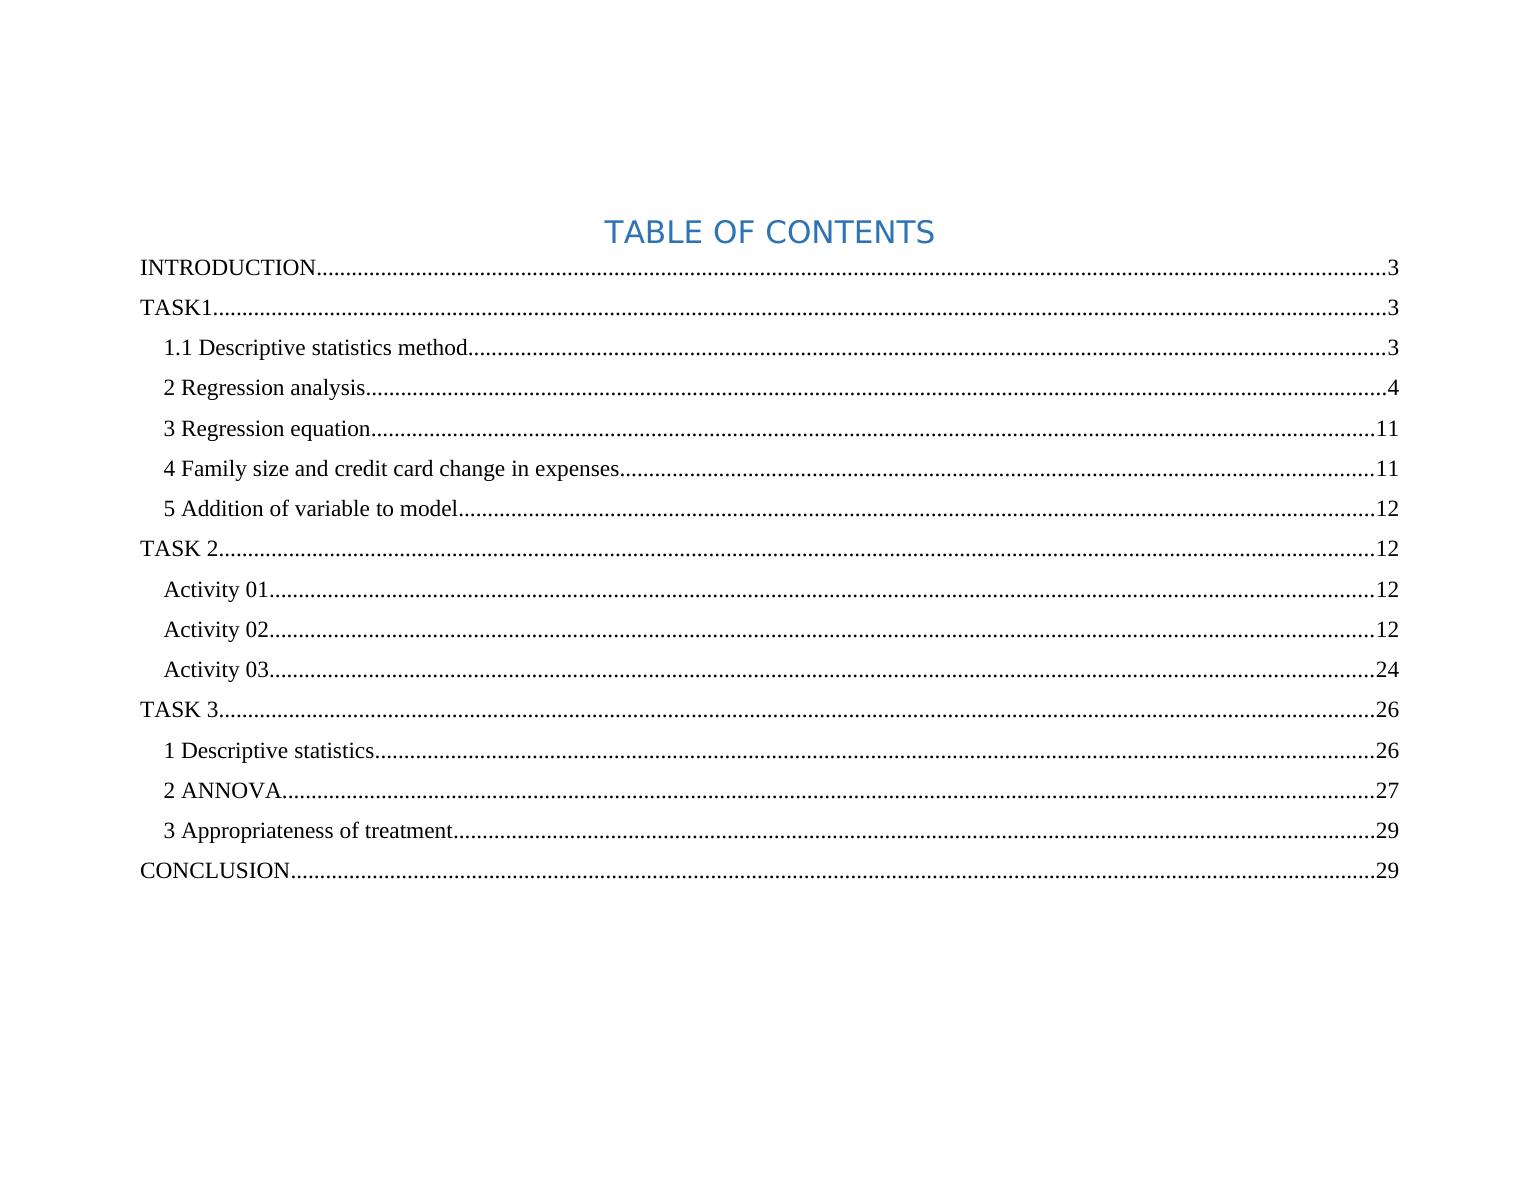
TABLE OF CONTENTSINTRODUCTION.......................................................................................................................................................................................3TASK1.........................................................................................................................................................................................................31.1 Descriptive statistics method.............................................................................................................................................................32 Regression analysis...............................................................................................................................................................................43 Regression equation............................................................................................................................................................................114 Family size and credit card change in expenses.................................................................................................................................115 Addition of variable to model.............................................................................................................................................................12TASK 2......................................................................................................................................................................................................12Activity 01.............................................................................................................................................................................................12Activity 02.............................................................................................................................................................................................12Activity 03.............................................................................................................................................................................................24TASK 3......................................................................................................................................................................................................261 Descriptive statistics...........................................................................................................................................................................262 ANNOVA...........................................................................................................................................................................................273 Appropriateness of treatment..............................................................................................................................................................29CONCLUSION..........................................................................................................................................................................................29
INTRODUCTIONStatistics is the one of the main domain that is used to solve the business problems. In the current report, descriptive statisticstools are applied on data set and results are interpreted in proper manner. Apart from this regression analysis tools are applied on dataset and cause as well as effect relationship is identified among the variables. At end of the report conclusion is prepared. In this wayentire research work is carried out in the present research study.TASK11.1 Descriptive statistics method Income ($1000s)Household SizeAmount Charged ($)Mean43.48Mean3.42Mean3963.86Standard Error2.057786Standard Error0.245930138Standard Error132.023387Median42Median3Median4090Mode54Mode2Mode3890Standard Deviation14.55074Standard Deviation1.738988681Standard Deviation933.5463219Sample Variance211.7241Sample Variance3.024081633Sample Variance871508.7351Kurtosis-1.24772Kurtosis-0.722808552Kurtosis-0.742482171Skewness0.095856Skewness0.527895977Skewness-0.128860064Range46Range6Range3814Minimum21Minimum1Minimum1864Maximum67Maximum7Maximum5678Sum2174Sum171Sum198193Count50Count50Count50Interpretation In the above table descriptive analysis of three variables is done namely income, household size and amount charged. There ishuge difference in the mean value of income level, household size and amount charged. On average basis people that are taken as
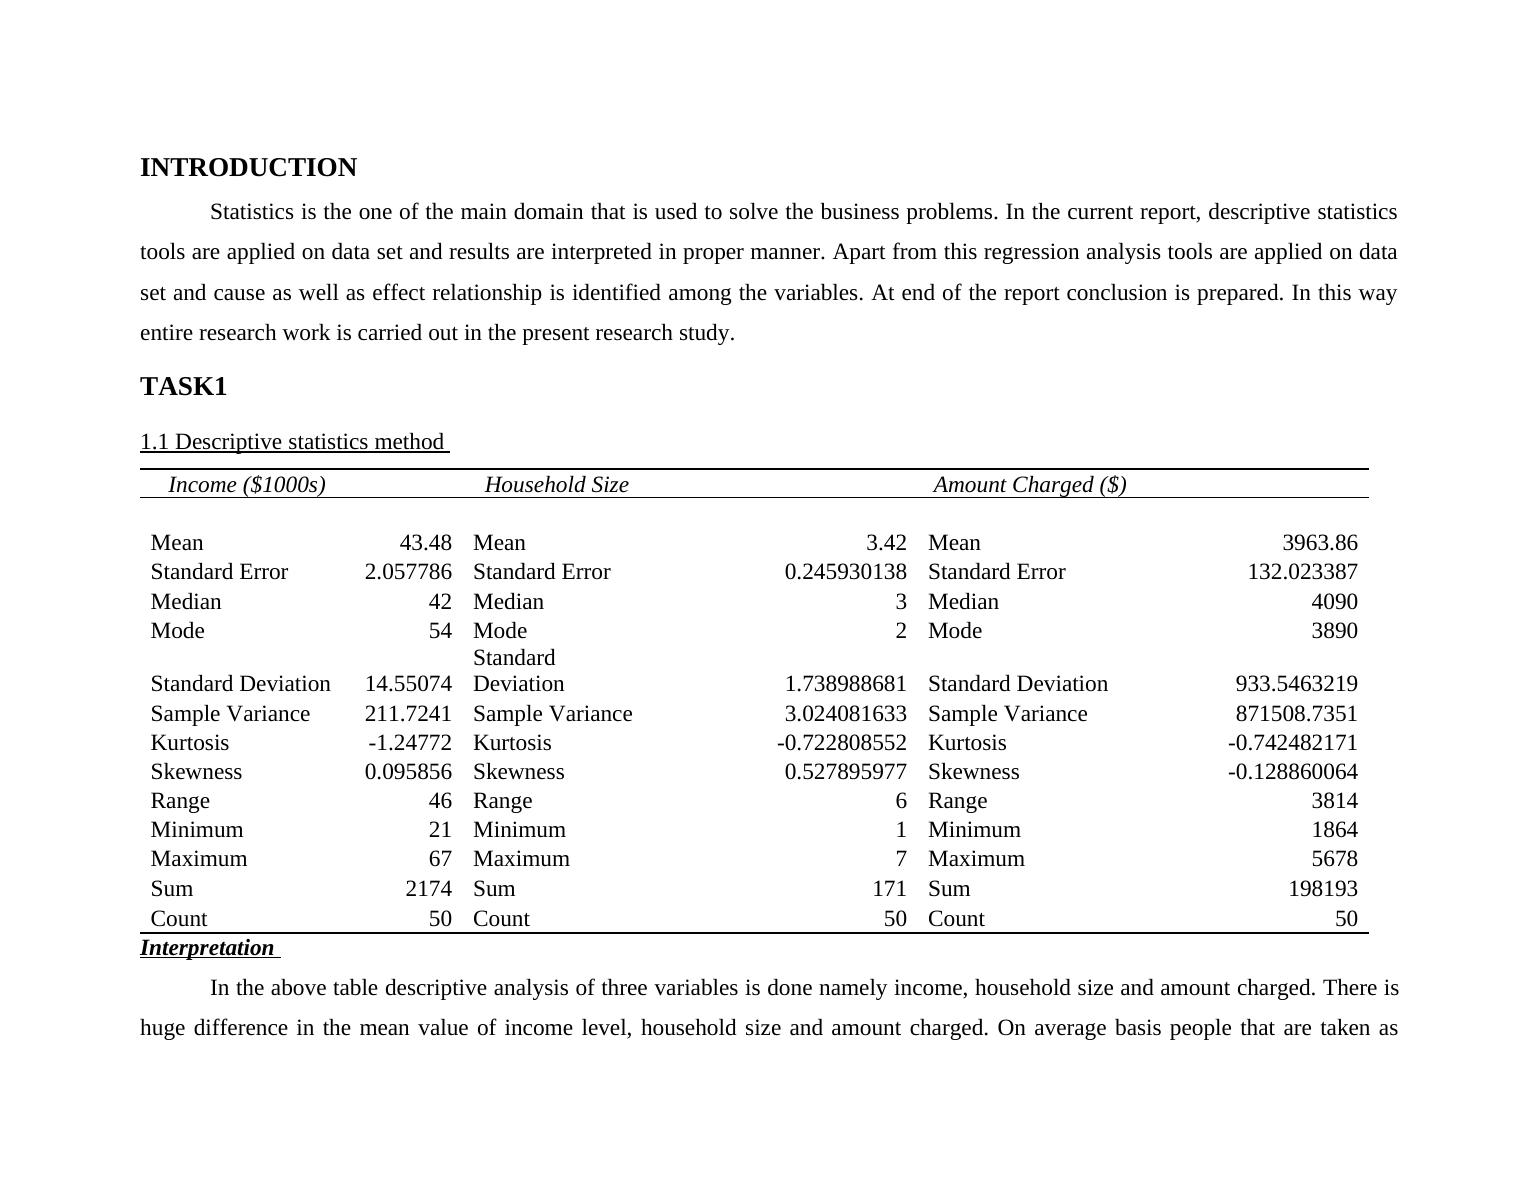
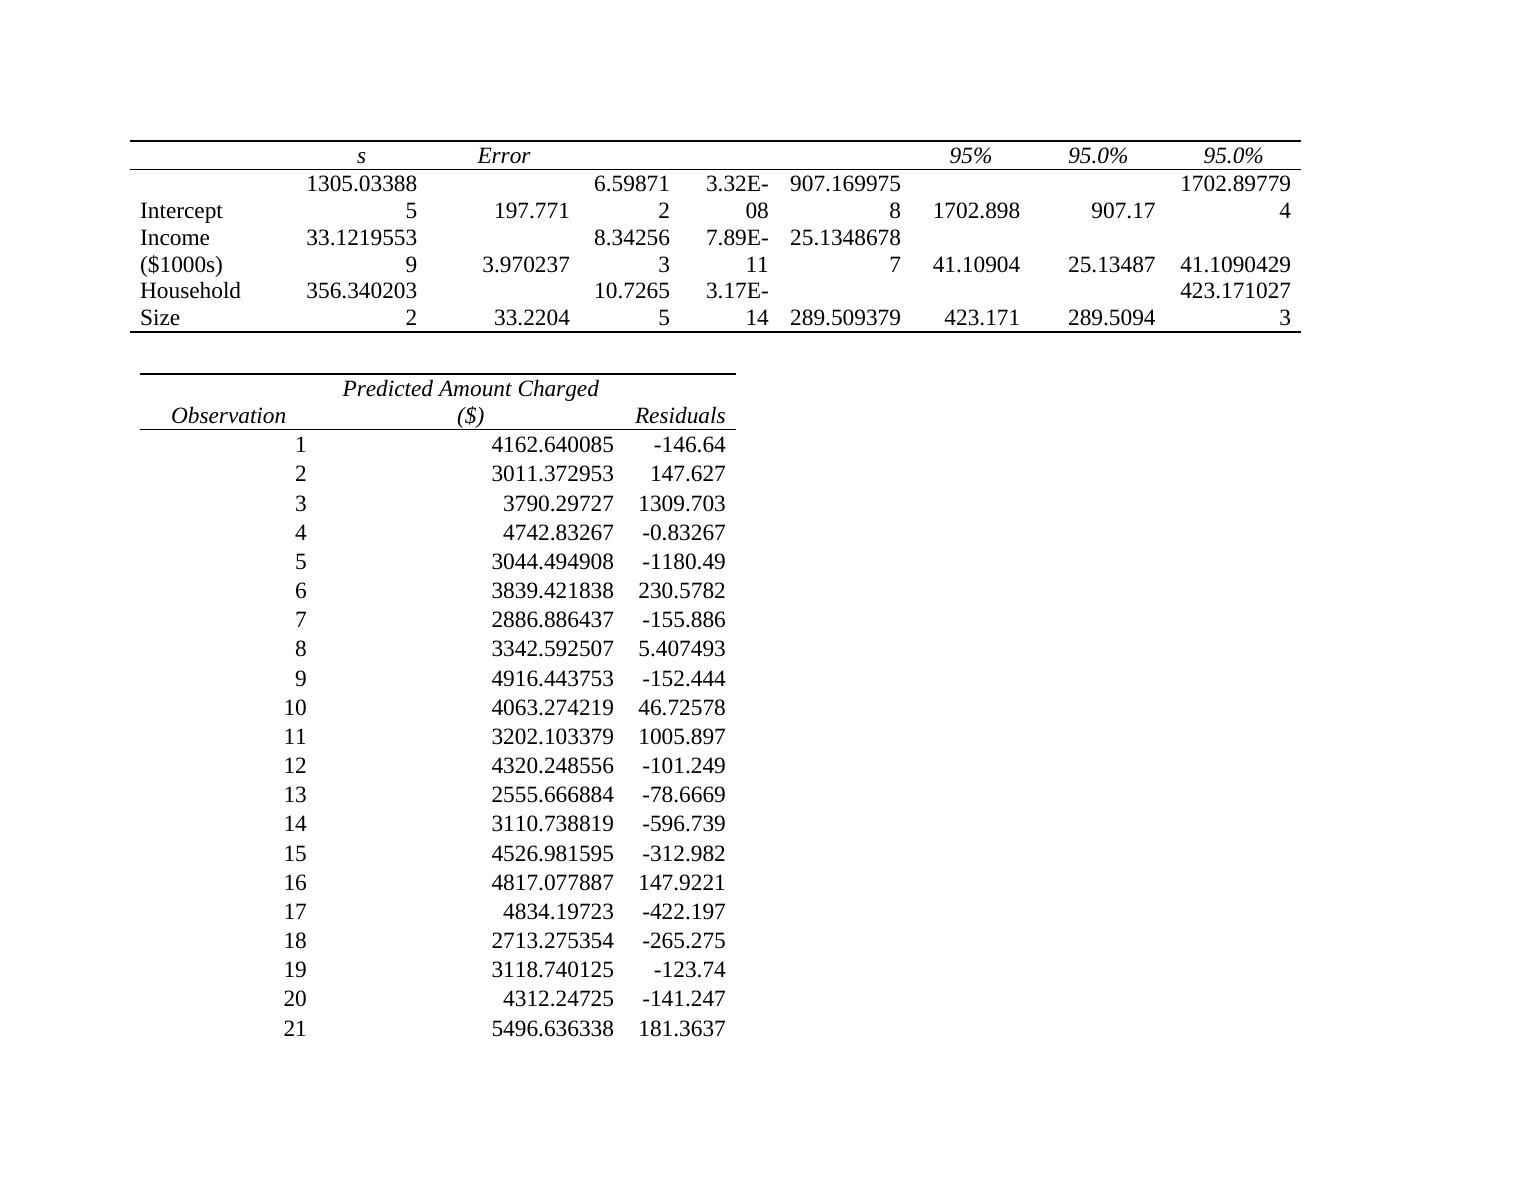
respondent in the present research earn $43000 with average size of family which is 3.42 which means that on average basis there arethree to four members in each family. Amount charged is $3963 for credit card for each family. In order to measure the frequency ofthe occurrence of values in case of income variable mode value of 54 is observed followed by mode value of 2 in case of householdsize. In case of customer amount charged mode value is $3890. It can be said that in case of income there are varied number ofrespondents that are earning amount of $54000. Apart from this, mode value in case of household size is 2 which means that there areseveral families in which there are 2 members. Results are clearly reflecting that mode value is $3890 which means that there arenumber of respondents which charge amount of $3890. Results are clearly reflecting that with small percentage change in income bigvariation comes in amount charged. It can be said that amount charged to some extent is dependent on the income level of individuals.When income level of people increased then at same time amount charged changed to some extent.2 Regression analysisH0: Between the variables income level, household size and amount charged mean difference does not exist.H1: Between the variables income level, household size and amount charged mean difference does exist.Regression StatisticsMultiple R0.908501824R Square0.825375565Adjusted R Square0.817944738Standard Error398.3249315Observations50dfSSMSFSignificance FRegression23524677917623389111.07451.54692E-18Residual477457149158662.8Total4942703928CoefficientStandardt StatP-valueLower 95%UpperLowerUpper
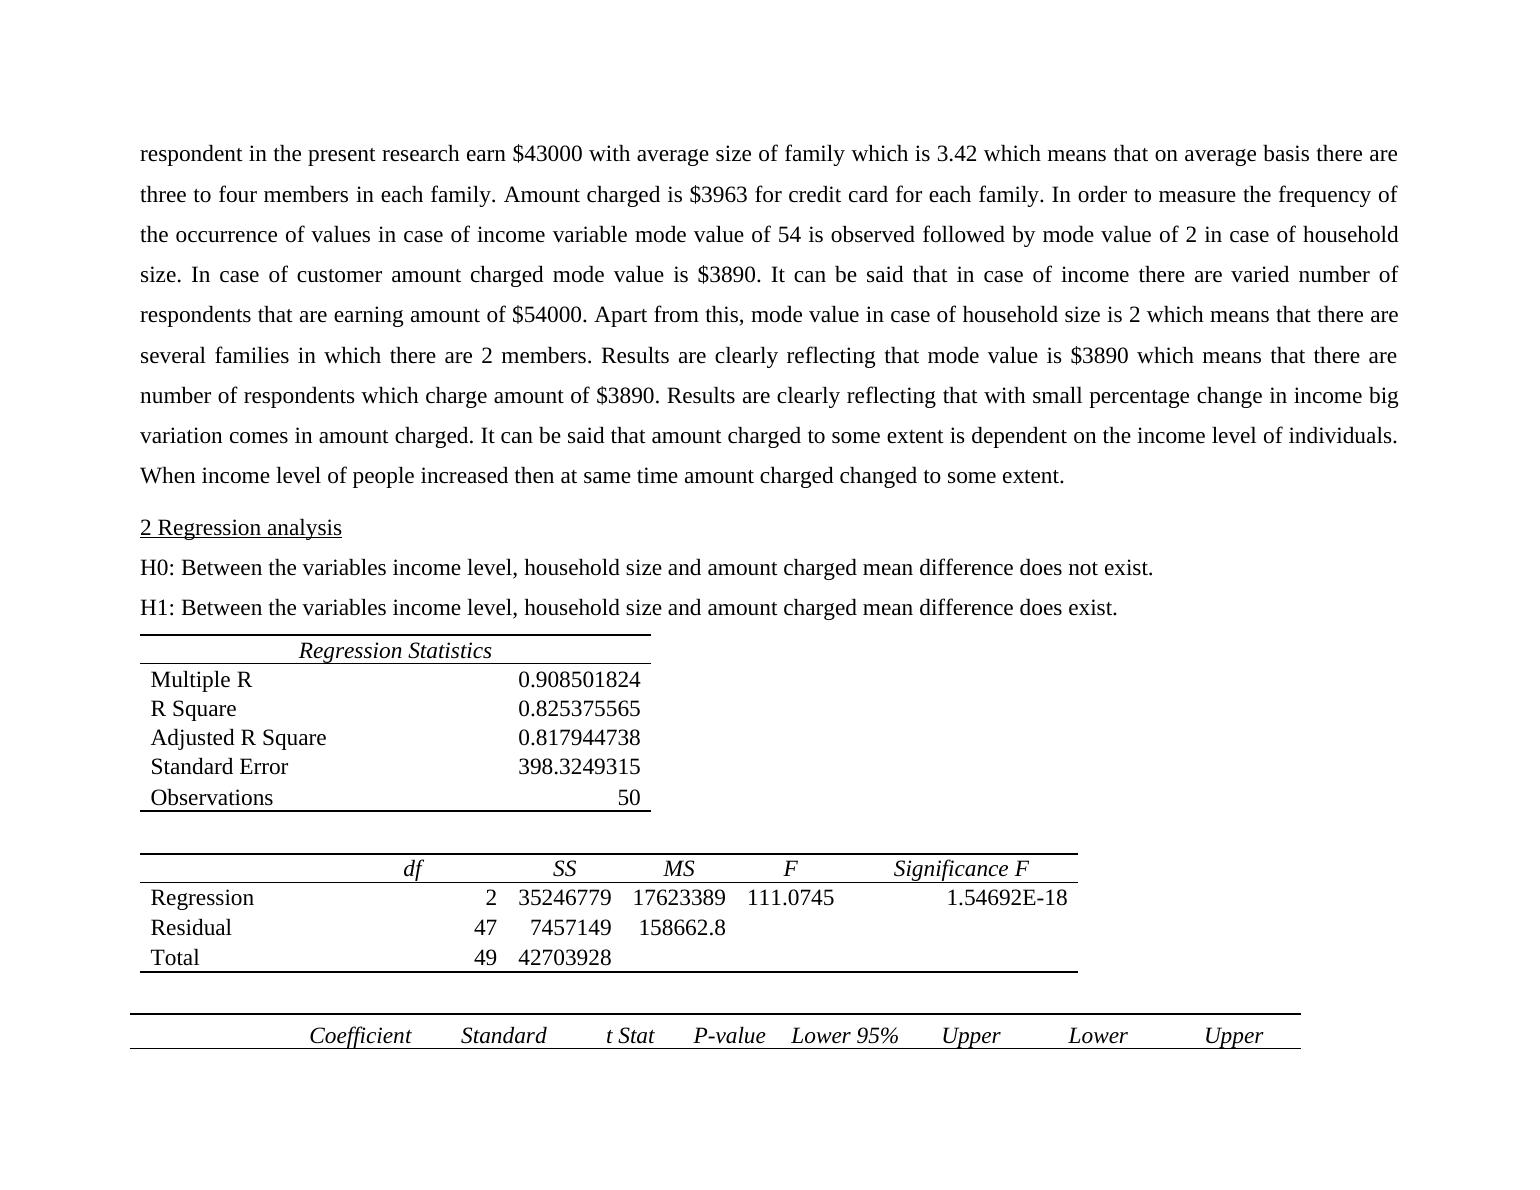
sError95%95.0%95.0%Intercept1305.033885197.7716.5987123.32E-08907.16997581702.898907.171702.897794Income ($1000s)33.121955393.9702378.3425637.89E-1125.1348678741.1090425.1348741.1090429Household Size356.340203233.220410.726553.17E-14289.509379423.171289.5094423.1710273ObservationPredicted Amount Charged($)Residuals14162.640085-146.6423011.372953147.62733790.297271309.70344742.83267-0.8326753044.494908-1180.4963839.421838230.578272886.886437-155.88683342.5925075.40749394916.443753-152.444104063.27421946.72578113202.1033791005.897124320.248556-101.249132555.666884-78.6669143110.738819-596.739154526.981595-312.982164817.077887147.9221174834.19723-422.197182713.275354-265.275193118.740125-123.74204312.24725-141.247215496.636338181.3637
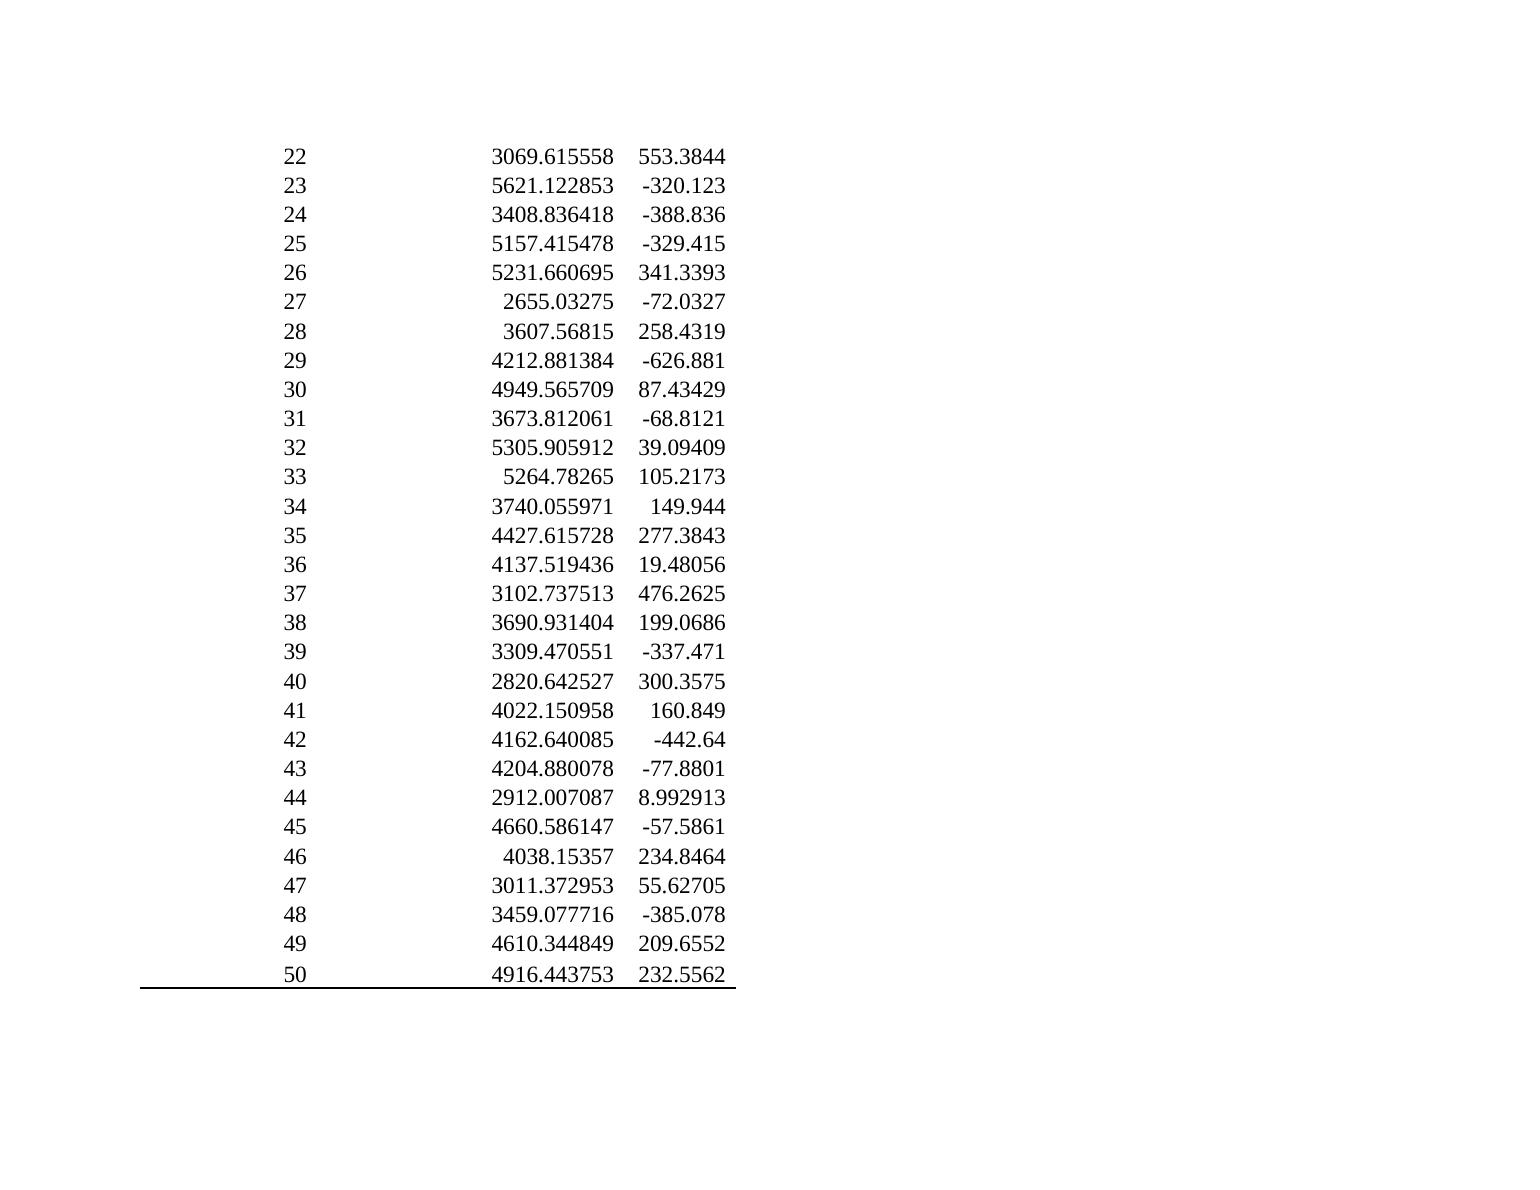
223069.615558553.3844235621.122853-320.123243408.836418-388.836255157.415478-329.415265231.660695341.3393272655.03275-72.0327283607.56815258.4319294212.881384-626.881304949.56570987.43429313673.812061-68.8121325305.90591239.09409335264.78265105.2173343740.055971149.944354427.615728277.3843364137.51943619.48056373102.737513476.2625383690.931404199.0686393309.470551-337.471402820.642527300.3575414022.150958160.849424162.640085-442.64434204.880078-77.8801442912.0070878.992913454660.586147-57.5861464038.15357234.8464473011.37295355.62705483459.077716-385.078494610.344849209.6552504916.443753232.5562
End of preview
Want to access all the pages? Upload your documents or become a member.
Related Documents
Statistics for Business Decision Assignmentlg...
|23
|3601
|428
HI6007 Assignment on Statistics and Research Method for Businesslg...
|17
|2905
|237
Regression Analysis for Margin Predictionlg...
|14
|1990
|464
Microsoft Excel Data Analysislg...
|7
|1051
|16
Data Analysis for Business Decisions Essaylg...
|8
|1401
|228
Statistics for Business Phuc Thang Nguyenlg...
|7
|1646
|371