Statistics for Management INTRODUCTION 2 MAIN BODY2 TASK 12 B. Analysis and evaluatio
27 Pages3973 Words312 Views
Added on 2021-02-19
About This Document
|t-Test: Two-Sample Assuming Equal ||| |Variances ||| |Men earnings in| |public sector |public sector |public sector | |Mean |32276.625|26933.25 | |Variance|1449962.26785714 |975692.5 | |Observations |8 |8 |1|| |Pooled Variance |1212827.38392857 || |Hypothesized Mean Difference |0 || |df|14 || |t
Statistics for Management INTRODUCTION 2 MAIN BODY2 TASK 12 B. Analysis and evaluatio
Added on 2021-02-19
ShareRelated Documents
Statistics for Management

Table of Contents
INTRODUCTION...........................................................................................................................2
MAIN BODY...................................................................................................................................2
TASK 1............................................................................................................................................2
A. Determine how earnings of men in public sector is different from earnings of women in
public sector by using hypothesis................................................................................................2
B. Determine how earnings of men in private sector is different from earnings of women in
private sector by using hypothesis...............................................................................................3
C. Earning time chart of each group............................................................................................4
D. Evaluating the annual growth rate in the context of earnings of given four group.................6
TASK 2............................................................................................................................................8
A) Analysis and evaluation of hourly pay rates in different UK regions....................................8
B) Earnings comparison in between two regions......................................................................12
TASK 3 .........................................................................................................................................12
Section A....................................................................................................................................12
Section B....................................................................................................................................13
TASK 4 .........................................................................................................................................13
4.1...............................................................................................................................................13
1. Bar chart.................................................................................................................................13
2. Pie chart.................................................................................................................................16
....................................................................................................................................................18
4.2 Relationship between the number of bedrooms and the house price of bedrooms in all of
the three streets..........................................................................................................................19
CONCLUSION..............................................................................................................................25
REFERENCES..............................................................................................................................26
1
INTRODUCTION
Statistics is a term which is related with the process of data collection, analysis as well as
interpretation so as to ascertain some meaningful information from it. With the help of
mathematical as well as statistical tools, data gathered can be evaluated in effective manner.
Also, by making use of different types of graphs, charts presentation of numerical data provides
better understanding to end users and assists in their decision making process. The present report
will define about economic data with the help of time chart. Furthermore, with the help of
comparison among hourly earnings of two different regions, statistical meaning will be derive.
Also, by applying statistical methods such as Economic order quantity, normal distribution
curves etc. explanation related to different section will be done. At last, the report will made
emphasis on making presentation of given data set in both the bar as well as pie chart form.
MAIN BODY
TASK 1
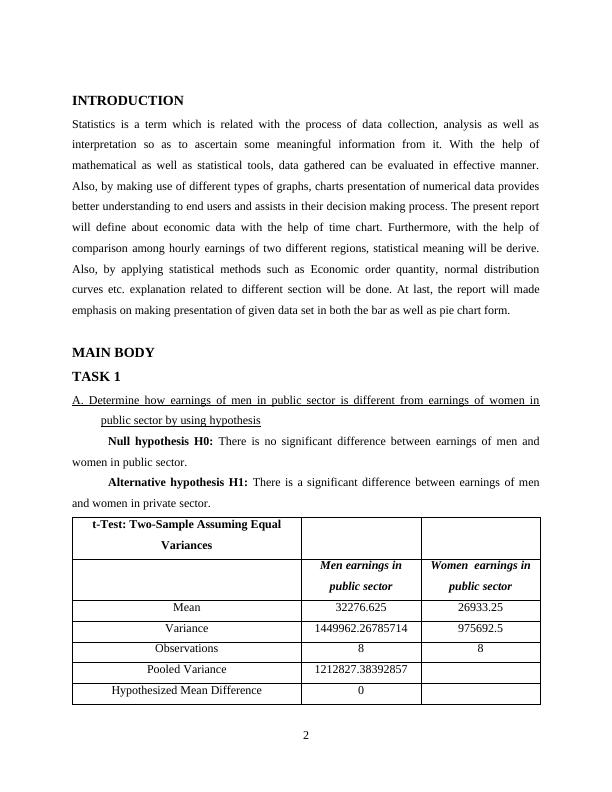
A. Determine how earnings of men in public sector is different from earnings of women in
public sector by using hypothesis
Null hypothesis H0: There is no significant difference between earnings of men and
women in public sector.
Alternative hypothesis H1: There is a significant difference between earnings of men
and women in private sector.
t-Test: Two-Sample Assuming Equal
Variances
Men earnings in
public sector
Women earnings in
public sector
Mean 32276.625 26933.25
Variance 1449962.26785714 975692.5
Observations 8 8
Pooled Variance 1212827.38392857
Hypothesized Mean Difference 0
2
Statistics is a term which is related with the process of data collection, analysis as well as
interpretation so as to ascertain some meaningful information from it. With the help of
mathematical as well as statistical tools, data gathered can be evaluated in effective manner.
Also, by making use of different types of graphs, charts presentation of numerical data provides
better understanding to end users and assists in their decision making process. The present report
will define about economic data with the help of time chart. Furthermore, with the help of
comparison among hourly earnings of two different regions, statistical meaning will be derive.
Also, by applying statistical methods such as Economic order quantity, normal distribution
curves etc. explanation related to different section will be done. At last, the report will made
emphasis on making presentation of given data set in both the bar as well as pie chart form.
MAIN BODY
TASK 1
A. Determine how earnings of men in public sector is different from earnings of women in
public sector by using hypothesis
Null hypothesis H0: There is no significant difference between earnings of men and
women in public sector.
Alternative hypothesis H1: There is a significant difference between earnings of men
and women in private sector.
t-Test: Two-Sample Assuming Equal
Variances
Men earnings in
public sector
Women earnings in
public sector
Mean 32276.625 26933.25
Variance 1449962.26785714 975692.5
Observations 8 8
Pooled Variance 1212827.38392857
Hypothesized Mean Difference 0
2
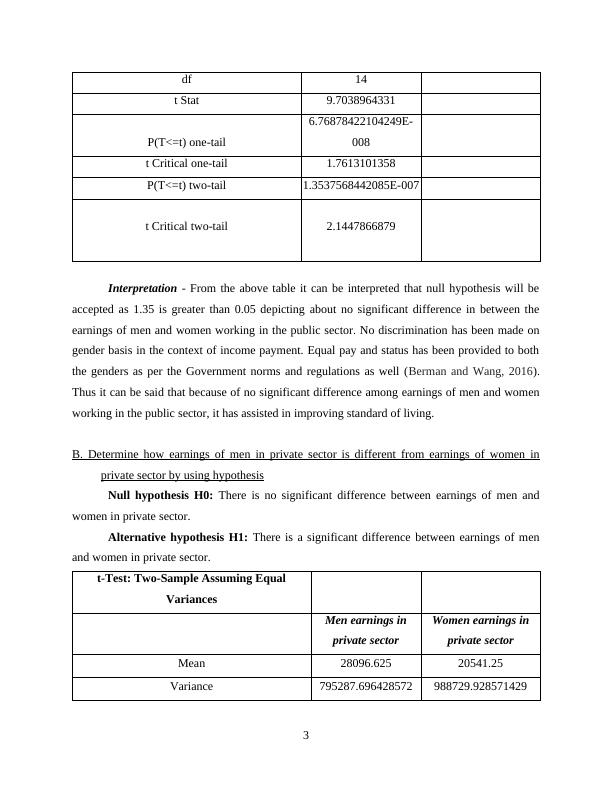
df 14
t Stat 9.7038964331
P(T<=t) one-tail
6.76878422104249E-
008
t Critical one-tail 1.7613101358
P(T<=t) two-tail 1.3537568442085E-007
t Critical two-tail 2.1447866879
Interpretation - From the above table it can be interpreted that null hypothesis will be
accepted as 1.35 is greater than 0.05 depicting about no significant difference in between the
earnings of men and women working in the public sector. No discrimination has been made on
gender basis in the context of income payment. Equal pay and status has been provided to both
the genders as per the Government norms and regulations as well (Berman and Wang, 2016).
Thus it can be said that because of no significant difference among earnings of men and women
working in the public sector, it has assisted in improving standard of living.
B. Determine how earnings of men in private sector is different from earnings of women in
private sector by using hypothesis
Null hypothesis H0: There is no significant difference between earnings of men and
women in private sector.
Alternative hypothesis H1: There is a significant difference between earnings of men
and women in private sector.
t-Test: Two-Sample Assuming Equal
Variances
Men earnings in
private sector
Women earnings in
private sector
Mean 28096.625 20541.25
Variance 795287.696428572 988729.928571429
3
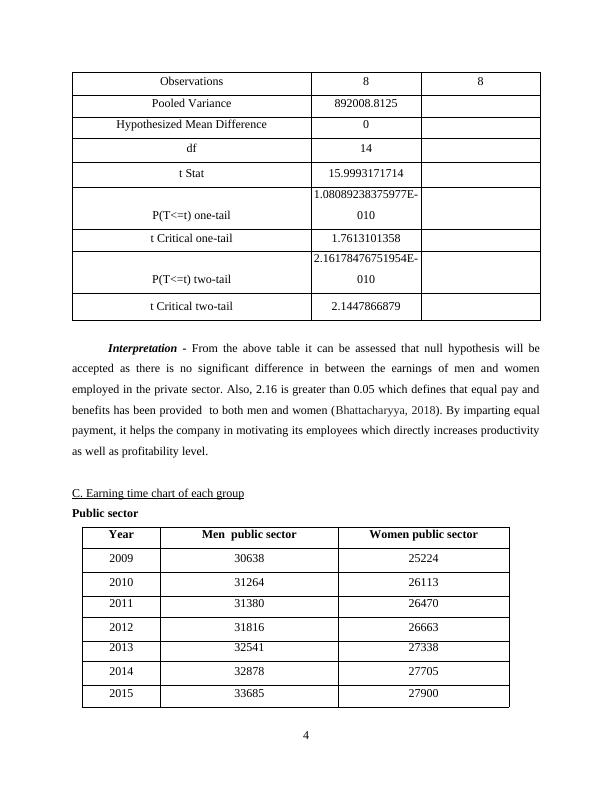
Observations 8 8
Pooled Variance 892008.8125
Hypothesized Mean Difference 0
df 14
t Stat 15.9993171714
P(T<=t) one-tail
1.08089238375977E-
010
t Critical one-tail 1.7613101358
P(T<=t) two-tail
2.16178476751954E-
010
t Critical two-tail 2.1447866879
Interpretation - From the above table it can be assessed that null hypothesis will be
accepted as there is no significant difference in between the earnings of men and women
employed in the private sector. Also, 2.16 is greater than 0.05 which defines that equal pay and
benefits has been provided to both men and women (Bhattacharyya, 2018). By imparting equal
payment, it helps the company in motivating its employees which directly increases productivity
as well as profitability level.
C. Earning time chart of each group
Public sector
Year Men public sector Women public sector
2009 30638 25224
2010 31264 26113
2011 31380 26470
2012 31816 26663
2013 32541 27338
2014 32878 27705
2015 33685 27900
4
2016 34011 28053
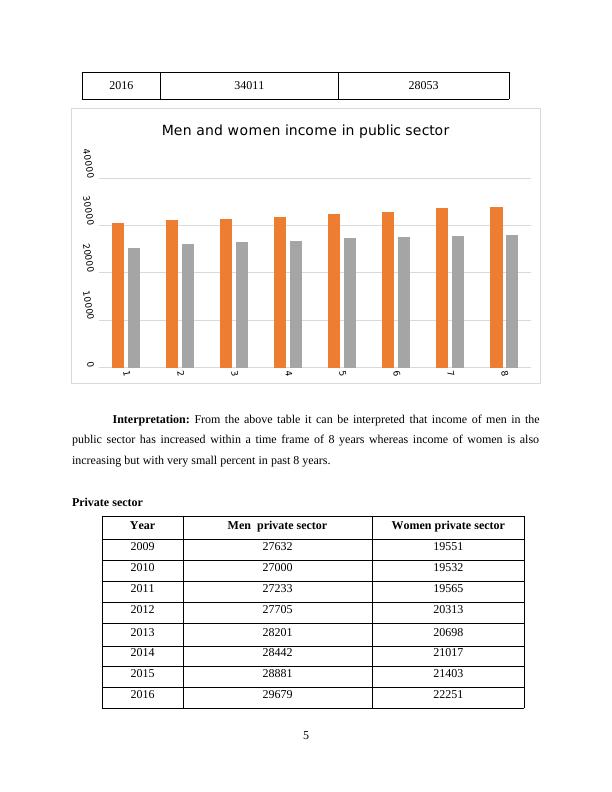
Interpretation: From the above table it can be interpreted that income of men in the
public sector has increased within a time frame of 8 years whereas income of women is also
increasing but with very small percent in past 8 years.
Private sector
Year Men private sector Women private sector
2009 27632 19551
2010 27000 19532
2011 27233 19565
2012 27705 20313
2013 28201 20698
2014 28442 21017
2015 28881 21403
2016 29679 22251
5
1
2
3
4
5
6
7
8
0
10000
20000
30000
40000
Men and women income in public sector
End of preview
Want to access all the pages? Upload your documents or become a member.
Related Documents
Statistics Financial in UKlg...
|28
|4065
|51
Statistics Solution Assignmentlg...
|21
|2421
|84
Statics Financial Induced Decisionlg...
|20
|3378
|379
Statistics for Management - PDFlg...
|15
|3039
|334
Statistics for Management Assignment Solved - Doclg...
|15
|2766
|74
Statistics for Management Solution Assignment - Doclg...
|20
|3871
|47