Statistics for Management Solution Assignment - Doc
20 Pages3871 Words47 Views
Added on 2021-02-19
Statistics for Management Solution Assignment - Doc
Added on 2021-02-19
ShareRelated Documents
STATISTICS FOR
MANAGEMENT
MANAGEMENT

TABLE OF CONTENTS
INTRODUCTION...........................................................................................................................3
MAIN BODY..................................................................................................................................3
TASK 1............................................................................................................................................3
A. Difference between earnings of men and women in public sector by testing of hypothesis. .3
B. Difference in the earnings of men and women in private sector through testing of
hypothesis....................................................................................................................................4
C. Earnings- Time Chart from 2009 to 2016...............................................................................5
D. Annual growth rate in earnings...............................................................................................7
TASK 2............................................................................................................................................8
Analysis and evaluation of hourly pay rates in different regions of UK.....................................8
TASK 3..........................................................................................................................................11
Section A...................................................................................................................................11
Section B....................................................................................................................................13
TASK 4..........................................................................................................................................13
Charts and Tables......................................................................................................................13
Relationship between the number of bedrooms and the price of houses in all the three streets16
CONCLUSION..............................................................................................................................17
REFERENCES................................................................................................................................1
Table 1: Public Sector Earnings of Men and Women................................................................4
Table 2: Earning in Private Sector...............................................................................................5
Table 3: Earnings in Public Sector...............................................................................................6
Table 4: Earnings in Private Sector.............................................................................................7
Table 5: Annual Growth Rate in Public Sector..........................................................................8
Table 6: Annual Growth Rate in Private Sector.........................................................................9
Table 7: Median Calculation of Hourly Earnings......................................................................9
Table 8: Calculation of Quartile Range.....................................................................................10
Table 9: Calculation of Arithmetic Mean..................................................................................11
Table 10: Calculation of Standard Deviation............................................................................11
Table 11: Comparison between Manchester and London.......................................................12
Table 12: Statistical Tables for Normal Distribution...............................................................13
Table 13: Economic Order Quantity.........................................................................................14
Table 14: Green Street Bedrooms..............................................................................................14
Table 15: Church Lane...............................................................................................................15
Table 16: Eton Avenue................................................................................................................16
Table 17: Percentage Change in Cost........................................................................................17
Figure 1: Normal Distribution Curve........................................................................................13
Figure 2: Cost of 2 and 3 Bedroom Houses in different Streets..............................................18
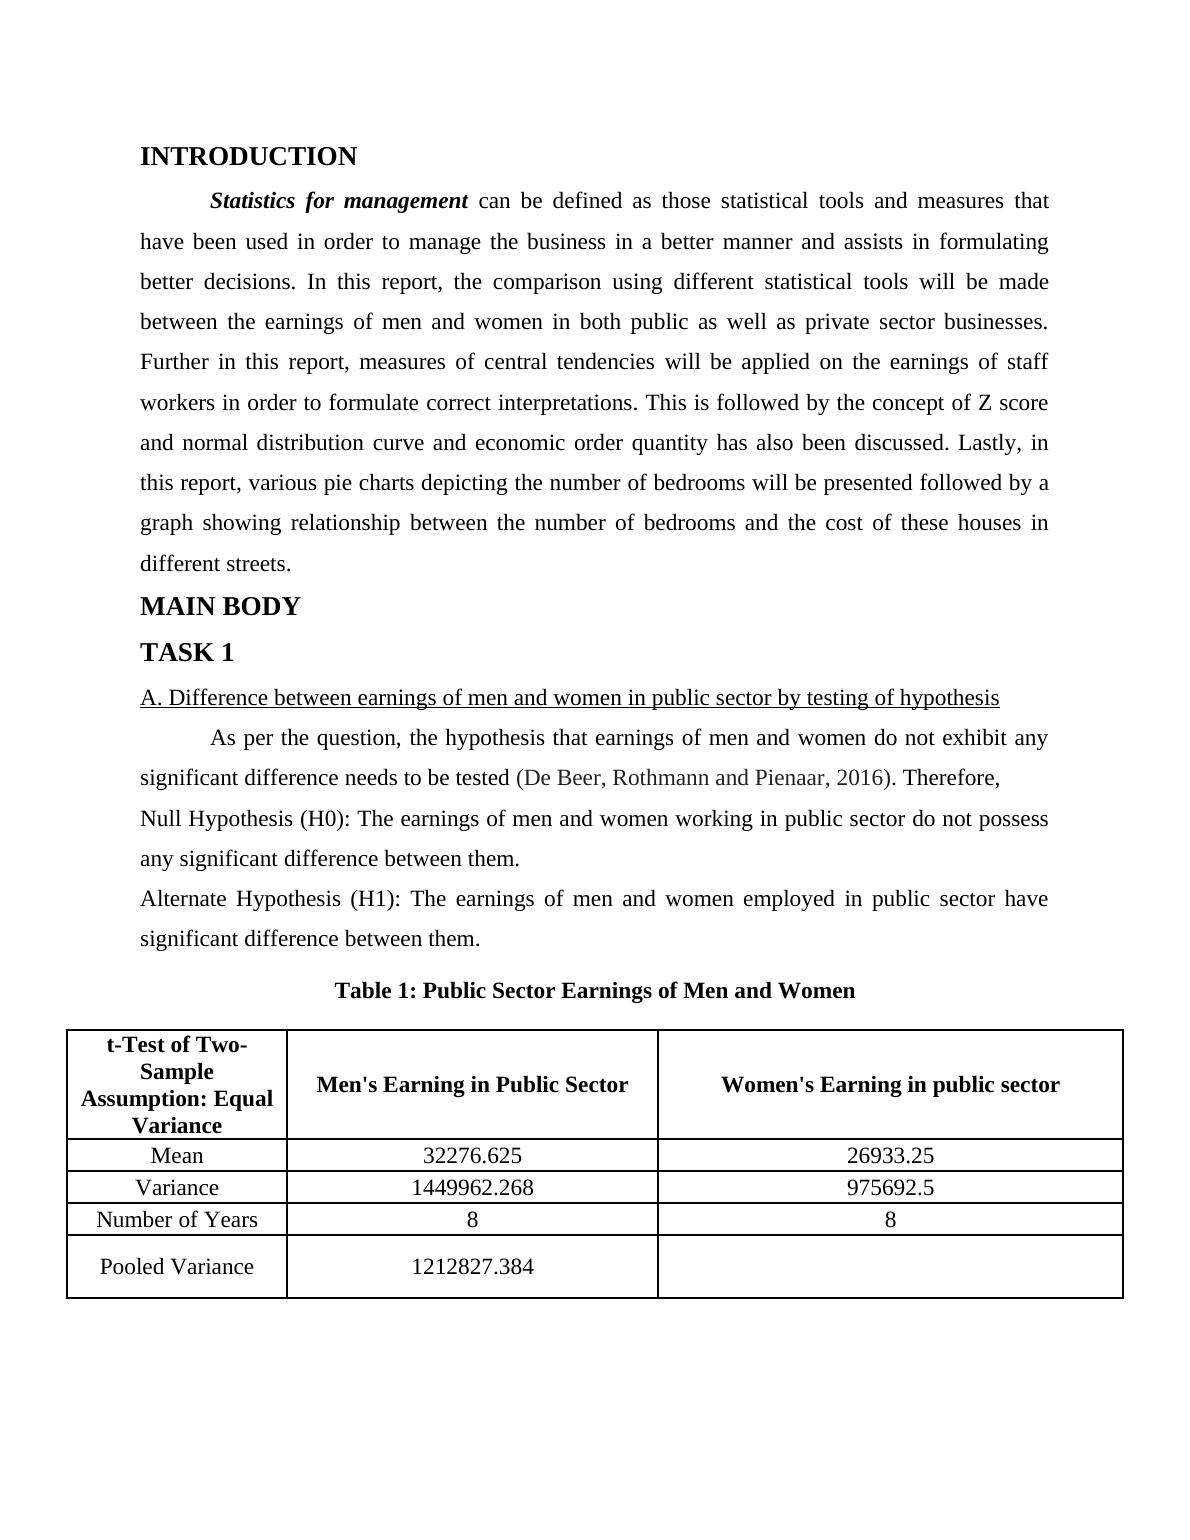
INTRODUCTION
Statistics for management can be defined as those statistical tools and measures that
have been used in order to manage the business in a better manner and assists in formulating
better decisions. In this report, the comparison using different statistical tools will be made
between the earnings of men and women in both public as well as private sector businesses.
Further in this report, measures of central tendencies will be applied on the earnings of staff
workers in order to formulate correct interpretations. This is followed by the concept of Z score
and normal distribution curve and economic order quantity has also been discussed. Lastly, in
this report, various pie charts depicting the number of bedrooms will be presented followed by a
graph showing relationship between the number of bedrooms and the cost of these houses in
different streets.
MAIN BODY
TASK 1
A. Difference between earnings of men and women in public sector by testing of hypothesis
As per the question, the hypothesis that earnings of men and women do not exhibit any
significant difference needs to be tested (De Beer, Rothmann and Pienaar, 2016). Therefore,
Null Hypothesis (H0): The earnings of men and women working in public sector do not possess
any significant difference between them.
Alternate Hypothesis (H1): The earnings of men and women employed in public sector have
significant difference between them.
Table 1: Public Sector Earnings of Men and Women
t-Test of Two-
Sample
Assumption: Equal
Variance
Men's Earning in Public Sector Women's Earning in public sector
Mean 32276.625 26933.25
Variance 1449962.268 975692.5
Number of Years 8 8
Pooled Variance 1212827.384
End of preview
Want to access all the pages? Upload your documents or become a member.
Related Documents
Statistics for Management INTRODUCTION 2 MAIN BODY2 TASK 12 B. Analysis and evaluatiolg...
|27
|3973
|312
Statistics Financial in UKlg...
|28
|4065
|51
Statistics Solution Assignmentlg...
|21
|2421
|84
Statistics for Management : Assignmentlg...
|18
|3053
|141
Statistics for Management - Doclg...
|20
|3814
|22
Statistical Analysis of Management Payslg...
|18
|3592
|347