(Doc) Statistics for Management Solved Assignment
21 Pages4225 Words34 Views
Added on 2021-02-21
(Doc) Statistics for Management Solved Assignment
Added on 2021-02-21
ShareRelated Documents
STATISTICS FOR
MANAGEMENT
MANAGEMENT
Table of Contents
INTRODUCTION...........................................................................................................................1
TASK 1............................................................................................................................................1
P1. Evaluating the nature and process of business and economic data/ information from a
range of different published sources............................................................................................1
P2. Business Data from variety of sources using different methods of analysis.........................3
TASK 2............................................................................................................................................4
P3. Analysing and evaluating qualitative and quantitative raw business data using appropriate
statistical methods........................................................................................................................4
TASK 3............................................................................................................................................8
P4. Application of a range of statistical methods used in business planning for quality,
inventory and capacity management............................................................................................8
TASK 4..........................................................................................................................................11
P5. Utilisation of appropriate charts/ tables to communicate findings for a number of given
variables.....................................................................................................................................11
CONCLUSION..............................................................................................................................13
REFERENCES..............................................................................................................................14
APPENDICES...............................................................................................................................15
INTRODUCTION
The present business environment demands agility and innovative advents on a rapid
scale. This is only possible when the business managers exploit the advantages of statistics and
employ it towards gaining valuable insights in regards to different areas of various managerial
functions that are pursued by a given business entity. Statistics can be defined as those scientific
tools and techniques which enable the management to explore ideas through summarisation of
large data sets so as to give them a meaningful context (Babu, 2012). This facilitates the practice
of informed decision-making within the organisation. The given report aims to provide a
comprehensive account on evaluation of business and economic data which is secured from
different published sources. Apart from this, appropriate statistical methods have been utilised to
seek enhancement of business planning procedures in regards to quality, inventory and capacity
management along with their communication through suitable charts and tables.
TASK 1
P1. Evaluating the nature and process of business and economic data/ information from a range
of different published sources
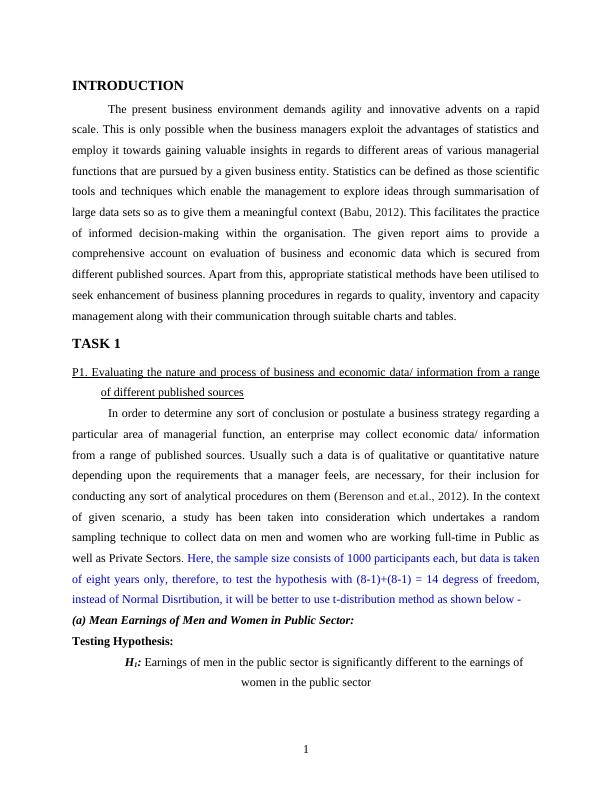
In order to determine any sort of conclusion or postulate a business strategy regarding a
particular area of managerial function, an enterprise may collect economic data/ information
from a range of published sources. Usually such a data is of qualitative or quantitative nature
depending upon the requirements that a manager feels, are necessary, for their inclusion for
conducting any sort of analytical procedures on them (Berenson and et.al., 2012). In the context
of given scenario, a study has been taken into consideration which undertakes a random
sampling technique to collect data on men and women who are working full-time in Public as
well as Private Sectors. Here, the sample size consists of 1000 participants each, but data is taken
of eight years only, therefore, to test the hypothesis with (8-1)+(8-1) = 14 degress of freedom,
instead of Normal Disrtibution, it will be better to use t-distribution method as shown below -
(a) Mean Earnings of Men and Women in Public Sector:
Testing Hypothesis:
H1: Earnings of men in the public sector is significantly different to the earnings of
women in the public sector
1
The present business environment demands agility and innovative advents on a rapid
scale. This is only possible when the business managers exploit the advantages of statistics and
employ it towards gaining valuable insights in regards to different areas of various managerial
functions that are pursued by a given business entity. Statistics can be defined as those scientific
tools and techniques which enable the management to explore ideas through summarisation of
large data sets so as to give them a meaningful context (Babu, 2012). This facilitates the practice
of informed decision-making within the organisation. The given report aims to provide a
comprehensive account on evaluation of business and economic data which is secured from
different published sources. Apart from this, appropriate statistical methods have been utilised to
seek enhancement of business planning procedures in regards to quality, inventory and capacity
management along with their communication through suitable charts and tables.
TASK 1
P1. Evaluating the nature and process of business and economic data/ information from a range
of different published sources
In order to determine any sort of conclusion or postulate a business strategy regarding a
particular area of managerial function, an enterprise may collect economic data/ information
from a range of published sources. Usually such a data is of qualitative or quantitative nature
depending upon the requirements that a manager feels, are necessary, for their inclusion for
conducting any sort of analytical procedures on them (Berenson and et.al., 2012). In the context
of given scenario, a study has been taken into consideration which undertakes a random
sampling technique to collect data on men and women who are working full-time in Public as
well as Private Sectors. Here, the sample size consists of 1000 participants each, but data is taken
of eight years only, therefore, to test the hypothesis with (8-1)+(8-1) = 14 degress of freedom,
instead of Normal Disrtibution, it will be better to use t-distribution method as shown below -
(a) Mean Earnings of Men and Women in Public Sector:
Testing Hypothesis:
H1: Earnings of men in the public sector is significantly different to the earnings of
women in the public sector
1
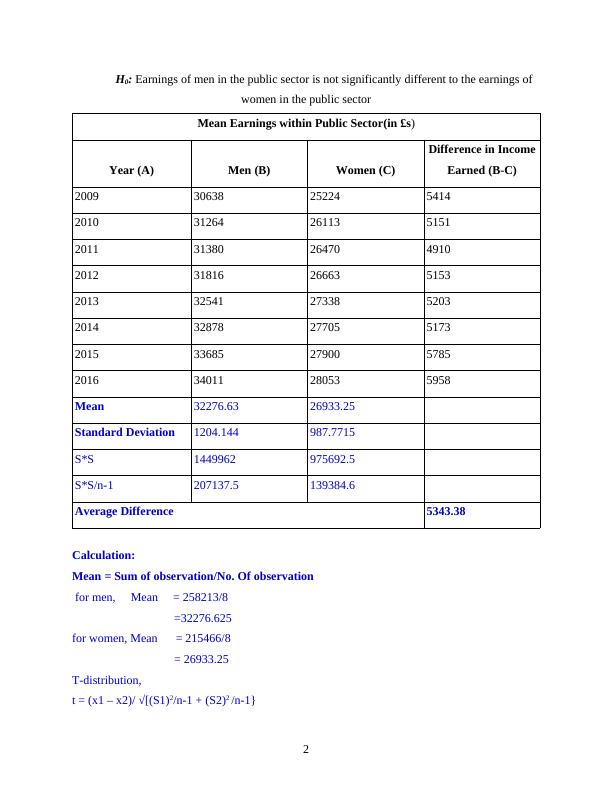
H0: Earnings of men in the public sector is not significantly different to the earnings of
women in the public sector
Mean Earnings within Public Sector(in £s)
Year (A) Men (B) Women (C)
Difference in Income
Earned (B-C)
2009 30638 25224 5414
2010 31264 26113 5151
2011 31380 26470 4910
2012 31816 26663 5153
2013 32541 27338 5203
2014 32878 27705 5173
2015 33685 27900 5785
2016 34011 28053 5958
Mean 32276.63 26933.25
Standard Deviation 1204.144 987.7715
S*S 1449962 975692.5
S*S/n-1 207137.5 139384.6
Average Difference 5343.38
Calculation:
Mean = Sum of observation/No. Of observation
for men, Mean = 258213/8
=32276.625
for women, Mean = 215466/8
= 26933.25
T-distribution,
t = (x1 – x2)/ √[(S1)2/n-1 + (S2)2 /n-1}
2
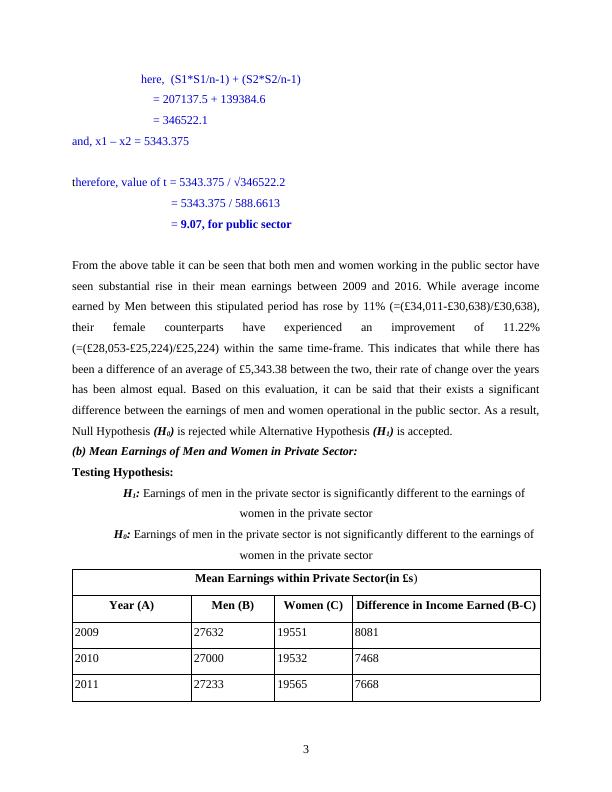
here, (S1*S1/n-1) + (S2*S2/n-1)
= 207137.5 + 139384.6
= 346522.1
and, x1 – x2 = 5343.375
therefore, value of t = 5343.375 / √346522.2
= 5343.375 / 588.6613
= 9.07, for public sector
From the above table it can be seen that both men and women working in the public sector have
seen substantial rise in their mean earnings between 2009 and 2016. While average income
earned by Men between this stipulated period has rose by 11% (=(£34,011-£30,638)/£30,638),
their female counterparts have experienced an improvement of 11.22%
(=(£28,053-£25,224)/£25,224) within the same time-frame. This indicates that while there has
been a difference of an average of £5,343.38 between the two, their rate of change over the years
has been almost equal. Based on this evaluation, it can be said that their exists a significant
difference between the earnings of men and women operational in the public sector. As a result,
Null Hypothesis (H0) is rejected while Alternative Hypothesis (H1) is accepted.
(b) Mean Earnings of Men and Women in Private Sector:
Testing Hypothesis:
H1: Earnings of men in the private sector is significantly different to the earnings of
women in the private sector
H0: Earnings of men in the private sector is not significantly different to the earnings of
women in the private sector
Mean Earnings within Private Sector(in £s)
Year (A) Men (B) Women (C) Difference in Income Earned (B-C)
2009 27632 19551 8081
2010 27000 19532 7468
2011 27233 19565 7668
3
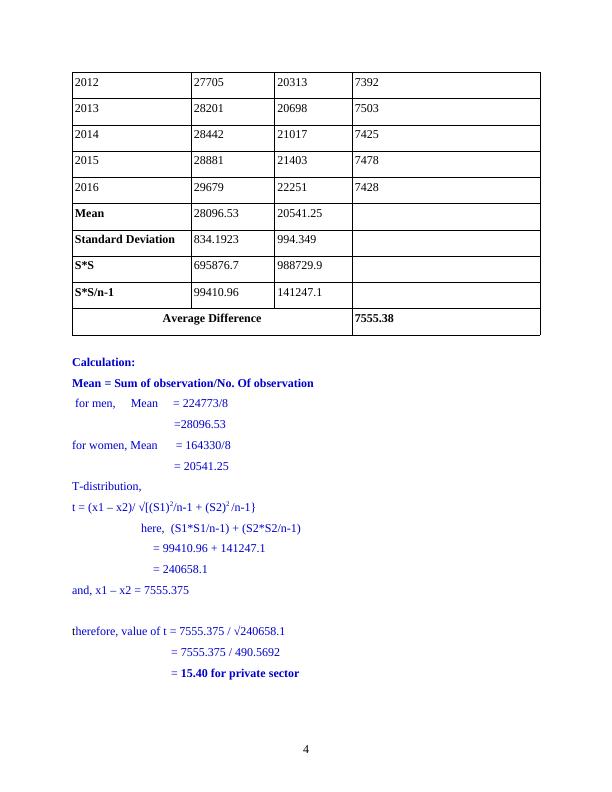
2012 27705 20313 7392
2013 28201 20698 7503
2014 28442 21017 7425
2015 28881 21403 7478
2016 29679 22251 7428
Mean 28096.53 20541.25
Standard Deviation 834.1923 994.349
S*S 695876.7 988729.9
S*S/n-1 99410.96 141247.1
Average Difference 7555.38
Calculation:
Mean = Sum of observation/No. Of observation
for men, Mean = 224773/8
=28096.53
for women, Mean = 164330/8
= 20541.25
T-distribution,
t = (x1 – x2)/ √[(S1)2/n-1 + (S2)2 /n-1}
here, (S1*S1/n-1) + (S2*S2/n-1)
= 99410.96 + 141247.1
= 240658.1
and, x1 – x2 = 7555.375
therefore, value of t = 7555.375 / √240658.1
= 7555.375 / 490.5692
= 15.40 for private sector
4
End of preview
Want to access all the pages? Upload your documents or become a member.
Related Documents
Statistics for Management Assignment (pdf)lg...
|19
|2579
|147
Statistics for Management in Businesslg...
|22
|2951
|69
Statistics For Management Doclg...
|19
|3164
|404
Statistics Solution Assignmentlg...
|21
|2421
|84
Economic Order Quantity (EOQ) Assignmentlg...
|18
|2545
|389
Statistics for Management: PDFlg...
|18
|5012
|422