Summary Report on Statistics
Process, organize, present, and summarize data on DeVry admissions for the past semester using Excel and analyze each variable using graphical and numerical techniques.
6 Pages553 Words48 Views
Added on 2022-12-27
About This Document
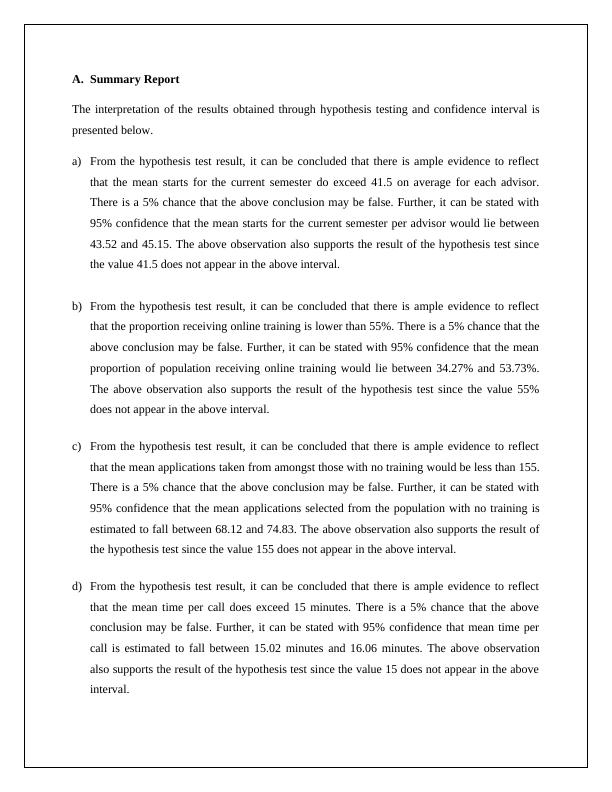
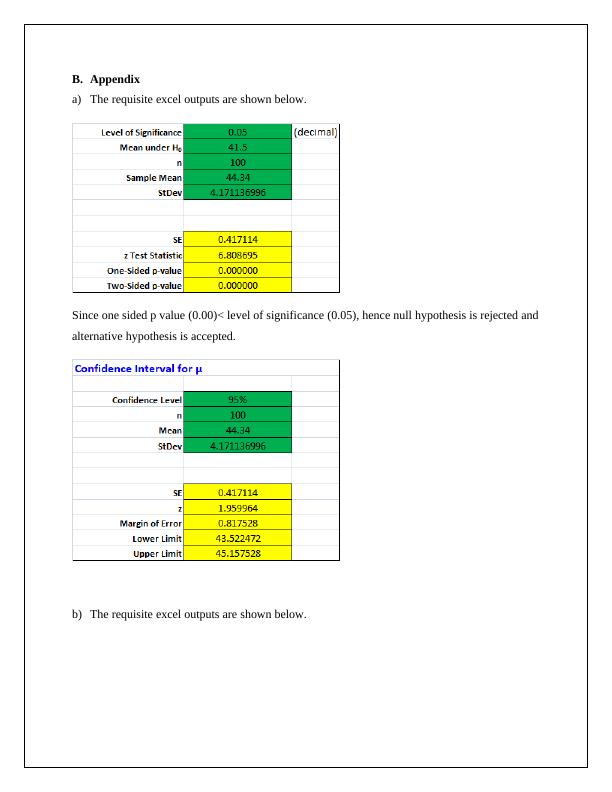
The interpretation of the results obtained through hypothesis testing and confidence interval is presented below. It concludes that there is ample evidence to reflect certain conclusions based on the hypothesis test results. The mean starts for the current semester exceed 41.5 on average for each advisor, the proportion receiving online training is lower than 55%, the mean applications taken from those with no training is less than 155, and the mean time per call exceeds 15 minutes. The confidence intervals for each conclusion are also provided.
Summary Report on Statistics
Process, organize, present, and summarize data on DeVry admissions for the past semester using Excel and analyze each variable using graphical and numerical techniques.
Added on 2022-12-27
ShareRelated Documents
End of preview
Want to access all the pages? Upload your documents or become a member.
Statistics of Business & Finance - Calculations and Interpretation
|8
|1191
|326
STATISTICS 8. : STATISTICS 1.ssdfasdfdas
|7
|624
|1
Assignment: The Value of Business Statistics for Students
|4
|601
|13
Business Analytics: Report
|7
|914
|39
Statistics for Business and Financial Economics
|12
|1371
|45
STAT2009 Research Methods in The Social Sciences
|12
|1369
|221